

Japanese encephalitis virus activates autophagy as a viral immune evasion strategy
- PMID: 23320079
- PMCID: PMC3540057
- DOI: 10.1371/journal.pone.0052909
Japanese encephalitis virus activates autophagy as a viral immune evasion strategy
Erratum in
- PLoS One. 2013;8(5). doi:10.1371/annotation/f7dcec2f-ed82-4a31-96c6-2953b421fd92
Abstract
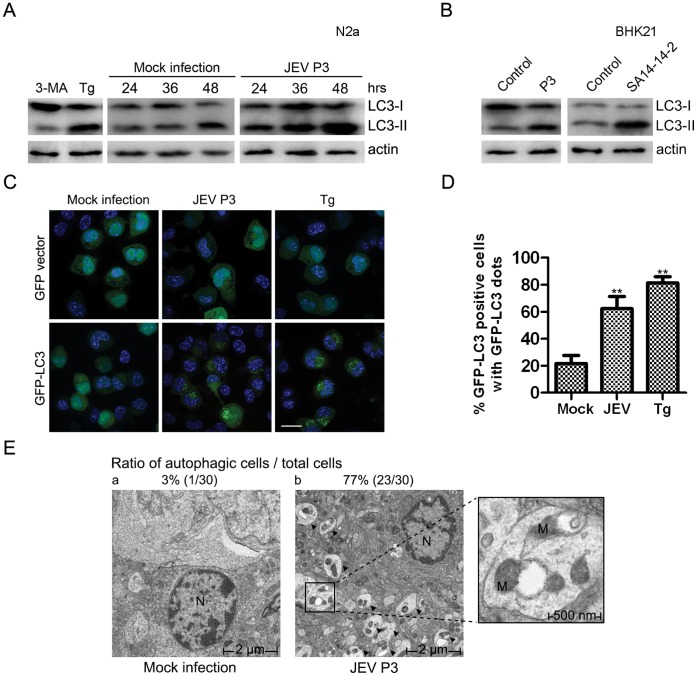
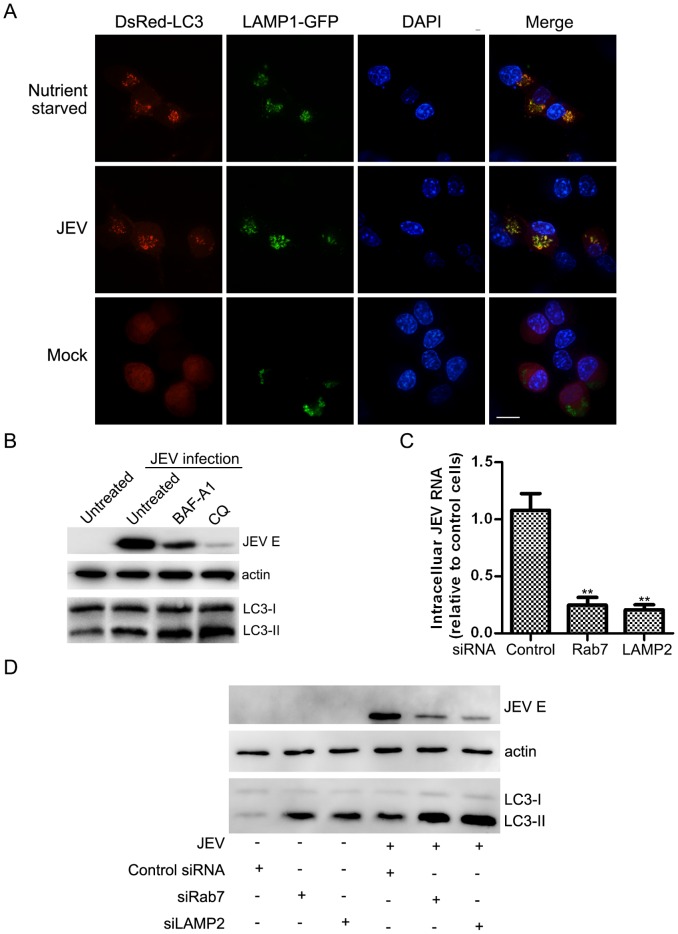
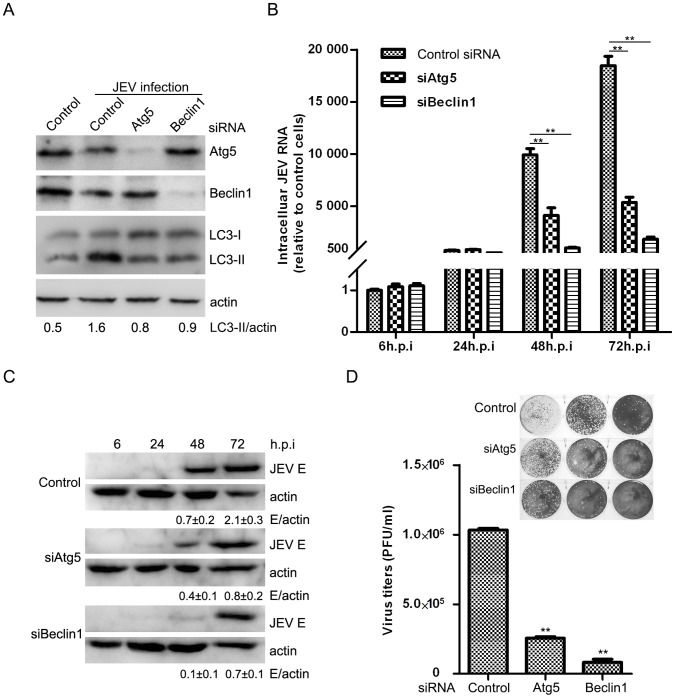
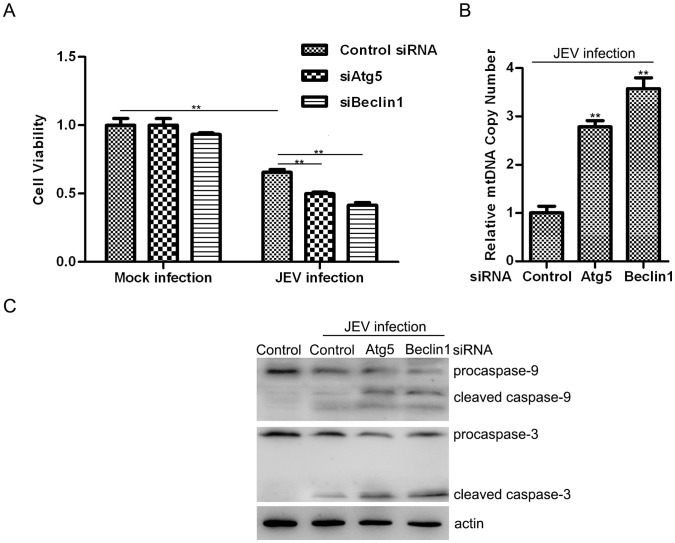
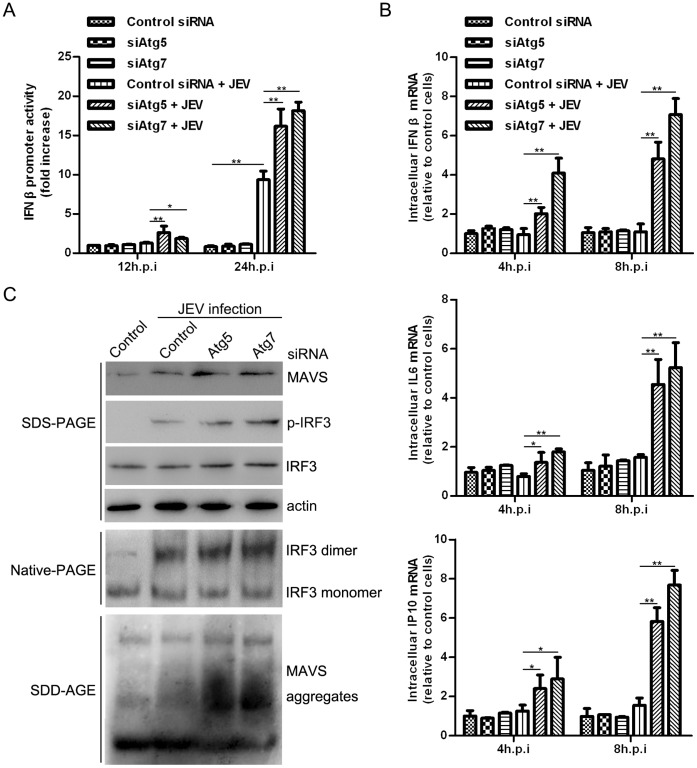
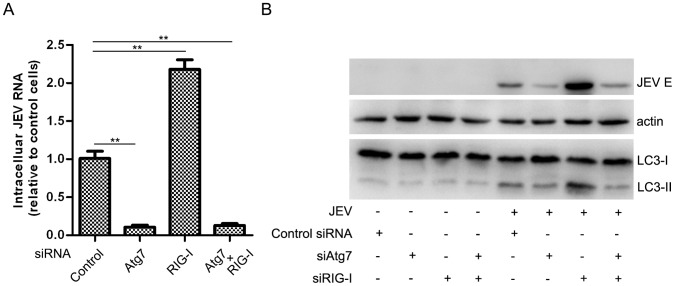
In addition to manipulating cellular homeostasis and survivability, autophagy also plays a crucial role in numerous viral infections. In this study, we discover that Japanese encephalitis virus (JEV) infection results in the accumulation of microtubule-associated protein 1 light chain 3-II (LC3-II) protein and GFP-LC3 puncta in vitro and an increase in autophagosomes/autolysosomes in vivo. The fusion between autophagosomes and lysosomes is essential for virus replication. Knockdown of autophagy-related genes reduced JEV replication in vitro, as indicated by viral RNA and protein levels. We also note that JEV infection in autophagy-impaired cells displayed active caspases cleavage and cell death. Moreover, we find that JEV induces higher type I interferon (IFN) activation in cells deficient in autophagy-related genes as the cells exhibited increased phosphorylation and dimerization of interferon regulatory factor 3 (IRF3) and mitochondrial antiviral signaling protein (MAVS) aggregation. Finally, we find that autophagy is indispensable for efficient JEV replication even in an IFN-defective background. Overall, our studies provide the first description of the mechanism of the autophagic innate immune signaling pathway during JEV infection.
Conflict of interest statement
Figures

Similar articles
-
Japanese Encephalitis Virus NS1' Protein Interacts with Host CDK1 Protein to Regulate Antiviral Response.Microbiol Spectr. 2021 Dec 22;9(3):e0166121. doi: 10.1128/Spectrum.01661-21. Epub 2021 Nov 10. Microbiol Spectr. 2021. PMID: 34756071 Free PMC article.
-
E3 ubiquitin ligase MARCH5 positively regulates Japanese encephalitis virus infection by catalyzing the K27-linked polyubiquitination of viral E protein and inhibiting MAVS-mediated type I interferon production.mBio. 2025 Apr 9;16(4):e0020825. doi: 10.1128/mbio.00208-25. Epub 2025 Mar 12. mBio. 2025. PMID: 40071916 Free PMC article.
-
Enhancement of autophagy as a strategy for development of new DNA vaccine candidates against Japanese encephalitis.Vaccine. 2019 Sep 3;37(37):5588-5595. doi: 10.1016/j.vaccine.2019.07.093. Epub 2019 Aug 6. Vaccine. 2019. PMID: 31399273
-
Japanese encephalitis virus: from genome to infectome.Microbes Infect. 2011 Apr;13(4):312-21. doi: 10.1016/j.micinf.2011.01.002. Epub 2011 Jan 14. Microbes Infect. 2011. PMID: 21238600 Review.
-
Role of inflammatory cytokine burst in neuro-invasion of Japanese Encephalitis virus infection: an immunotherapeutic approaches.J Neurovirol. 2024 Jun;30(3):251-265. doi: 10.1007/s13365-024-01212-z. Epub 2024 Jun 6. J Neurovirol. 2024. PMID: 38842651 Review.
Cited by
-
How positive-strand RNA viruses benefit from autophagosome maturation.J Virol. 2013 Sep;87(18):9966-72. doi: 10.1128/JVI.00460-13. Epub 2013 Jun 12. J Virol. 2013. PMID: 23760248 Free PMC article. Review.
-
Zika virus depletes neural stem cells and evades selective autophagy by suppressing the Fanconi anemia protein FANCC.EMBO Rep. 2020 Dec 3;21(12):e49183. doi: 10.15252/embr.201949183. Epub 2020 Oct 19. EMBO Rep. 2020. PMID: 33073500 Free PMC article.
-
Autophagy, Unfolded Protein Response, and Neuropilin-1 Cross-Talk in SARS-CoV-2 Infection: What Can Be Learned from Other Coronaviruses.Int J Mol Sci. 2021 Jun 1;22(11):5992. doi: 10.3390/ijms22115992. Int J Mol Sci. 2021. PMID: 34206057 Free PMC article. Review.
-
Autophagy is highly targeted among host comparative proteomes during infection with different virulent RABV strains.Oncotarget. 2017 Mar 28;8(13):21336-21350. doi: 10.18632/oncotarget.15184. Oncotarget. 2017. PMID: 28186992 Free PMC article.
-
Phosphorylation of PRAS40 contributes to the activation of the PI3K/AKT/mTOR signaling pathway and the inhibition of autophagy following status epilepticus in rats.Exp Ther Med. 2020 Oct;20(4):3625-3632. doi: 10.3892/etm.2020.9085. Epub 2020 Jul 31. Exp Ther Med. 2020. PMID: 32855714 Free PMC article.
References
-
- Chang TH, Liao CL, Lin YL (2006) Flavivirus induces interferon-beta gene expression through a pathway involving RIG-I-dependent IRF-3 and PI3K-dependent NF-kappa B activation. Microbes Infect 8: 157–171. - PubMed
-
- Levine B, Klionsky DJ (2004) Development by self-digestion: Molecular mechanisms and biological functions of autophagy. Dev Cell 6: 463–477. - PubMed
Publication types
MeSH terms
Substances
LinkOut - more resources
Full Text Sources
Other Literature Sources
Research Materials
Miscellaneous
