

Nociceptive transmission to rat primary somatosensory cortex--comparison of sedative and analgesic effects
- PMID: 23320109
- PMCID: PMC3540052
- DOI: 10.1371/journal.pone.0053966
Nociceptive transmission to rat primary somatosensory cortex--comparison of sedative and analgesic effects
Abstract
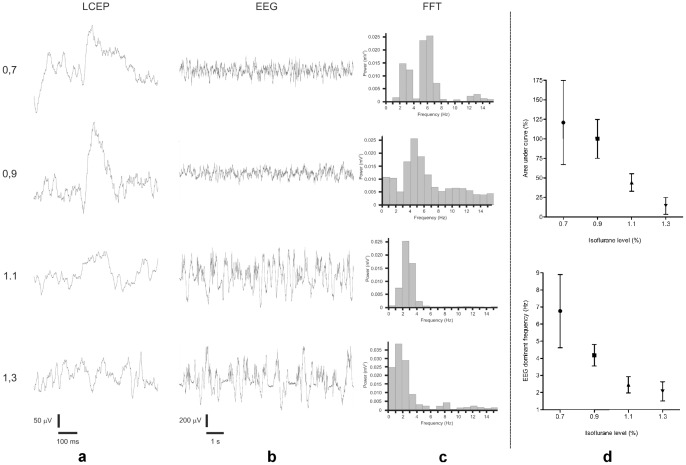
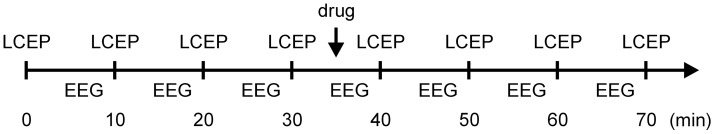
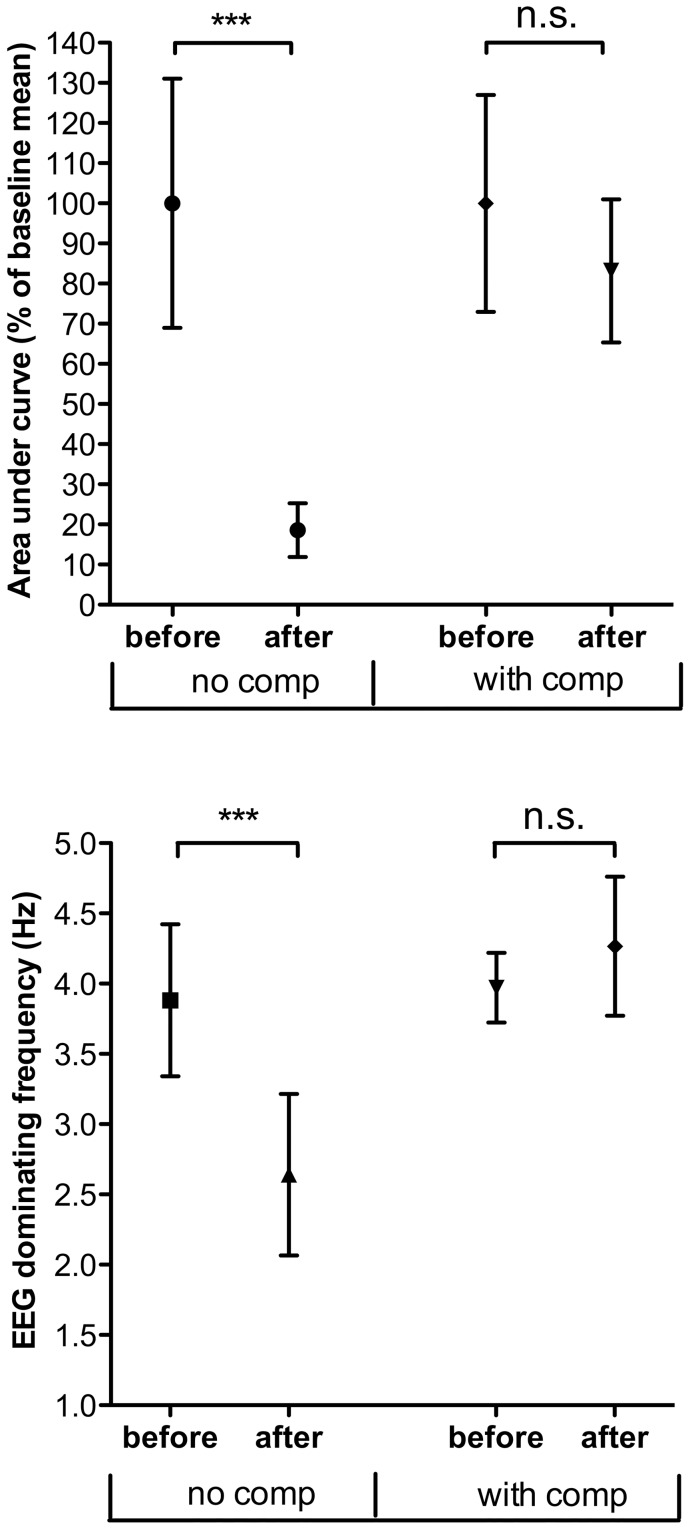
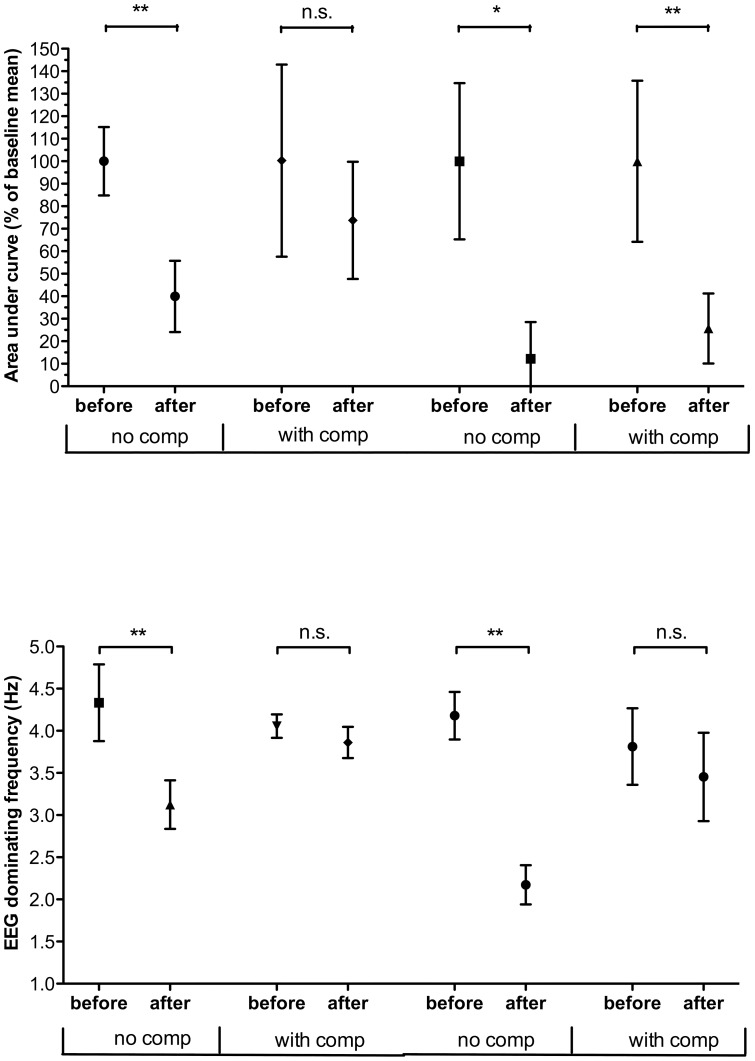
CO(2)-laser C-fibre evoked cortical potentials (LCEPs) is a potentially useful animal model for studies of pain mechanisms. A potential confounding factor when assessing analgesic effects of systemically administered drugs using LCEP is sedation. This study aims to clarify: 1) the relation between level of anaesthesia and magnitude of LCEP, 2) the effects of a sedative and an analgesic on LCEP and dominant EEG frequency 3) the effects of a sedative and analgesic on LCEP when dominant EEG frequency is kept stable. LCEP and EEG were recorded in isoflurane/nitrous-oxide anaesthetized rats. Increasing isoflurane level gradually reduced LCEPs and lowered dominant EEG frequencies. Systemic midazolam (10 μmol/kg) profoundly reduced LCEP (19% of control) and lowered dominant EEG frequency. Similarly, morphine 1 and 3 mg/kg reduced LCEP (39%, 12% of control, respectively) and decreased EEG frequency. When keeping the dominant EEG frequency stable, midazolam caused no significant change of LCEP. Under these premises, morphine at 3 mg/kg, but not 1 mg/kg, caused a significant LCEP reduction (26% of control). In conclusion, the present data indicate that the sedative effects should be accounted for when assessing the analgesic effects of drug. Furthermore, it is suggested that LCEP, given that changes in EEG induced by sedation are compensated for, can provide information about the analgesic properties of systemically administrated drugs.
Conflict of interest statement
Figures
References
-
- Bishop T, Hewson DW, Yip PK, Fahey MS, Dawbarn D, et al. (2007) Characterisation of ultraviolet-B-induced inflammation as a model of hyperalgesia in the rat. Pain 131: 70–82. - PubMed
-
- Davies SL, Siau C, Bennett GJ (2005) Characterization of a model of cutaneous inflammatory pain produced by an ultraviolet irradiation-evoked sterile injury in the rat. J Neurosci Methods 148: 161–166. - PubMed
-
- Koltzenburg M, Torebjork HE, Wahren LK (1994) Nociceptor modulated central sensitization causes mechanical hyperalgesia in acute chemogenic and chronic neuropathic pain. Brain 117 (Pt 3): 579–591. - PubMed
-
- McMahon SB, Lewin G, Bloom SR (1991) The consequences of long-term topical capsaicin application in the rat. Pain 44: 301–310. - PubMed
-
- Munro G, Baek CA, Erichsen HK, Nielsen AN, Nielsen EO, et al. (2008) The novel compound (+/−)-1-[10-((E)-3-Phenyl-allyl)-3,10-diaza-bicyclo[4.3.1]dec-3-yl]-propan-1-one (NS7051) attenuates nociceptive transmission in animal models of experimental pain; a pharmacological comparison with the combined mu-opioid receptor agonist and monoamine reuptake inhibitor tramadol. Neuropharmacology 54: 331–343. - PubMed
Publication types
MeSH terms
Substances
LinkOut - more resources
Full Text Sources
Other Literature Sources
