

Illuminating the lateral organization of cell-surface CD24 and CD44 through plasmon coupling between Au nanoparticle immunolabels
- PMID: 23320416
- PMCID: PMC3669593
- DOI: 10.1021/ac303310j
Illuminating the lateral organization of cell-surface CD24 and CD44 through plasmon coupling between Au nanoparticle immunolabels
Abstract
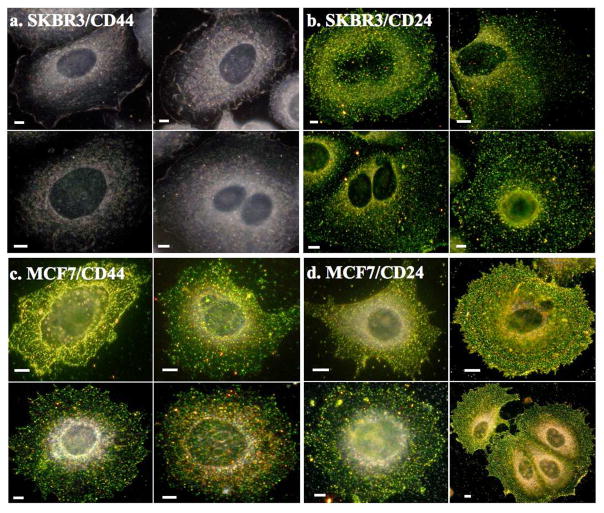
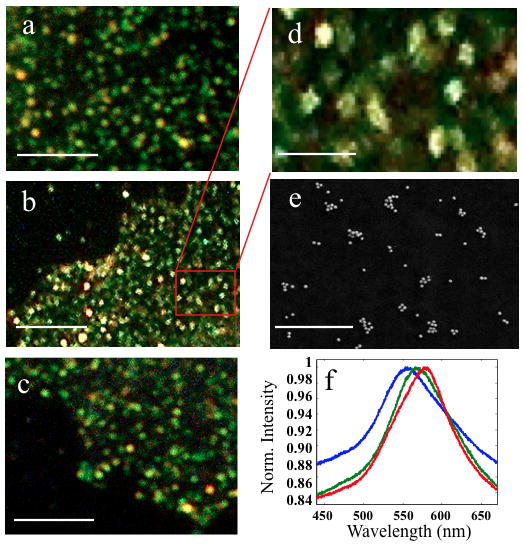
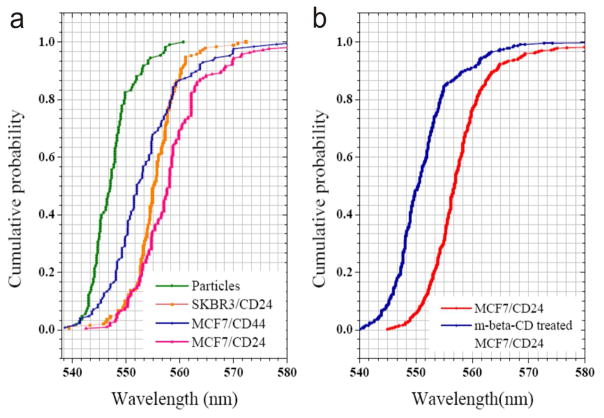
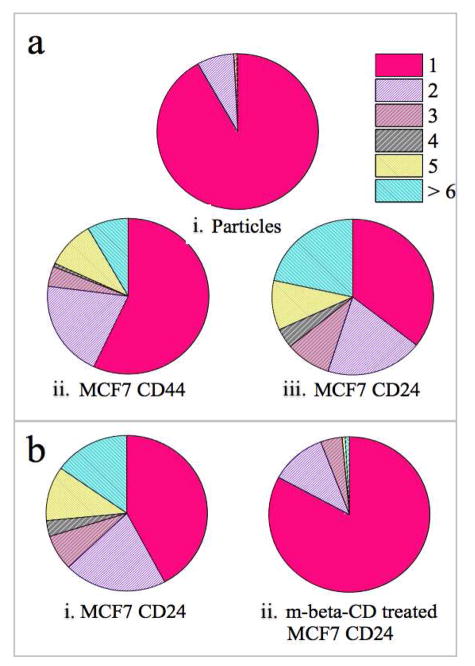
CD44 and CD24 are important cell surface glycoproteins whose relative expression levels are used to identify so-called cancer stem cells (CSCs). While current diagnostic applications of CD44 and CD24 focus primarily on their expression levels, we demonstrate here that noble metal nanoparticle (NP) immunolabeling in combination with plasmon coupling microscopy (PCM) can reveal more subtle differences, such as the spatial organization of these surface species on subdiffraction limit length scales. We quantified both expression and spatial clustering of CD44 and CD24 on MCF7 and SKBR3 breast cancer cells through analysis of the labeling intensity and the electromagnetic coupling of the NP labels, respectively. The labeling intensity was well correlated with the receptor expression, but the inspection of the labeled cell surface in the optical microscope revealed that the NP immunolabels were not homogeneously distributed. Consistent with a heterogeneous spatial distribution of the targeted CD24 and CD44 in the plasma membrane, a significant fraction of the NPs were organized into clusters, which were easily detectable in the optical microscope as discrete spots with colors ranging from green to orange. To further quantify the spatial organization of the targeted proteins, we characterized individual NP clusters through spatially resolved elastic scattering spectroscopy. The statistical analysis of the single cluster spectra revealed a higher clustering affinity for CD24 than for CD44 in the investigated cancer models. This preferential clustering was removed upon lipid raft disruption through cholesterol sequestration. Overall, these observations confirm a preferential enrichment of CD24 in lipid rafts and a more random distribution of CD44 in the plasma membrane as cause for the observed differences in protein clustering.
Figures
Similar articles
-
Quantification of differential ErbB1 and ErbB2 cell surface expression and spatial nanoclustering through plasmon coupling.Nano Lett. 2012 Jun 13;12(6):3231-7. doi: 10.1021/nl3012227. Epub 2012 May 21. Nano Lett. 2012. PMID: 22587495 Free PMC article.
-
Monitoring the size and lateral dynamics of ErbB1 enriched membrane domains through live cell plasmon coupling microscopy.PLoS One. 2012;7(3):e34175. doi: 10.1371/journal.pone.0034175. Epub 2012 Mar 28. PLoS One. 2012. PMID: 22470534 Free PMC article.
-
Illuminating epidermal growth factor receptor densities on filopodia through plasmon coupling.ACS Nano. 2011 Aug 23;5(8):6619-28. doi: 10.1021/nn202055b. Epub 2011 Jul 22. ACS Nano. 2011. PMID: 21761914 Free PMC article.
-
Significance of CD44 and CD24 as cancer stem cell markers: an enduring ambiguity.Clin Dev Immunol. 2012;2012:708036. doi: 10.1155/2012/708036. Epub 2012 May 30. Clin Dev Immunol. 2012. PMID: 22693526 Free PMC article. Review.
-
Breast cancer stem cells and intrinsic subtypes: controversies rage on.Curr Stem Cell Res Ther. 2009 Jan;4(1):50-60. doi: 10.2174/157488809787169110. Curr Stem Cell Res Ther. 2009. PMID: 19149630 Review.
Cited by
-
Cholesterol Functionalization of Gold Nanoparticles Enhances Photoactivation of Neural Activity.ACS Chem Neurosci. 2019 Mar 20;10(3):1478-1487. doi: 10.1021/acschemneuro.8b00486. Epub 2019 Jan 15. ACS Chem Neurosci. 2019. PMID: 30589551 Free PMC article.
-
Rapid determination of plasmonic nanoparticle agglomeration status in blood.Biomaterials. 2015 May;51:226-237. doi: 10.1016/j.biomaterials.2015.01.072. Epub 2015 Feb 19. Biomaterials. 2015. PMID: 25771013 Free PMC article.
-
Spectral signatures of charge transfer in assemblies of molecularly-linked plasmonic nanoparticles.Int J Mod Phys B. 2017 Sep 30;31(24):1740002. doi: 10.1142/s0217979217400021. Epub 2017 Apr 13. Int J Mod Phys B. 2017. PMID: 29391660 Free PMC article.
-
Regulation of ErbB2 localization and function in breast cancer cells by ERM proteins.Oncotarget. 2016 May 3;7(18):25443-60. doi: 10.18632/oncotarget.8327. Oncotarget. 2016. PMID: 27029001 Free PMC article.
-
Roadmap on optical sensors.J Opt. 2017 Aug;19(8):083001. doi: 10.1088/2040-8986/aa7419. Epub 2017 Jul 24. J Opt. 2017. PMID: 29375751 Free PMC article.
References
-
- Runz S, Mierke CT, Joumaa S, Behrens J, Fabry B, Altevogt P. Biochem Bioph Res Co. 2008;365(1):35–41. - PubMed
-
- Lingwood D, Simons K. Science. 2010;327(5961):46–50. - PubMed
-
- Ghatak S, Misra S, Toole BP. J Biol Chem. 2005;280(10):8875–83. - PubMed
-
- de Almeida RF, Loura LM, Fedorov A, Prieto M. J Mol Biol. 2005;346(4):1109–20. - PubMed
Publication types
MeSH terms
Substances
Grants and funding
LinkOut - more resources
Full Text Sources
Other Literature Sources
Miscellaneous
