. 2013 Sep;6(5):960-71.
doi: 10.1038/mi.2012.134. Epub 2013 Jan 16.

Inhibition of N-terminal ATPase on HSP90 attenuates colitis through enhanced Treg function

Affiliations

Inhibition of N-terminal ATPase on HSP90 attenuates colitis through enhanced Treg function

C B Collins et al. Mucosal Immunol. 2013 Sep.

Abstract

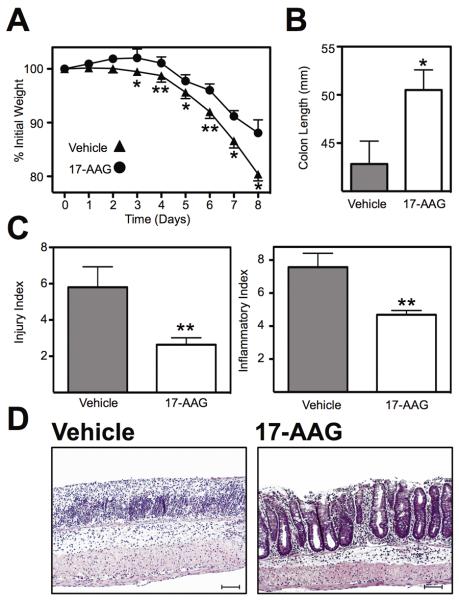
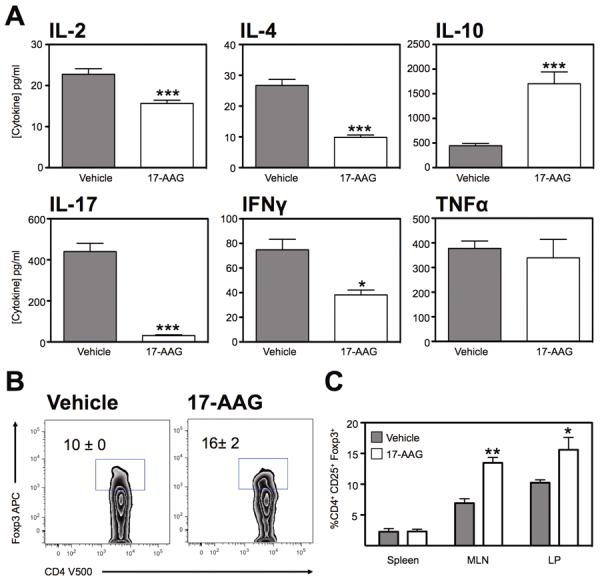
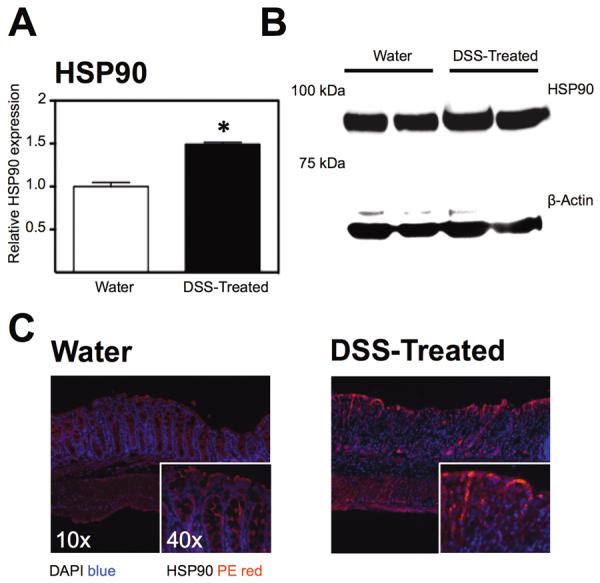
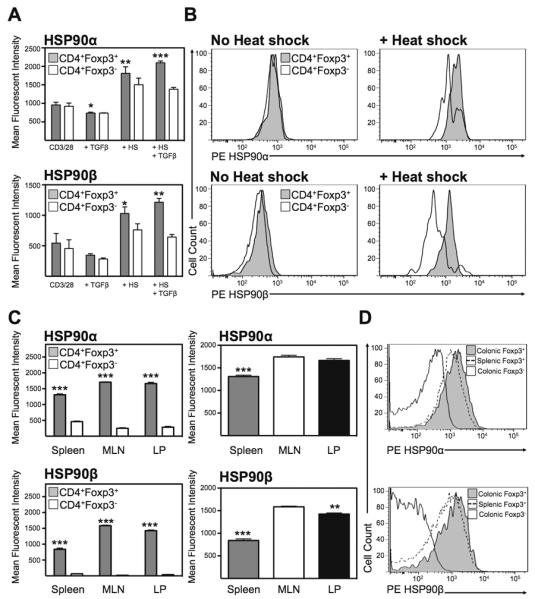
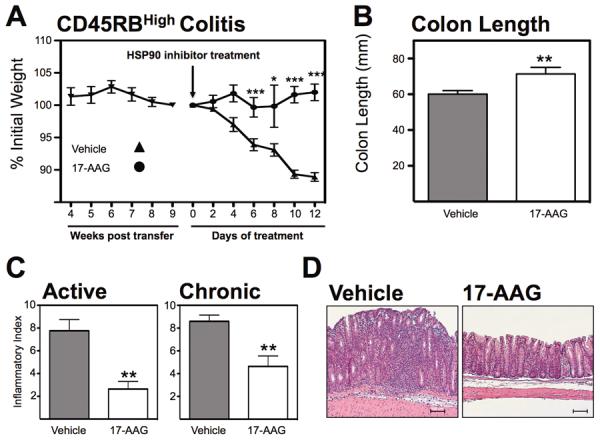
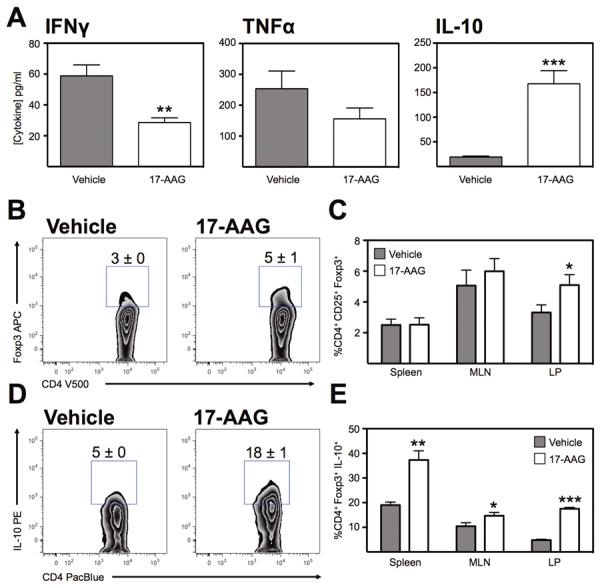
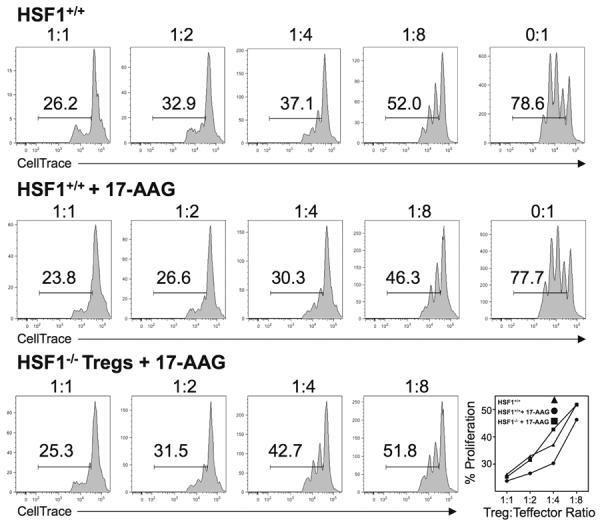
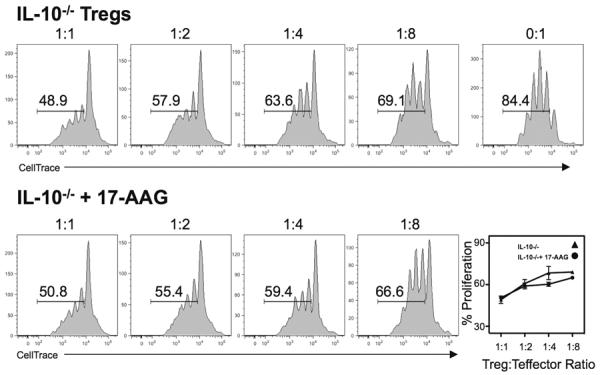
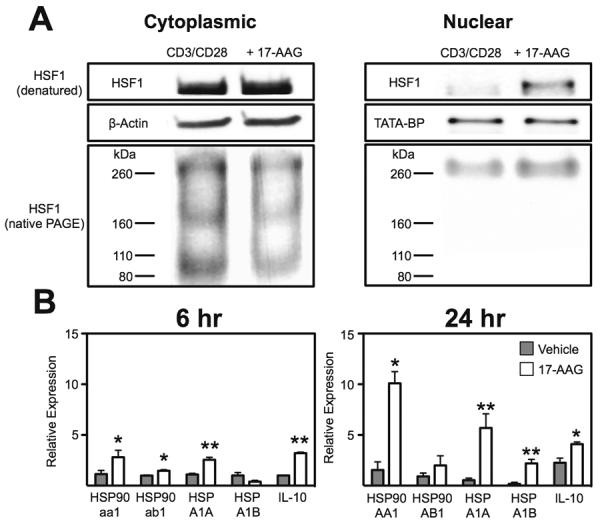
Inflammatory bowel disease (IBD) is a chronic inflammatory condition thought to reflect a failure of the enteral immune system to adequately regulate itself. Inflammatory stress drives upregulation of heat-shock proteins (HSPs), including the pro-inflammatory chaperone, HSP90. This protein sequesters the transcription factor, heat-shock factor 1 (HSF1) in the cytoplasm preventing transcription of a number of anti-inflammatory proteins. We hypothesized that inhibition of HSP90 would exert an anti-inflammatory effect and thereby attenuate intestinal inflammation in murine models of IBD. Inhibition of HSP90 with 17-allylaminogeldanamycin (17-AAG) reduced inflammation in acute dextran sodium sulfate and chronic CD45RB(High) colitis models coinciding with increased interleukin (IL)-10 production in the colon. Regulatory T cells (Tregs) from mice treated with 17-AAG demonstrated significantly greater suppressive capacity in vitro abolished in HSF1-/- or IL-10-/- cells. Finally, Tregs treated with 17-AAG exhibited increased nuclear localization of HSF1 with resultant upregulation of HSF1 response genes, including HSP70, HSP90 and IL-10.


Figures

Figure 1
Figure 1
HSP90 inhibition attenuated chemically-induced murine colitis. (A) Weight loss of mice treated with vehicle or 17-AAG during DSS colitis. Mean % weight loss ± SEM from n≥8 mice, *P<0.05, **P<0.01. (B) Colon length (mm) of mice following DSS colitis measured postmortem, *P<0.05. (C) Histological evaluation of indices of inflammation (injury and inflammation) by a trained pathologist (PJ) in a blinded fashion, **P<0.01. (D) Representative micrographs of colonic H&E sections from mice each treatment group. Black scale bar indicates 100μm.
Figure 2
Figure 2
Altered cytokine profile from the inflamed colon following HSP90 inhibition. (A) Multiplex analysis of IL-2, IL-4, IL-10, IL-17, IFNγ and TNFα expression from 24hr culture of colonic explants from DSS colitic mice treated with 17-AAG. Mean ± SEM for n=4 individual mice, *P<0.05, ***P<0.001. (B) Representative zebra plot of CD4 T cells from the lamina propria of DSS colitic mice treated with vehicle or 17-AAG, showing expression of Foxp3. (C) Percentage of CD4+ T cells that are Foxp3+ from indicated organs of colitic mice. Mean ± SEM, n=3, *P<0.05, **P<0.01.
Figure 3
Figure 3
Protein expression and localization of HSP90 in the inflamed mouse colon compared with untreated controls. (A) Densitometric determination of HSP90 expression in colonic tissue from water-treated or DSS-treated mice, *P<0.05. (B) Representative western blot of HSP90 expression from water and DSS-treated mouse colonic homogenates. (C) Representative immunofluorescent micrographs showing staining for HSP90 in PE at 10× and 40× magnification at room temperature using a Zeiss Axio Imager A1 Microscope with Axiovision 4.6 acquisition software.
Figure 4
Figure 4
Heat shock-induced HSP90α and HSPβ expression on mouse Tregs. (A) Mean fluorescent intensity of HSP90α and HSP90β expression in permeabilized newly converted CD4+CD25+Foxp3+ Tregs compared with non-Tregs with(out) heat shock. Mean ± SEM, n=3, *P<0.05, **P<0.01, ***P<0.001. (B) Representative histograms of expression of HSP90α and HSP90β on permeabilized CD4+Foxp3+ (grey) or CD4+Foxp3Neg cells (white). (C) Mean fluorescent intensity of HSP90α and HSP90β expression in permeabilized newly converted CD4+CD25+Foxp3+ Tregs compared with non-Tregs with(out) heat shock. Mean ± SEM, n=3, **P<0.01, ***P<0.001. (D) Representative histograms of expression of HSP90α and HSP90β on permeabilized CD4+Foxp3+ from the colonic LP (grey), the spleen (dashed line) or CD4+Foxp3Neg cells (white).
Figure 5
Figure 5
HSP90 inhibition attenuates established adoptive-transfer colitis. (A) Weight-loss curve of RAG1−/− mice adoptively transferred CD45RBHigh cells treated with vehicle or 17-AAG upon establishment of disease, *P<0.05, ***P<0.001 (B) Postmortem measurement of colon length of CD45RBHigh cell recipient with(out) treatment with 17-AAG (40mg/kg/day). Mean ± SEM, **P<0.01. (C) Histological evaluation of indices of active and chronic inflammation in CD45RBHigh model of colitis by a trained pathologist in a blinded fashion. **P<0.01. (D) Representative micrographs of colonic H&E sections from mice each treatment group. Black scale bar indicates 100μm
Figure 6
Figure 6
HSP90 inhibition increases IL-10 production and Foxp3 expression in the inflamed colon. (A) Multiplex analysis of IFNγ, TNFα and IL-10 expression from 24hr culture of colonic explants from CD45RBHigh adoptive-transfer colitic mice treated with 17-AAG. Mean ± SEM for n=4 individual mice, **P<0.01, ***P<0.001. (B) Representative zebra plot of CD4+ T cells from the lamina propria of CD45RBHigh colitic mice treated with vehicle or 17-AAG, showing expression of Foxp3. (C) Percentage of CD4+ T cells that are Foxp3+ from indicated organs of colitic mice, *P<0.05. (D) Representative zebra plots of IL-10 expression in CD4+Foxp3+ Tregs isolated from the colonic LP of CD45RBHgh colitis. (E) Percentage of CD4+Foxp3+ IL-10+ Tregs following vehicle or 17-AAG (40mg/kg/day) treatment. Mean ± SEM, n≥4, *P<0.05, **P<0.01, ***P<0.001.
Figure 7
Figure 7
HSP90 inhibition enhances regulatory T cell function in vitro via HSF1. Representative histograms of CellTrace-labeled CD4+ T cells co-cultured with decreasing concentrations of CD4+CD25+ Tregs from HSF1+/+ vehicle-treated mice or HSF1+/+ and HSF1−/− mice treated with 17-AAG. Proliferation of CD3-stimulated CD4+ co-cultured with Tregs from vehicle or 17-AAG-treated mice. Results representative of N=3 individual experiments with similar results.
Figure 8
Figure 8
Enhancing suppressive function of 17-AAG is IL-10 dependent. Representative histograms of CellTrace-labeled CD4+ T cells co-cultured with decreasing concentrations of CD4+CD25+ Tregs from IL-10−/− mice treated with(out) 17-AAG. Results representative of N=3 individual experiments with similar results.
Figure 9
Figure 9
HSP90 inhibition increases HSF1 translocation and transcriptional activation. (A) Representative blot of HSF1 either denatured or non-denatured from Tregs stimulated for 6 h with CD3 and CD28 with(out) 17-AAG (250nM). (B) Realtime RT-PCR analysis of expression of HSP90 isoforms (aa1, ab1), HSP70 isoforms (HSPA1A, HSPA1B) and IL-10 mRNA from isolated activated Tregs treated for 6 or 24h with 17-AAG (250nM). Mean ± SEM, n=3, *P<0.05, **P<0.01.

Similar articles

Cited by

References

    1. Singh B, et al. Control of intestinal inflammation by regulatory T cells. Immunol Rev. 2001;182:190–200. - PubMed
    1. Mottet C, Uhlig HH, Powrie F. Cutting edge: cure of colitis by CD4+CD25+ regulatory T cells. J Immunol. 2003;170:3939–3943. - PubMed
    1. Duchmann R, et al. Tolerance exists towards resident intestinal flora but is broken in active inflammatory bowel disease (IBD) Clin Exp Immunol. 1995;102:448–455. - PMC - PubMed
    1. de Zoeten EF, et al. Histone deacetylase 6 and heat shock protein 90 control the functions of foxp3+ T-regulatory cells. Mol Cell Biol. 2011;31:2066–2078. - PMC - PubMed
    1. De AK, Kodys KM, Yeh BS, Miller-Graziano C. Exaggerated human monocyte IL-10 concomitant to minimal TNF-alpha induction by heat-shock protein 27 (Hsp27) suggests Hsp27 is primarily an antiinflammatory stimulus. J Immunol. 2000;165:3951–3958. - PubMed

Publication types

MeSH terms