

Corpus callosum shape changes in early Alzheimer's disease: an MRI study using the OASIS brain database
- PMID: 23322167
- PMCID: PMC3657596
- DOI: 10.1007/s00429-013-0503-0
Corpus callosum shape changes in early Alzheimer's disease: an MRI study using the OASIS brain database
Abstract
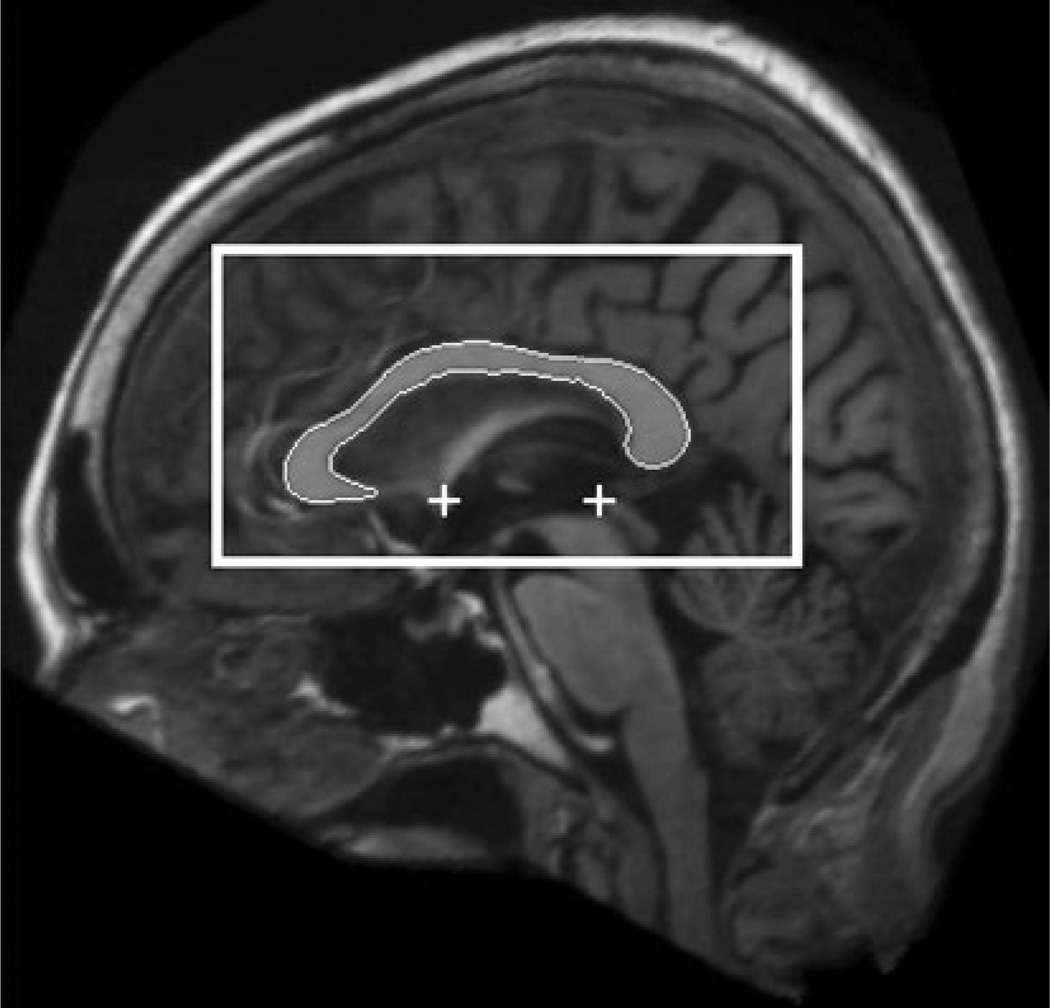
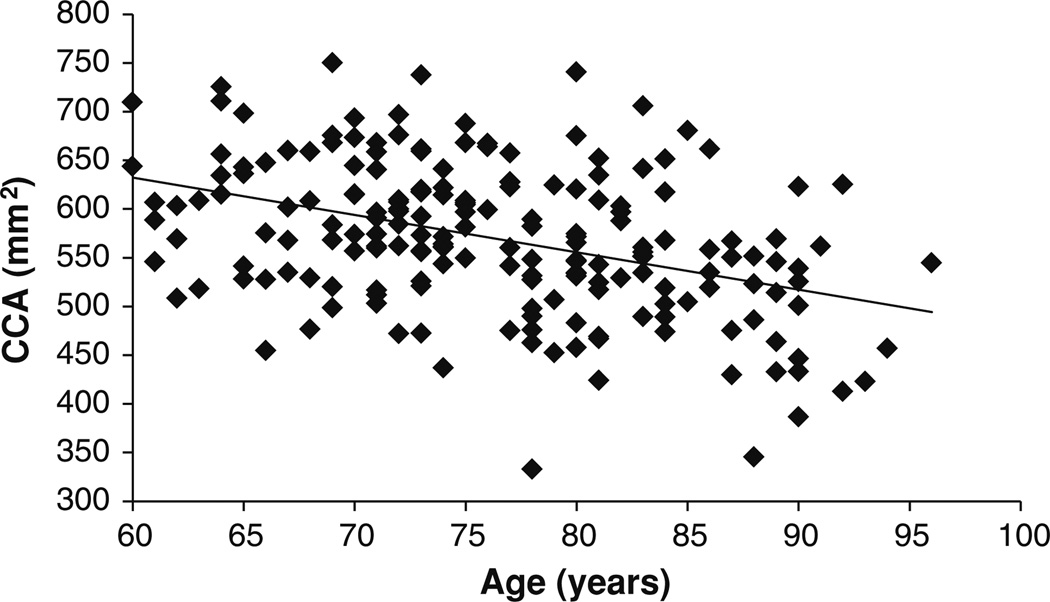
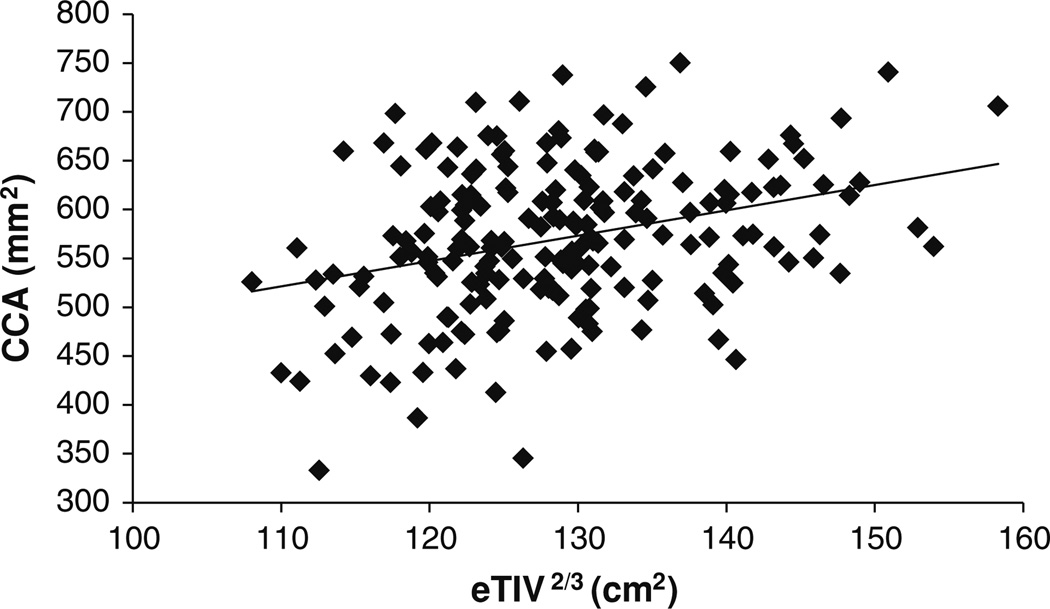
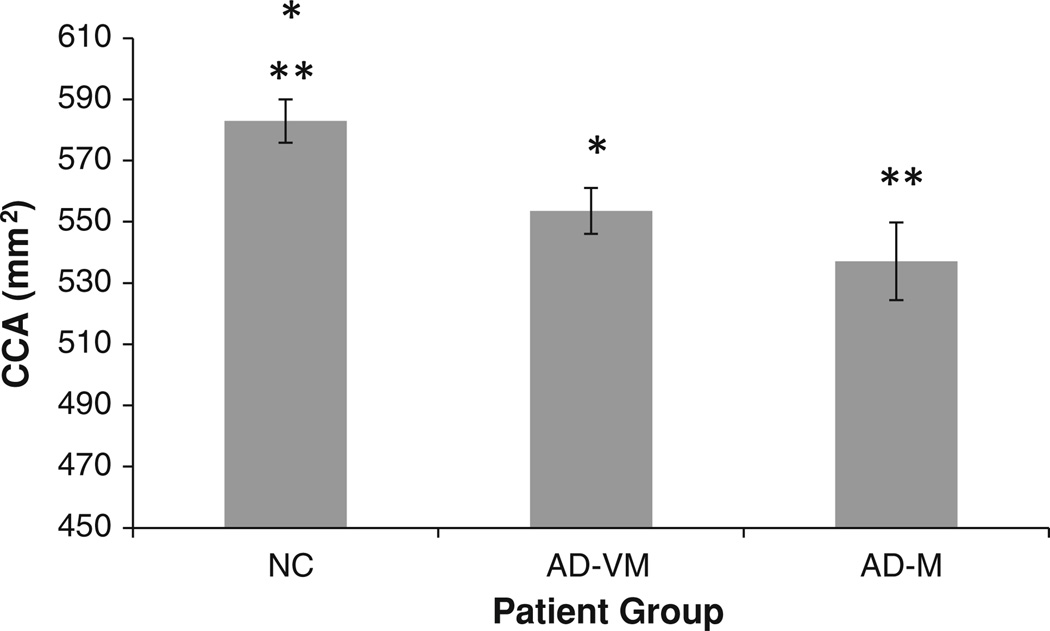
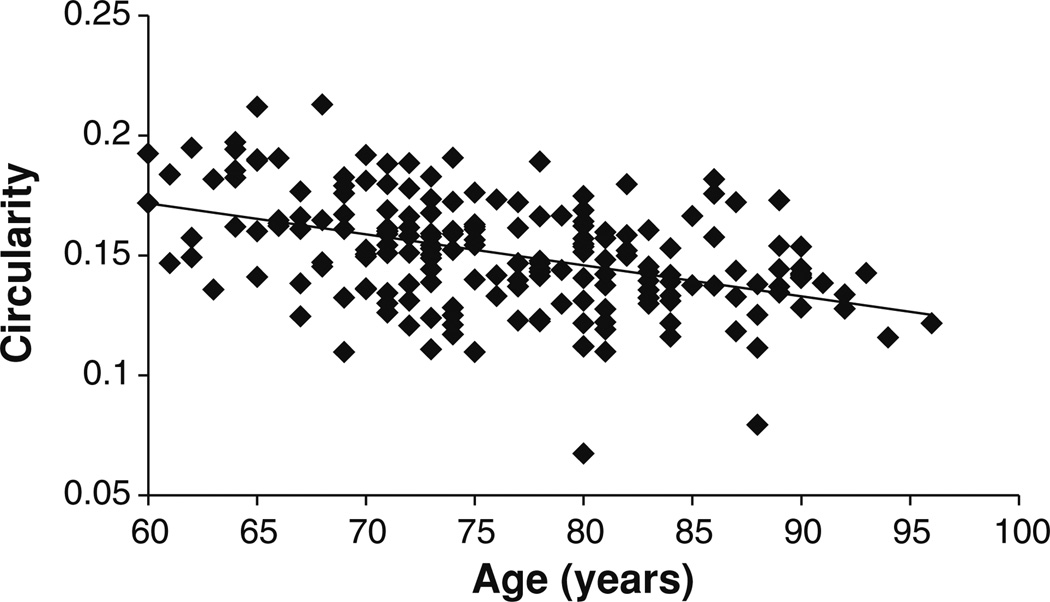
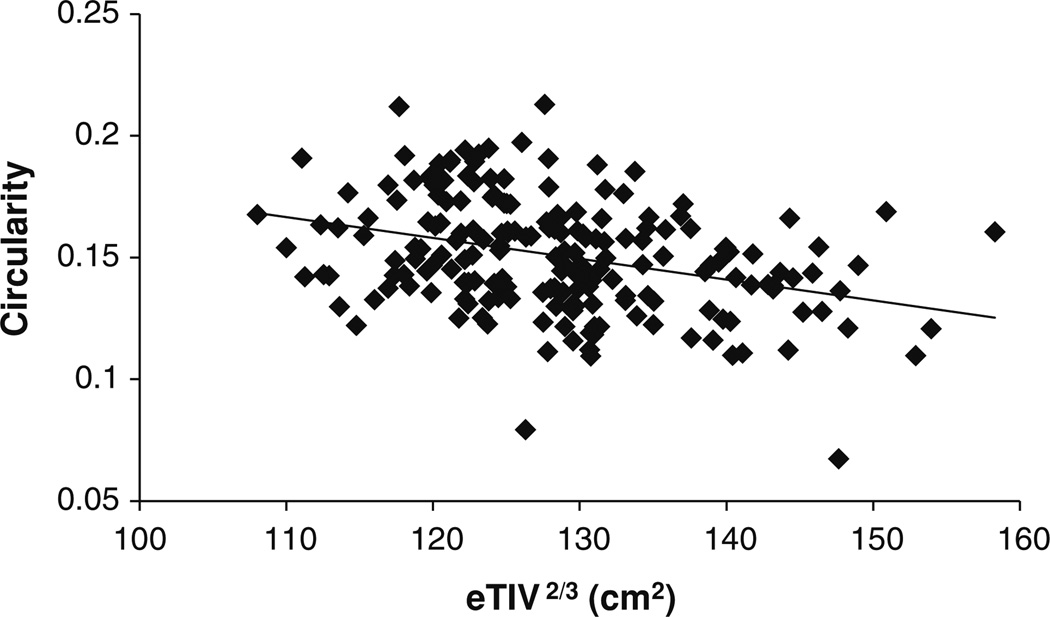
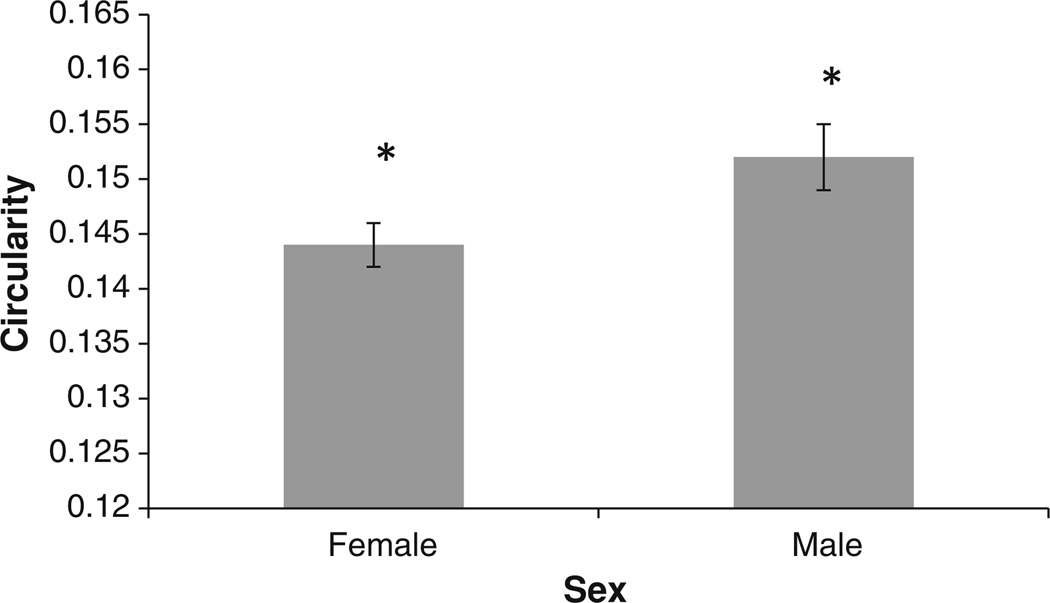
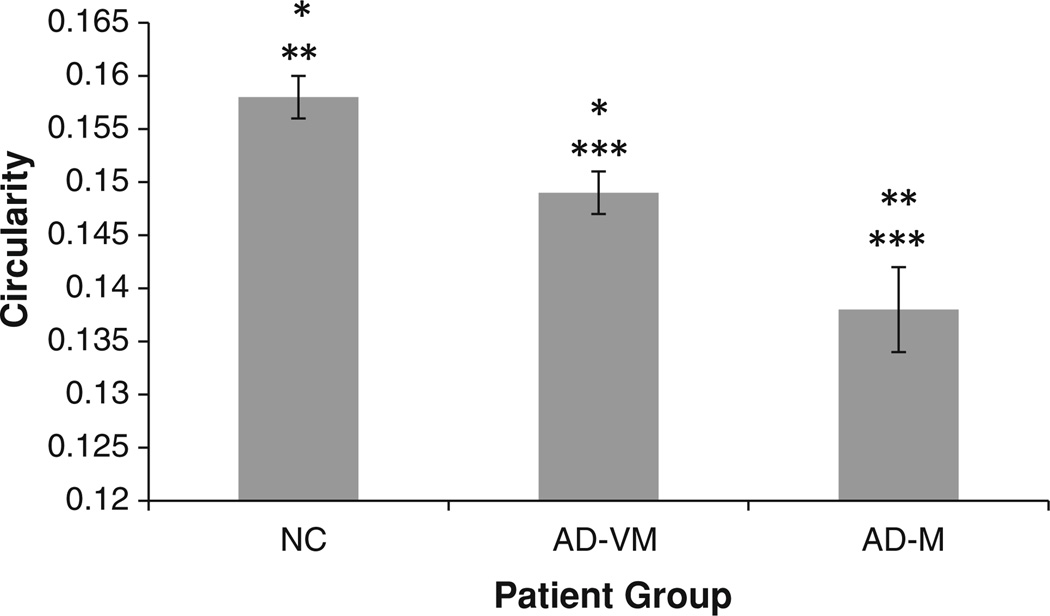
The corpus callosum (CC) is the largest fiber bundle connecting the left and right cerebral hemispheres. It has been a region examined extensively for indications of various pathologies, including Alzheimer's disease (AD). Almost all previous studies of the CC in AD have been concerned with its size, particularly its mid-sagittal cross-sectional area (CCA). In this study, we show that the CC shape, characterized by its circularity (CIR), may be affected more profoundly than its size in early AD. MRI scans (n = 196) were obtained from the publicly available Open Access Series of Imaging Studies database. The CC cross-sectional region on the mid-sagittal section of the brain was automatically segmented using a novel algorithm. The CCA and CIR were compared in 98 normal controls (NC) subjects, 70 patients with very mild AD (AD-VM), and 28 patients with mild AD (AD-M). Statistical analysis of covariance controlling for age and intracranial capacity showed that both the CIR and the CCA were significantly reduced in the AD-VM group relative to the NC group (CIR: p = 0.004; CCA: p = 0.005). However, only the CIR was significantly different between the AD-M and AD-VM groups (p = 0.006) being smaller in the former. The CCA was not significantly different between the AD-M and AD-VM groups. The results suggest that CC shape may be a more sensitive marker than its size for monitoring the progression of AD. In order to facilitate independent analyses, the CC segmentations and the CCA and CIR data used in this study have been made publicly available (http://www.nitrc.org/projects/art).
Figures
References
-
- Abe O, Masutani Y, Aoki S, Yamasue H, Yamada H, Kasai K, Mori H, Hayashi N, Masumoto T, Ohtomo K. Topography of the human corpus callosum using diffusion tensor tractography. J Comput Assist Tomogr. 2004;28:533–539. - PubMed
-
- Aljabar P, Heckemann RA, Hammers A, Hajnal JV, Rueckert D. Multi-atlas based segmentation of brain images: atlas selection and its effect on accuracy. Neuroimage. 2009;46:726–738. - PubMed
-
- Ardekani BA, Kershaw J, Braun M, Kanno I. Automatic detection of the mid-sagittal plane in 3-D brain images. IEEE Trans Med Imaging. 1997;16:947–952. - PubMed
-
- Ardekani BA, Guckemus S, Bachman A, Hoptman MJ, Wojtaszek M, Nierenberg J. Quantitative comparison of algorithms for inter-subject registration of 3D volumetric brain MRI scans. J Neurosci Methods. 2005;142:67–76. - PubMed
Publication types
MeSH terms
Grants and funding
LinkOut - more resources
Full Text Sources
Other Literature Sources
Medical
