. 2013 Jan 15;27(2):169-81.
doi: 10.1101/gad.204776.112. Epub 2013 Jan 15.

FGF7 is a functional niche signal required for stimulation of adult liver progenitor cells that support liver regeneration

Affiliations

FGF7 is a functional niche signal required for stimulation of adult liver progenitor cells that support liver regeneration

Hinako M Takase et al. Genes Dev. .

Abstract

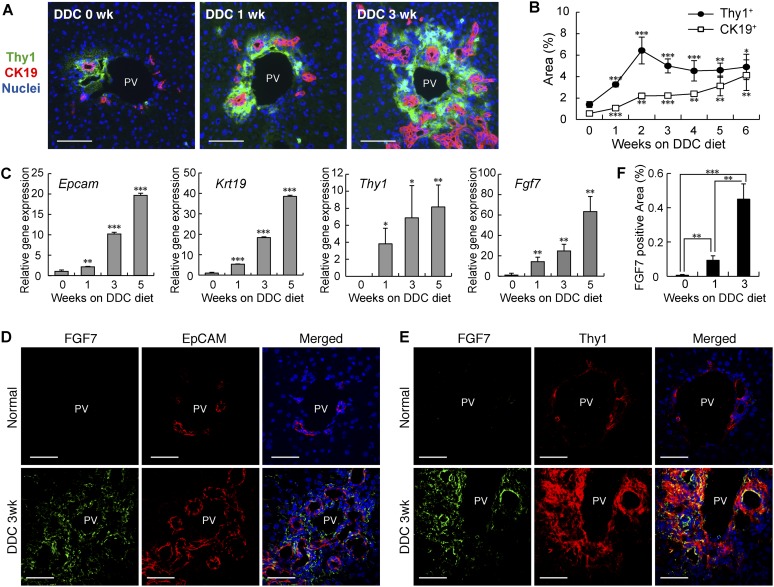
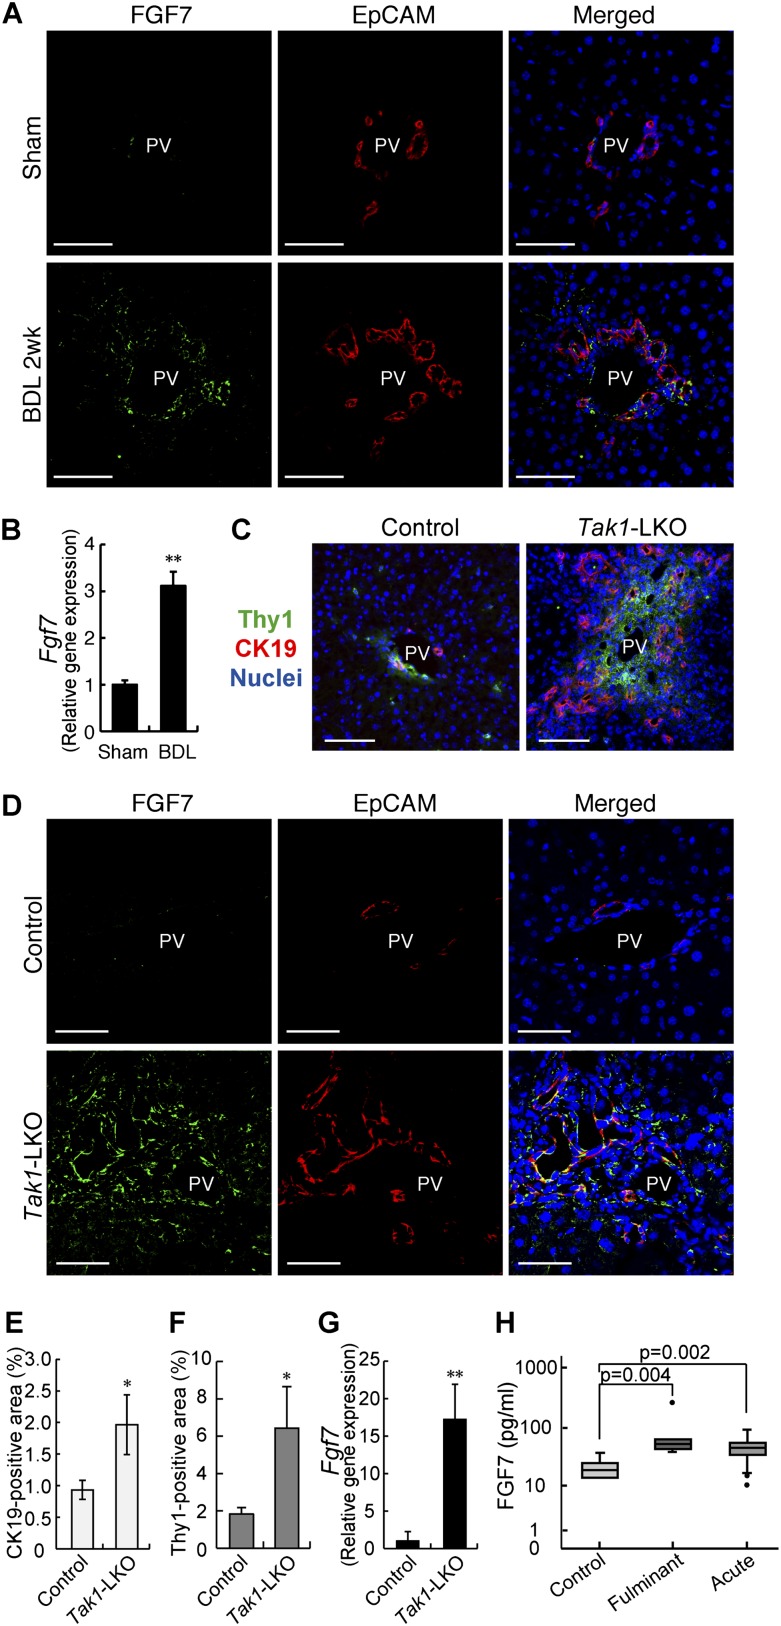
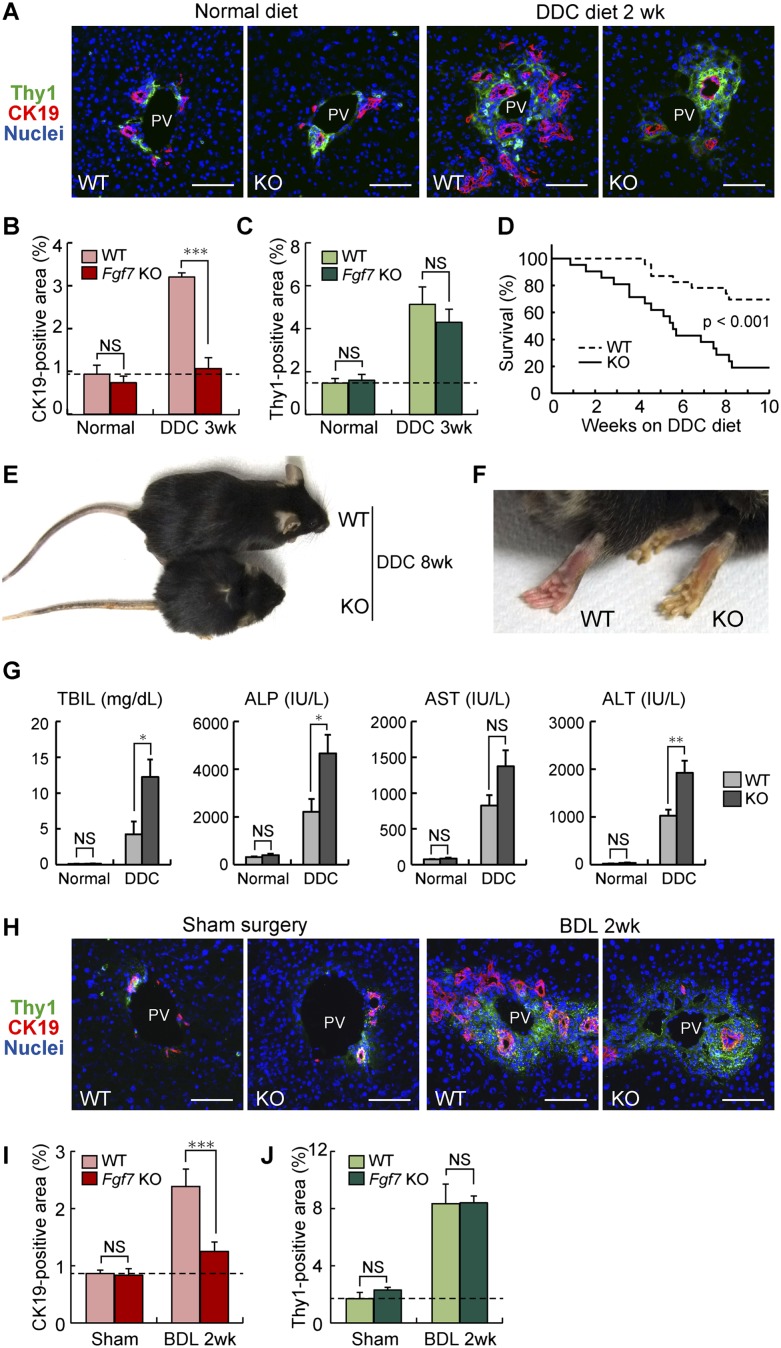
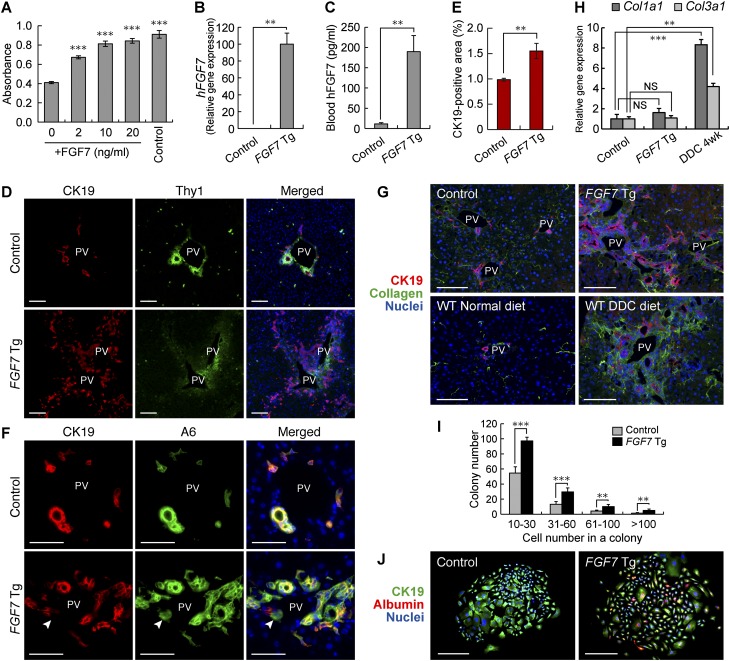
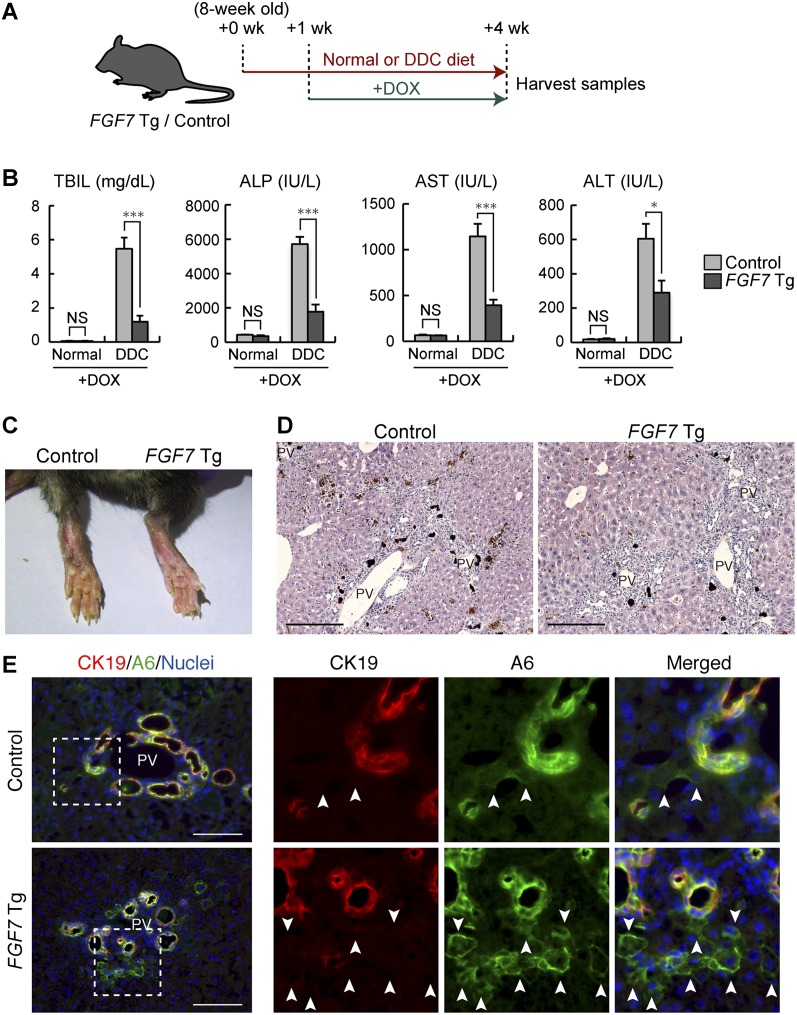
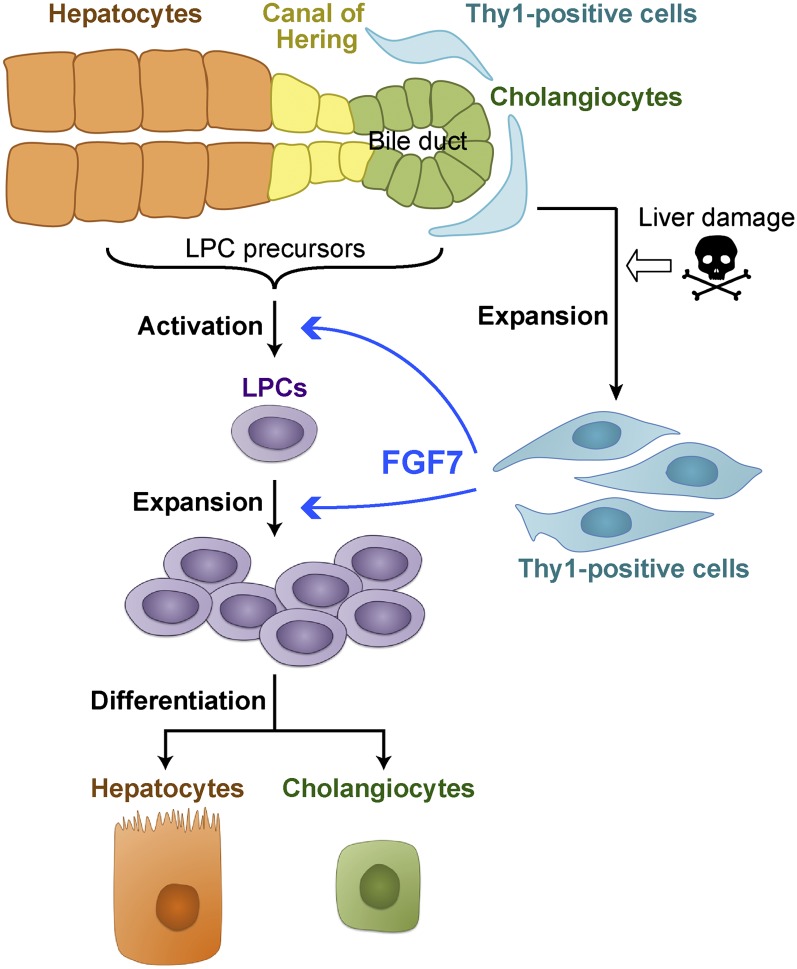
The liver is a unique organ with a remarkably high potential to regenerate upon injuries. In severely damaged livers where hepatocyte proliferation is impaired, facultative liver progenitor cells (LPCs) proliferate and are assumed to contribute to regeneration. An expansion of LPCs is often observed in patients with various types of liver diseases. However, the underlying mechanism of LPC activation still remains largely unknown. Here we show that a member of the fibroblast growth factor (FGF) family, FGF7, is a critical regulator of LPCs. Its expression was induced concomitantly with LPC response in the liver of mouse models as well as in the serum of patients with acute liver failure. Fgf7-deficient mice exhibited markedly depressed LPC expansion and higher mortality upon toxin-induced hepatic injury. Transgenic expression of FGF7 in vivo led to the induction of cells with characteristics of LPCs and ameliorated hepatic dysfunction. We revealed that Thy1(+) mesenchymal cells produced FGF7 and appeared in close proximity to LPCs, implicating a role for those cells as the functional LPC niche in the regenerating liver. These findings provide new insights into the cellular and molecular basis for LPC regulation and identify FGF7 as a potential therapeutic target for liver diseases.


Figures

Figure 1.
Figure 1.
FGF7 expression in the damaged liver is up-regulated around LPCs. (A) Liver sections prepared from DDC diet-fed mice were subjected to immunofluorescent double-staining analysis. Thy1+ cells (green) were observed in the immediate vicinity of CK19+ LPCs (red) during the course of LPC activation. Bars, 80 μm. (PV) Portal vein. (B) Thy1- and CK19-positive areas were increased in the DDC-treated livers, as determined by quantitative analysis of immunofluorescence-stained images. Mean ± SD (n = 3). (***) P < 0.001; (**) P < 0.01; (*) P < 0.05, compared with normal liver (0 wk). (C) Total RNA was isolated from whole-liver samples of normal diet-fed (0 wk) or DDC diet-fed mice, reverse-transcribed, and subjected to quantitative PCR analyses to determine expression of the LPC markers Epcam and Krt19, the mesenchymal cell marker Thy1, and Fgf7. Expression was normalized to that of Gapdh. Mean ± SD (n = 3). (***) P < 0.001; (**) P < 0.01; (*) P < 0.05, compared with the value at 0 wk. (D,E) Confocal immunofluorescence images of the livers show that FGF7 (green) protein localized in the proximity of EpCAM+ LPCs (D, red) and colocalized with Thy1+ mesenchymal cells (E, red) in the periportal region in injured livers. Bars, 50 μm. (PV) Portal vein. (F) Expression of FGF7 protein was increased in the DDC-treated livers, as determined by quantitative analysis of immunofluorescence-stained images of at least 11 periportal fields from three livers for each time point. Mean ± SE. (***) P < 0.001; (**) P < 0.01.
Figure 2.
Figure 2.
FGF7 signal emanates from Thy1+ cells and acts on LPCs. (A, left panel) Liver sections prepared from mice fed DDC diet for 3 wk were subjected to in situ hybridization analysis for Fgfr2 expression. (Right panel) The same section was subsequently overlaid with immunohistochemical staining using anti-CK19 antibody to confirm its expression in LPCs. Bars, 200 μm. (B,C) EpCAM+ and EpCAM cells were sorted from NPCs in the livers of the mice fed the DDC-containing diet for 5 wk. Cytospin preparations of these cells were stained for FGFR2b (green) and EpCAM (red). Representative images are shown in B, and the result of quantitation are shown in C (EpCAM, n = 980; EpCAM+, n = 1454). Mean ± SD. Bars, 40 μm. (***) P < 0.001. (D) Hepatocyte, NPC, EpCAM+ cell (LPC), Thy1+ CD45 mesenchymal cell (Thy1+MC), Thy1+ CD45+ T-cell (T-cell), and Thy1 CD45+ cell (blood cell, excluding T-cell) fractions were isolated from the livers of DDC-treated mice. Expression of the indicated genes was examined by quantitative RT–PCR. Mean ± SD (n = 3). (*) Significantly different from each of the other five fractions (ANOVA, with Tukey post hoc tests, P < 0.05).
Figure 3.
Figure 3.
FGF7-mediated LPC activation is conserved in several liver injuries. (A,B) Liver samples prepared from sham-operated (Sham) or BDL mice were subjected to the following experiments. (A) Confocal immunofluorescent double staining using anti-FGF7 (green) and anti-EpCAM (red) antibodies. Bars, 50 μm. (PV) Portal vein. (B) Quantitative RT–PCR analysis of Fgf7 mRNA. Mean ± SE (n = 3). (**) P < 0.01. (C–G) Liver samples from 8-wk-old liver-specific Tak1-LKO (Alfp-Cre; Tak1flox/flox) or control (Tak1flox/flox) mice were subjected to the following experiments. (C) Representative images for immunofluorescent double staining of CK19 (red) and Thy1 (green). (PV) Portal vein. Bars, 80 μm. (D) Confocal immunofluorescent double staining using anti-FGF7 (green) and anti-EpCAM (red) antibodies. Bars, 50 μm. (PV) Portal vein. (E) Quantitative image analysis of CK19-positive area. Mean ± SD (n = 3). (*) P < 0.05. (F) Quantitative image analysis of Thy1-positive area. Mean ± SD (n = 3). (*) P < 0.05. (G) Quantitative RT–PCR analysis of Fgf7 mRNA. Mean ± SD (n = 3). (**) P < 0.01. (H) Serum FGF7 levels in human samples. enzyme-linked immunosorbent assay (ELISA) for human FGF7 was performed on serum samples harvested from healthy controls (n = 6) and patients with fulminant (n = 6) or acute (n = 43) hepatitis. The data are presented as median (25–75 percentile).
Figure 4.
Figure 4.
FGF7 is essential for LPC activation and liver regeneration in injured livers. Adult littermates of Fgf7 knockout (KO) and wild-type (WT) mice were fed normal or DDC diet (A–G) or subjected to BDL or a sham operation (H–J). (A,H) Representative images for immunofluorescent double staining of CK19 (red) and Thy1 (green). Bars, 80 μm. (PV) Portal vein. (B,I) Quantitative image analysis of CK19-positive area. Mean ± SD (n = 3). (***) P < 0.001; (NS) not significant. (C,J) Quantitative image analysis of Thy1-positive area. Mean ± SD (n = 3). (NS) Not significant. (D) Kaplan-Meier survival curves of control (wild-type, n = 23) and Fgf7 knockout (n = 21) mice given DDC, showing that the lack of FGF7 leads to the increased mortality after DDC feeding. Statistical analysis was performed using the log-rank (Mantel-Cox) test. (E,F) Appearance of Fgf7 knockout and wild-type mice fed DDC diet for 8 wk. (F) More severe symptoms for jaundice, such as yellow-colored skin, were typically observed in the knockout animal. (G) Serum TBIL, ALP, AST, and ALT levels were measured in control and Fgf7 knockout mice fed a normal (wild type, n = 3; knockout, n = 3) or DDC-containing (wild type, n = 6; knockout, n = 3) diet for 10 wk. Mean ± SE. (**) P < 0.01; (*) P < 0.05; (NS) not significant.
Figure 5.
Figure 5.
Overexpression of FGF7 can induce the LPC response in the adult mouse liver. (A) The level of proliferation of HSCE1 cells was examined by WST-1 assay. Stimulation with epidermal growth factor (EGF) and hepatocyte growth factor (HGF) was used as a control. Mean ± SD (n = 3). (***) P < 0.001 compared with no cytokine treatment (0). (B) Quantitative RT–PCR analysis was performed to assess human FGF7 mRNA levels in the liver after 3 wk of Dox administration. Mean ± SE (control, n = 3; Tg, n = 5). (**) P < 0.01. (C) Serum levels of human FGF7 protein after 3 wk of Dox administration were determined by ELISA. Mean ± SE (control, n = 4; Tg, n = 6). (**) P < 0.01. (D) Immunostaining of CK19 (red) and Thy1 (green) in the livers of FGF7 Tg mice and control mice treated with Dox for 4 wk. Bars, 100 μm. (PV) Portal vein. (E) Quantitative analysis of CK19-positive areas showed an increased number of LPC-like cells in FGF7 Tg mice treated with Dox for 4 wk. Mean ± SD (n = 3). (**) P < 0.01. (F) Immunostaining of CK19 (red) and A6 (green) showed expansion of CK19+ A6+ LPCs in the livers of FGF7 Tg mice treated with Dox for 4 wk. CK19 A6+ newly formed hepatocytes were also observed (arrowheads). Bars, 50 μm. (PV) Portal vein. (G) Immunostaining of CK19 (red) and collagen (green) in the livers of FGF7 Tg and control mice, wild-type mice fed a normal diet, and DDC-treated wild-type mice. Bars, 100 μm. (PV) Portal vein. (H) Quantitative RT–PCR analysis of Col1a1 and Col3a1 mRNA. Mean ± SE (control, n = 3; Tg, n = 5; DDC, n = 3). (**) P < 0.01; (***) P < 0.001; (NS) not significant. (I) EpCAM+ cells were isolated from the livers of FGF7 Tg mice and control mice 3 wk after Dox treatment and subjected to the in vitro colony formation assay. Mean ± SD (n = 3). (**) P < 0.01; (***) P < 0.001. (J) Immunofluorescence images of representative large colonies stained with anti-CK19 (green) and albumin (red). Bars, 200 μm.
Figure 6.
Figure 6.
Application of FGF7 improves both the hepatocyte damage and cholestatic liver injury. (A) Schematic representation of the experiment. Eight-week-old FGF7 Tg and control mice were subjected to the DDC-induced liver injury model or left untreated, and 1 wk later, Dox administration was started for FGF7 induction. After 3 wk of treatment, serum and liver samples were harvested for subsequent analyses. (B) Serum TBIL, ALP, AST, and ALT levels were measured in control and FGF7 Tg mice fed a normal (control, n = 3; Tg, n = 3) or DDC-containing (control, n = 9; Tg, n = 7) diet. Mean ± SE. (***) P < 0.001; (*) P < 0.05; (NS) not significant. (C) Typical skin color (right foot) of the DDC-treated animals at the end of the protocol, indicating that FGF7 Tg mice suffered less from jaundice than control mice. (D) Hematoxylin and eosin staining of livers from DDC-treated animals at the end of the protocol. Bars, 200 μm. (PV) Portal vein. (E) Immunostaining of CK19 (red) and A6 (green) in the livers of FGF7 Tg mice and control mice at the end of the protocol. Note that A6+ CK19 newly formed hepatocytes were increased in the livers of FGF7 Tg mice. Bars, 100 μm. (PV) Portal vein.
Figure 7.
Figure 7.
A model for regulatory mechanism of the LPC response by FGF7. In injured livers, Thy1+ mesenchymal cells expand in the periportal area and produce FGF7. FGF7 contributes to liver regeneration by initiating the activation and proliferation of LPCs as the functional niche signal.

Similar articles

Cited by

References

    1. Akhurst B, Croager EJ, Farley-Roche CA, Ong JK, Dumble ML, Knight B, Yeoh GC 2001. A modified choline-deficient, ethionine-supplemented diet protocol effectively induces oval cells in mouse liver. Hepatology 34: 519–522 - PubMed
    1. Alison MR, Golding MH, Sarraf CE 1996. Pluripotential liver stem cells: Facultative stem cells located in the biliary tree. Cell Prolif 29: 373–402 - PubMed
    1. Alpdogan O, Hubbard VM, Smith OM, Patel N, Lu S, Goldberg GL, Gray DH, Feinman J, Kochman AA, Eng JM, et al. 2006. Keratinocyte growth factor (KGF) is required for postnatal thymic regeneration. Blood 107: 2453–2460 - PMC - PubMed
    1. Beaven AW, Shea TC 2007. The effect of palifermin on chemotherapyand radiation therapy-induced mucositis: A review of the current literature. Support Cancer Ther 4: 188–197 - PubMed
    1. Beer HD, Bittner M, Niklaus G, Munding C, Max N, Goppelt A, Werner S 2005. The fibroblast growth factor binding protein is a novel interaction partner of FGF-7, FGF-10 and FGF-22 and regulates FGF activity: Implications for epithelial repair. Oncogene 24: 5269–5277 - PubMed

Publication types