. 2013 Jan 15;27(2):182-96.
doi: 10.1101/gad.206227.112. Epub 2013 Jan 15.

Loss of RBF1 changes glutamine catabolism

Affiliations

Loss of RBF1 changes glutamine catabolism

Brandon N Nicolay et al. Genes Dev. .

Abstract

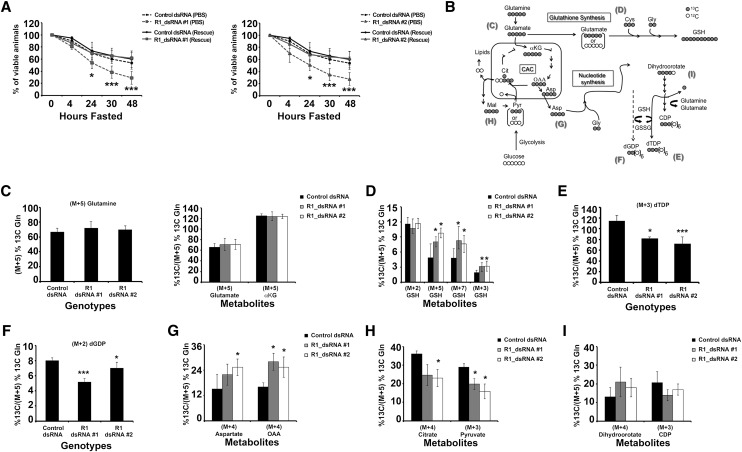
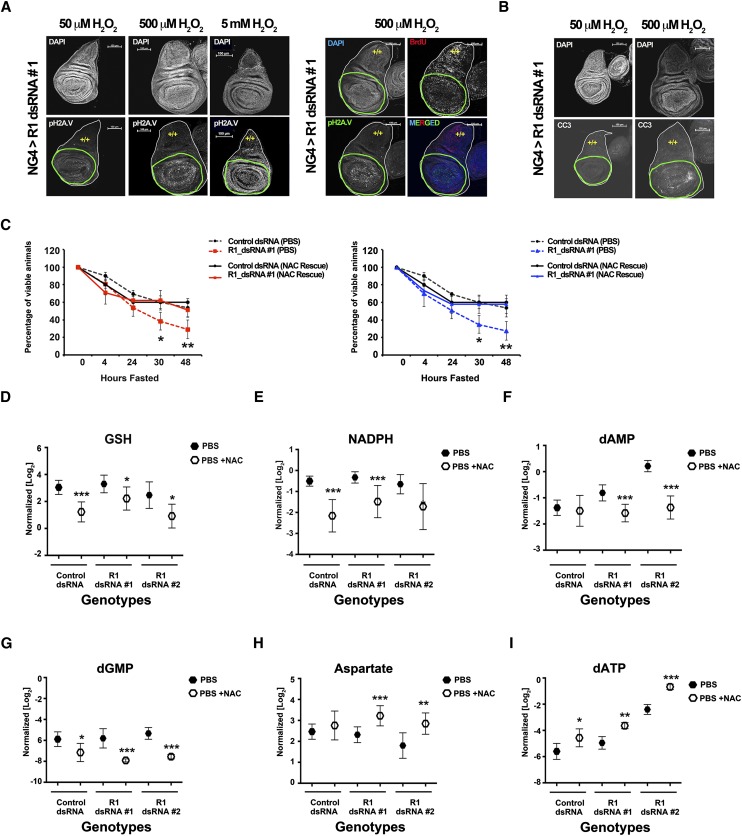
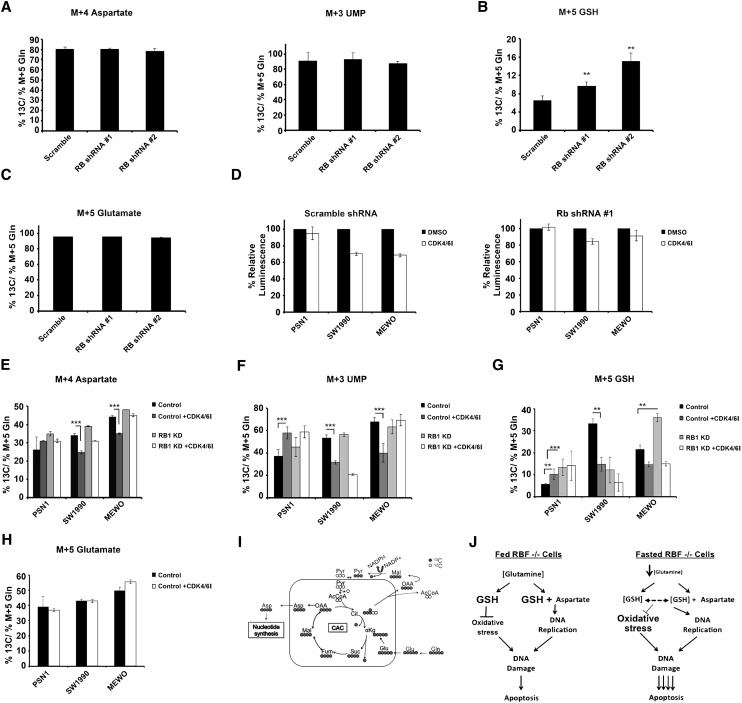
Inactivation of the retinoblastoma tumor suppressor (pRB) alters the expression of a myriad of genes. To understand the altered cellular environment that these changes create, we took advantage of the Drosophila model system and used targeted liquid chromatography tandem mass spectrometry (LC-MS/MS) to profile the metabolic changes that occur when RBF1, the fly ortholog of pRB, is removed. We show that RBF1-depleted tissues and larvae are sensitive to fasting. Depletion of RBF1 causes major changes in nucleotide synthesis and glutathione metabolism. Under fasting conditions, these changes interconnect, and the increased replication demand of RBF1-depleted larvae is associated with the depletion of glutathione pools. In vivo (13)C isotopic tracer analysis shows that RBF1-depleted larvae increase the flux of glutamine toward glutathione synthesis, presumably to minimize oxidative stress. Concordantly, H(2)O(2) preferentially promoted apoptosis in RBF1-depleted tissues, and the sensitivity of RBF1-depleted animals to fasting was specifically suppressed by either a glutamine supplement or the antioxidant N-acetyl-cysteine. Effects of pRB activation/inactivation on glutamine catabolism were also detected in human cell lines. These results show that the inactivation of RB proteins causes metabolic reprogramming and that these consequences of RBF/RB function are present in both flies and human cell lines.


Figures

Figure 1.
Figure 1.
Loss of the RBF1 protein leads to hypersensitivity to DNA damage and energetic stress. (A–C) Images shown are third instar wing discs. Bar, 100 μm. Genotypes are described in the Materials and Methods. The domain where the RBF1 protein has been depleted (green outline) or remains (yellow +/+) is designated. (A) Wing discs were treated with 50 μM Cpt or 50 μM DMSO as a control. DNA damage foci shown by pH2AV (grayscale). Apoptosis following Cpt challenge shown by CC3 (grayscale). (B) The nubbin-Gal4 expression domain is identified by the expression of a UAS-gfp (NG4 > GFP) (green). The RBF1 protein is efficiently depleted by “RBFdsRNA #1” (red), while ControldsRNA has no affect. Gross tissue architecture and like focal planes are indicated by DAPI (blue). (C) Fasting leads to apoptosis specifically in RBF1-depleted tissue, as indicated by CC3 (grayscale). (D) Error bars represent the standard deviation from the mean. mRNA levels were measured by quantitative real-time PCR (qPCR). RBF1 mRNA is efficiently depleted by both targeted dsRNAs. Depletion of RBF1 leads to increased levels of the traditional RBF1/dE2F target gene pcna. (E,F) Error bars represent the confidence interval (C.I.) of 95%. Mid-second instar larvae were fasted over 48 h. Reduced RBF1 protein leads to a statistically significant hypersensitivity to fasting when compared with appropriate control animals (at time points between 4 and 48 h the P-value < 0.01).
Figure 2.
Figure 2.
RBF1 depletion leads to global metabolic changes and increased cellular oxidation. (A) KEGG pathway enrichment was performed on genes bound by RBF1 in wild-type third instar larvae (Korenjak et al. 2012), genes up-regulated in RBF1−/− third instar larvae (Longworth et al. 2012), and altered metabolites as a response to RBF1 depletion under fasting. The top seven pathways enriched from each analysis are shown. (B) Schematic of the flow of glutamine catabolism toward glutathione synthesis. (C–E) Normalized levels (see the Supplemental Material for details) of metabolite pools from fed and fasted control or RBF1-depleted third instar larvae. Error bars represent the C.I. of 95%. Statistical significance is designated as P-values as follows: (*) P < 0.06; (**) P < 0.02; (***) P < 0.001. Statistical differences are between dffects from RBF1 depletion compared with control animals within the two metabolic states unless designated otherwise.
Figure 3.
Figure 3.
RBF1 depletion allows sustained levels of dNTPs during fasting. (A) Schematic of de novo dNTP synthesis. (B–D,F) Normalized levels of ribonucleotide and dexoynucleotide pools from fed and fasted control or RBF1-depleted third instar larvae. Error bars represent the C.I. of 95%. Statistical significance is designated as P-values as follows: (*) P < 0.06; (***) P < 0.001. Statistical differences are between effects from RBF1 depletion compared with control animals within the two metabolic states unless designated otherwise. (E) Ratios of dNTP pools between fed and fasted conditions.
Figure 4.
Figure 4.
RBF1-depleted animals increase levels of nucleotide salvage pathway metabolites to maintain dNTP pools. Metabolite pools from fed and fasted animals from fed and fasted control or RBF1-depleted third instar larvae. Error bars represent the C.I. of 95%. Statistical significance is designated as P-values as follows: (*) P < 0.06; (**) P < 0.02; (***) P < 0.001. Statistical differences are between effects from RBF1 depletion compared with control animals within the two metabolic states unless designated otherwise. (A) Schematic of glutamine catabolism to dNTPs. (αKG) α-ketoglutarate. (B) Normalized aspartate pools. (C) Simplified schematic of the nucleotide salvage pathway from DNA hydrolysis. (dN) Deoxynucleotides; (dNK) deoxynucleotide kinase; (dNMP) deoxynucleotide monophosphate; (dNDP) deoxynucleotide diphosphate; (dNTP) deoxynucleotide triphosphate. (D) Normalized deoxyadenosine (dA) pools. (E–G) Normalized deoxynucleotide monophosphate pools. (H) Schematic of how the RNR enzyme complex generates deoxynucleotides from ribonucleotides. (I) Normalized OAA pools.
Figure 5.
Figure 5.
RBF1-depleted animals' sensitivity to fasting is rescued by glutamine supplementation. Genotypes of animals used are described in the Materials and Methods. Error bars represent the C.I. of 95%. Statistical significance is designated as P-values as follows: (*) P < 0.06; (***) P < 0.001. Statistical differences are between effects from RBF1 depletion compared with control animals. (A) Mid-second instar larvae were fasted or fed only 25 mM L-glutamine over the course of 48 h. (B) Schematic of [U-13C]-glutamine (gray circles) metabolism depicts the expected amount of 13C labeling after glutamine is metabolized through the citric acid cycle (CAC). Molecular symmetry and cellular compartments are not depicted. Unlabeled carbon (12C) is shown by open circles. Molecular symmetry and cellular compartments are not depicted. (αKG) α-Ketoglutarate; (Cit) citrate; (Asp) aspartate; (Mal) malate; (Pyr) pyruvate; (Gly) glycine; (Cys) cysteine; (CDP) cytodine diphosphate; (dTDP) thymidine diphosphate; (dGDP) deoxyguanosine diphosphate. (C–I) Enrichment of the [U-13C5]-glutamine tracer in metabolites associated with glutathione synthesis, the CAC, and nucleotide synthesis. All percentages are relative to the total amount of [U-13C5]-glutamine tracer in each sample.
Figure 6.
Figure 6.
RBF1-depleted animals' sensitivity to fasting is rescued by NAC supplementation. Genotypes of animals used are described in the Materials and Methods. (A,B) RBF1-depleted cells (green outline) show increased sensitivity to H2O2 when compared with wild-type tissue (yellow +/+). RBF1-depleted cells have increased DNA damage, shown by pH2AV (grayscale and green), but continue to proliferate, shown by BrdU (red). This increased damage leads to increased apoptosis, shown by CC3 (grayscale). Error bars represent the C.I. of 95%. Statistical significance is designated as P-values as follows: (*) P < 0.06; (**) P < 0.02; (***) P < 0.001. Statistical differences are between effects from RBF1 depletion compared with control animals. (C) Mid-second instar larvae were fasted or fed only 0.6 mM NAC over the course of 48 h. (D–I) Normalized metabolite pools from larvae fasted (closed hexagons) or fed 0.6 mM NAC (open hexagons) for 24 h.
Figure 7.
Figure 7.
Alterations to glutamine catabolism following RBF1 depletion are partially conserved in human tumor cells. (A–C) RPE cells were fed the [U-13C5]-glutamine tracer in the presence or absence of a pRB shRNA. Error bars represent the C.I. of 95%. (D) The CellTiter-Glo assay (Promega) was used to measure cell number in human tumor cell lines over a 72-h period treated with or without the CDK4/6 inhibitor PD0332991 in the presence or absence of a pRB shRNA. The assays for each cell line were all done in parallel on the same plate but for visual representation are shown separated. Error bars represent the standard deviation from the mean. (A–C,E–H) Enrichment of the [U-13C5]-glutamine tracer in metabolites associated with glutathione synthesis, the CAC, and nucleotide synthesis. All percentages are relative to the total amount of [U-13C5]-glutamine tracer in each sample. In all panels except A–C, cells fed the [U-13C5]-glutamine tracer (see the Materials and Methods for details) were treated with or without the CDK4/6 inhibitor PD0332991 in the presence or absence of a pRB shRNA. Error bars represent the C.I. of 95%. Statistical significance is designated as P-values as follows: (**) P < 0.02; (***) P < 0.001. (I) Schematic of [U-13C]-glutamine (gray circles) metabolism depicts the expected amount of 13C labeling after glutamine is metabolized through the CAC. Molecular symmetry and cellular compartments are not depicted. Unlabeled carbon (12C) is shown by open circles. (αKG) α-Ketoglutarate; (Cit) citrate; (Asp) aspartate; (Mal) malate; (Pyr) pyruvate; (Suc) succinate; (Fum) fumarate; (Glu) glutamate; (Gln) glutamine; (AcCoA) acetyl-CoA. (J) Model of RBF1-depleted animals' hypersensitivity to energetic stress.

Similar articles

Cited by

References

    1. Arteaga CL, Baselga J 2012. Impact of genomics on personalized cancer medicine. Clin Cancer Res 18: 612–618 - PubMed
    1. Bester AC, Roniger M, Oren YS, Im MM, Sarni D, Chaoat M, Bensimon A, Zamir G, Shewach DS, Kerem B 2011. Nucleotide deficiency promotes genomic instability in early stages of cancer development. Cell 145: 435–446 - PMC - PubMed
    1. Black EP, Huang E, Dressman H, Rempel R, Laakso N, Asa SL, Ishida S, West M, Nevins JR 2003. Distinct gene expression phenotypes of cells lacking Rb and Rb family members. Cancer Res 63: 3716–3723 - PubMed
    1. Blais A, Dynlacht BD 2004. Hitting their targets: An emerging picture of E2F and cell cycle control. Curr Opin Genet Dev 14: 527–532 - PubMed
    1. Dimova DK, Stevaux O, Frolov MV, Dyson NJ 2003. Cell cycle-dependent and cell cycle-independent control of transcription by the Drosophila E2F/RB pathway. Genes Dev 17: 2308–2320 - PMC - PubMed

Publication types

MeSH terms

LinkOut - more resources