. 2013 Jun;20(3):203-12.
doi: 10.1007/s10140-012-1102-8. Epub 2013 Jan 16.

Accuracy of CT cerebral perfusion in predicting infarct in the emergency department: lesion characterization on CT perfusion based on commercially available software

Affiliations

Accuracy of CT cerebral perfusion in predicting infarct in the emergency department: lesion characterization on CT perfusion based on commercially available software

Chang Y Ho et al. Emerg Radiol. 2013 Jun.

Abstract

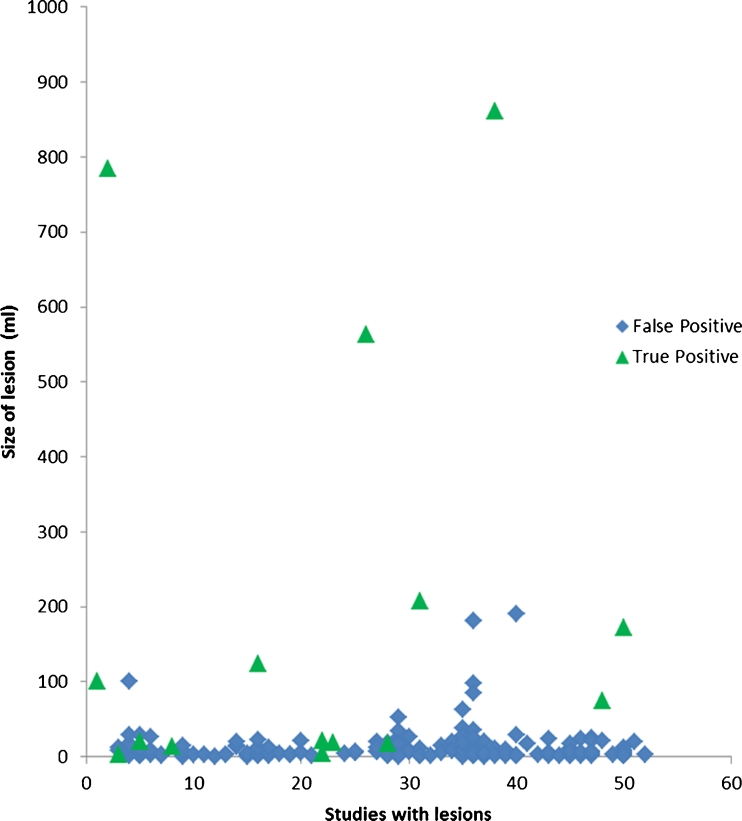
This study aims to assess the diagnostic accuracy of a single vendor commercially available CT perfusion (CTP) software in predicting stroke. A retrospective analysis on patients presenting with stroke-like symptoms within 6 h with CTP and diffusion-weighted imaging (DWI) was performed. Lesion maps, which overlays areas of computer-detected abnormally elevated mean transit time (MTT) and decreased cerebral blood volume (CBV), were assessed from a commercially available software package and compared to qualitative interpretation of color maps. Using DWI as the gold standard, parameters of diagnostic accuracy were calculated. Point biserial correlation was performed to assess for relationship of lesion size to a true positive result. Sixty-five patients (41 females and 24 males, age range 22-92 years, mean 57) were included in the study. Twenty-two (34 %) had infarcts on DWI. Sensitivity (83 vs. 70 %), specificity (21 vs. 69 %), negative predictive value (77 vs. 84 %), and positive predictive value (29 vs. 50 %) for lesion maps were contrasted to qualitative interpretation of perfusion color maps, respectively. By using the lesion maps to exclude lesions detected qualitatively on color maps, specificity improved (80 %). Point biserial correlation for computer-generated lesions (R pb = 0.46, p < 0.0001) and lesions detected qualitatively (R pb = 0.32, p = 0.0016) demonstrated positive correlation between size and infarction. Seventy-three percent (p = 0.018) of lesions which demonstrated an increasing size from CBV, cerebral blood flow, to MTT/time to peak were true positive. Used in isolation, computer-generated lesion maps in CTP provide limited diagnostic utility in predicting infarct, due to their inherently low specificity. However, when used in conjunction with qualitative perfusion color map assessment, the lesion maps can help improve specificity.


Figures

Fig. 1
Fig. 1
Examples of excluded lesions. a Lesions within areas of beam hardening (small arrows). b Lesions not projecting over the brain parenchyma. Vascular structures (small arrows) and choroid plexus (large arrow)
Fig. 2
Fig. 2
Lesion classification. a Ischemic lesions (green, large arrow) representing areas of elevated MTT and normal CBV. Infarct lesions (red, small arrow) representing areas of elevated MTT and reduced CBV. b Mixed lesions contained both areas of ischemia and infarct, the so-called “infarct core and ischemic penumbra” (large arrow)
Fig. 3
Fig. 3
Four contiguous axial images demonstrating a large region of infarct core with ischemic penumbra. The areas of these contiguous lesions are summated into one larger lesion
Fig. 4
Fig. 4
Sixty-five-year-old male presenting with slurred speech and facial droop. a Perfusion maps demonstrating a perfusion deficit (open arrows) with increasing areas from CBV to CBF to MTT/TTP. The corresponding computer-generated lesion map shows a mixed lesion (closed arrow). b MRI DWI and ADC map performed 4 h later demonstrate an area of decreased diffusion indicating acute infarct matching the area of decreased CBV on CT perfusion
Fig. 5
Fig. 5
Scatter plot for all lesions meeting inclusion criteria on computer-generated lesion maps
Fig. 6
Fig. 6
Scatter plot for all lesions from qualitative interpretation of color maps

References

    1. de Lucas EM, Sanchez E, Gutierrez A, et al. CT protocol for acute stroke: tips and tricks for general radiologists. Radiographics. 2008;28(6):1673–1687. doi: 10.1148/rg.286085502. - DOI - PubMed
    1. Wintermark M, Reichhart M, Thiran JP, et al. Prognostic accuracy of cerebral blood flow measurement by perfusion computed tomography, at the time of emergency room admission, in acute stroke patients. Ann Neurol. 2002;54(4):417–432. doi: 10.1002/ana.10136. - DOI - PubMed
    1. Srinivasan A, Goyal M, Al Azri F, Lum C. State-of-the-art imaging of acute stroke. Radiographics. 2006;26(Suppl 1):S75–S95. doi: 10.1148/rg.26si065501. - DOI - PubMed
    1. Rai AT, Carpenter JS, Peykanu JA, et al. The role of CT perfusion imaging in acute stroke diagnosis: a large single-center experience. J Emerg Med. 2008;35(3):287–292. doi: 10.1016/j.jemermed.2007.08.071. - DOI - PubMed
    1. Ezzeddine MA, Lev MH, McDonald CT, et al. CT angiography with whole brain perfused blood volume imaging: added clinical value in the assessment of acute stroke. Stroke. 2002;33(4):959–966. doi: 10.1161/hs0402.105388. - DOI - PubMed