. 2013 Apr;43(4):967-78.
doi: 10.1002/eji.201242772. Epub 2013 Feb 14.

Retinoic acid promotes the development of Arg1-expressing dendritic cells for the regulation of T-cell differentiation

Affiliations

Retinoic acid promotes the development of Arg1-expressing dendritic cells for the regulation of T-cell differentiation

Jinsam Chang et al. Eur J Immunol. 2013 Apr.

Abstract

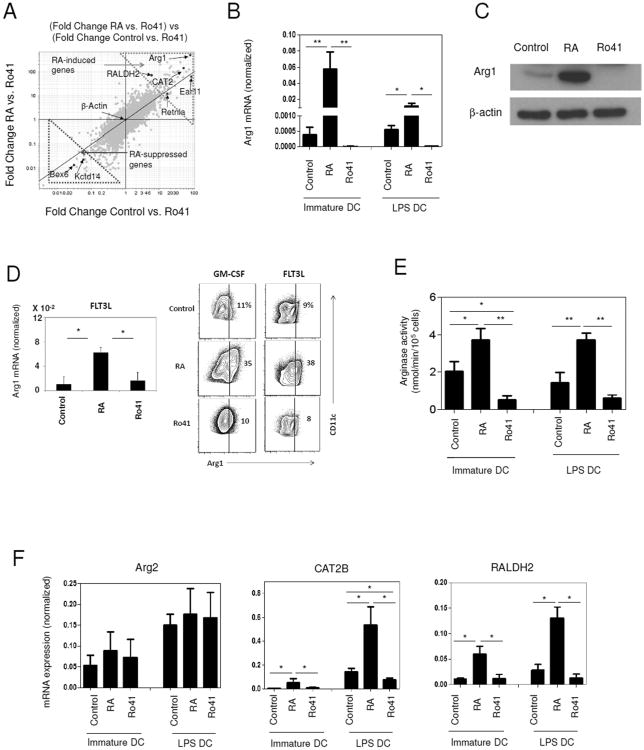
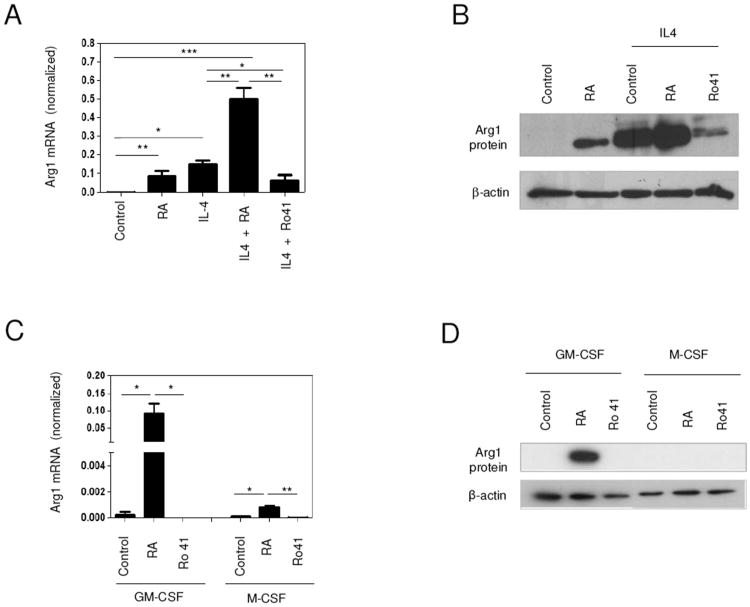
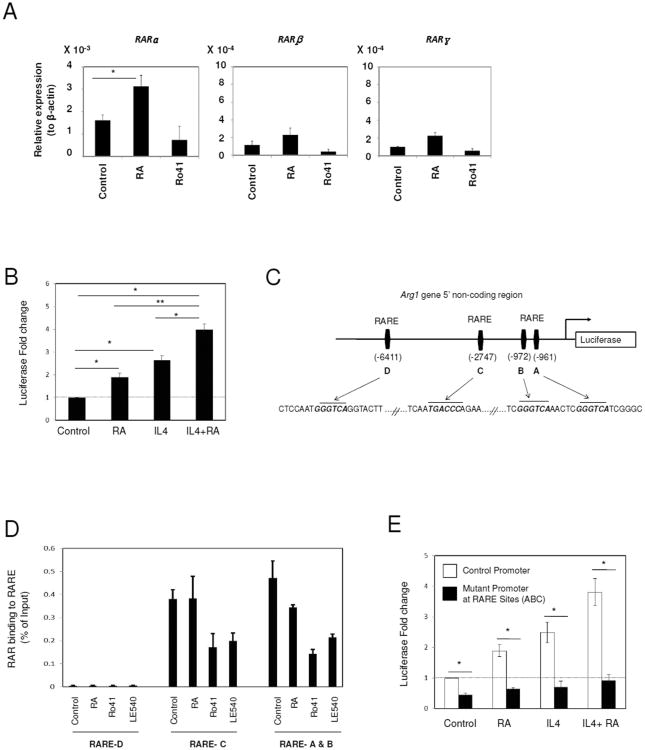
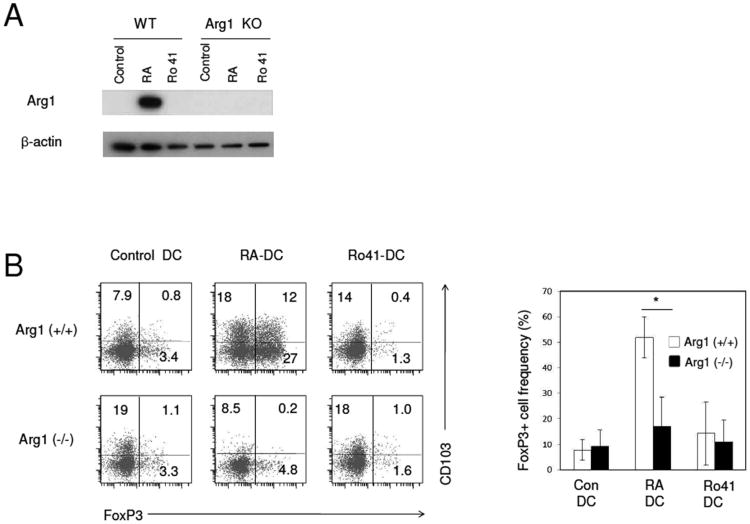
Arginase I (Arg1), an enzyme expressed by many cell types including myeloid cells, can regulate immune responses. Expression of Arg1 in myeloid cells is regulated by a number of cytokines and tissue factors that influence cell development and activation. Retinoic acid, produced from vitamin A, regulates the homing and differentiation of lymphocytes and plays important roles in the regulation of immunity and immune tolerance. We report here that optimal expression of Arg1 in DCs requires retinoic acid. Induction of Arg1 by retinoic acid is directly mediated by retinoic acid-responsive elements in the 5' noncoding region of the Arg1 gene. Arg1, produced by DCs in response to retinoic acid, promotes the generation of FoxP3(+) regulatory T (Treg) cells. Importantly, blocking the retinoic acid receptor makes DCs hypo-responsive to known inducers of Arg1 such as IL-4 and GM-CSF in Arg1 expression. We found that intestinal CD103(+) DCs that are known to produce retinoic acid highly express Arg1. Our results establish retinoic acid as a key signal in expression of Arg1 in DCs.


Figures

Fig. 1
Fig. 1. Retinoic acid induces Arg1 expression in BM-DCs
(A) A genome-wide microarray multi-plot. BM-DCs were prepared by culturing mouse bone marrow cells with GM-CSF for 9-10 days. RA (10 nM) or Ro41-5253 (Ro41; 100 nM) was added as indicated during this culture. BALB/C BM-DCs were examined in the immature state or after activated with LPS for 24 h. (B) Real-time qRT-PCR analysis of Arg1 mRNA expression in BM-DCs induced with GM-CSF. The data are presented relative to β-actin expression. (C) BM-DC lysates were examined for expression of cellular Arg1 protein expression. Lysates of ∼0.3 million DCs were loaded for the western blotting study. β-actin was used as a loading control. (D) Induction of Arg1 mRNA and protein in FLT3L-induced BM-DCs. BM-DCs were prepared by culturing mouse bone marrow cells with FLT3L for 9-10 days. RA or Ro41 was added as indicated during this culture. Real-time qRT-PCR and flow cytometry were performed. (E) Arginase enzyme activity was measured in BM-DC lysates. (F) Expression of Arg2, CAT2B, and RALDH2 mRNA in the DCs populations. Data are shown as mean + SEM of 3-4 data sets (D-F; pooled) or mean + SD of triplicate measurements (B, CAT2B in F; representative) from 3-4 experiments performed. For most experiments except that of panel D, GM-CSF-induced DCs were used. Significant differences between the groups (Student's t test) are indicated as *p<0.05, **p<0.001 and ***p<0.0001.
Fig. 2
Fig. 2. Intestinal DCs express Arg1
(A) Expression of Arg1 protein by spleen versus small intestinal lamina propria DCs. Cell purity is shown before and after isolation. Lysates of ∼0.3 million DCs were loaded for the western blotting study. β-actin was used as a loading control. Data shown are representative of three experiments performed. (B) Flow cytometric detection of Arg1 expression by CD11chigh CD103+ DCs, CD11chigh CD103- DCs, and CD11bhigh F4/80+ macrophages isolated from the small intestinal lamina propria. The mean fluorescence intensity for the antigen presenting cells in the small intestine and spleen is also shown (right). Data are shown as mean + SEM of results pooled from three experiments. Significant differences between the groups (Student's t test) are indicated as *p<0.05, **p<0.001 and ***p<0.0001.
Fig. 3
Fig. 3. RA and IL-4 cooperatively induce Arg1 expression
(A, B) The expression of Arg1 (A) mRNA and (B) protein in DCs induced by RA and IL-4 is shown. (C, D) The expression of Arg1 (C) mRNA and (D) protein in M-CSF-activated marrow cells in response to RA is shown. BM cells were cultured for 9-10 days with GM-CSF in the presence of RA (10 nM), Ro41 (100 nM), and/or IL-4 (5 ng/ml). BM-derived macrophages were prepared by culturing marrow cells with M-CSF for 7 days. Real time PCR and western blotting were performed. Data are shown as mean + SD of triplicate measurements (A, C) and are from one experiment representative of three performed (B, D). Significant differences between the groups (Student's t test) are indicated as *p<0.05, **p<0.001 and ***p<0.0001.
Fig. 4
Fig. 4. RAR binding elements in the 5′ upstream region of theArg1gene mediate the induction of Arg1 expression in response to RA
(A) The expression of mRNA for RARα, RARβ and RARγ in BM-DCs developed with RA or Ro41 is shown. (B) The Arg1 promoter is activated in response to retinoic acid. The luciferase reporter was electro-transfected into control BM-DCs and luciferase activity was measured following activation of the transfected cells with indicated factors (RA and/or IL-4) for 3.5 hours. (C) Presence of putative RAREs in the Arg1 promoter is shown. (D) Chromatin immunoprecipitation assay for RAR binding to the Arg1 promoter. (E) The Arg1 promoter construct with mutations in the three RARE sites is defective in driving the transcription. Pooled data obtained from 4-5 experiments are shown with SEM (A, B, E) or differences between duplicated measurements are shown (D). All experiments were performed at least 3 times. Significant differences between the groups (Student's t test) are indicated as *p<0.05, **p<0.001 and ***p<0.0001.
Fig. 5
Fig. 5. Arg1, expressed by dendritic cells in response to RA, promotes the generation of FoxP3+ T cells
(A) RA-treated DCs are efficient in induction of Treg cells. A co-culture method used to assess the activity of DCs in induction of Treg cells is shown in the diagram. (B) Treg-cell induction was determined after the exposure of RA-DCs to Arg1 inhibitors at 10 μM. Data are shown as mean + SEM of results pooled from 3-6 experiments. (C and D) Cell-free Arg1 from RA-DCs can promote Treg-cell induction. Conditioned media of control, RA and Ro-DCs (106 cells/ml for 48 h) were obtained from the cells and examined for (C) Arg1 protein and (D) effects on Treg-cell induction. For culture with T cells, the conditioned media were obtained by culturing 8-day old control, RA and Ro-DCs for additional 2 days in the absence of RA or Ro41. Splenocytes enriched with naïve CD4+ T cells isolated from DO11.10 rag (-/-) mice were cultured in the conditioned medium (70% conditioned medium and 30% fresh medium) in the presence of OVA323-339 (1 μg/ml) and BEC (100 μM). Five to six days later, frequencies of CD4+FoxP3+ T cells were determined. Data are shown as mean + SEM of results pooled from three experiments. Significant differences between the groups (Student's t test) are indicated as *p<0.05, **p<0.001 and ***p<0.0001.
Fig. 6
Fig. 6. Arg1-deficient dendritic cells are inefficient in the induction of Treg cells
(A) Arg1 protein expression was determined for wild type and Arg1-deficient BM-DCs. β-actin was used as a loading control. (B) Comparison of the activities of wild type and Arg1-deficient BM-DCs in the induction of Treg cells. Control, RA and Ro41-DCs were generated with GM-CSF from the marrow cells of WT and Arg1-deficient mice. Ten day-old BM-DCs were examined for Arg1 protein expression or Treg-cell-inducing activity. Data are shown as mean + SEM of results pooled from three experiments. *p=0.0078, Student's t test.
Fig. 7
Fig. 7. DC-derived RA induces Arg1 expression
8 day-old RA-DCs were cultured in the presence of DEAB (100 μM), retinol (100 nM) or DEAB plus retinol for 3 days. qRT-PCR was performed to determine Arg1 mRNA expression. Data are shown as mean + SD of triplicate measurements and are from one experiment representative of four performed. Significant differences between the groups (Student's t test) are indicated as *p<0.05 and **p<0.001.

Similar articles

Cited by

References

    1. Grohmann U, Bronte V. Control of immune response by amino acid metabolism. Immunol Rev. 2010;236:243–264. - PubMed
    1. Iyer RK, Yoo PK, Kern RM, Rozengurt N, Tsoa R, O'Brien WE, Yu H, et al. Mouse model for human arginase deficiency. Mol Cell Biol. 2002;22:4491–4498. - PMC - PubMed
    1. Shi O, Morris SM, Jr, Zoghbi H, Porter CW, O'Brien WE. Generation of a mouse model for arginase II deficiency by targeted disruption of the arginase II gene. Mol Cell Biol. 2001;21:811–813. - PMC - PubMed
    1. Peranzoni E, Marigo I, Dolcetti L, Ugel S, Sonda N, Taschin E, Mantelli B, et al. Role of arginine metabolism in immunity and immunopathology. Immunobiology. 2007;212:795–812. - PubMed
    1. Popovic PJ, Zeh HJ, 3rd, Ochoa JB. Arginine and immunity. J Nutr. 2007;137:1681S–1686S. - PubMed

Publication types

MeSH terms