. 2013 Mar;199(3):227-38.
doi: 10.1007/s00359-012-0788-0. Epub 2013 Jan 16.

Noninvasive diffusive optical imaging of the auditory response to birdsong in the zebra finch

Affiliations

Noninvasive diffusive optical imaging of the auditory response to birdsong in the zebra finch

James V Lee et al. J Comp Physiol A Neuroethol Sens Neural Behav Physiol. 2013 Mar.

Abstract

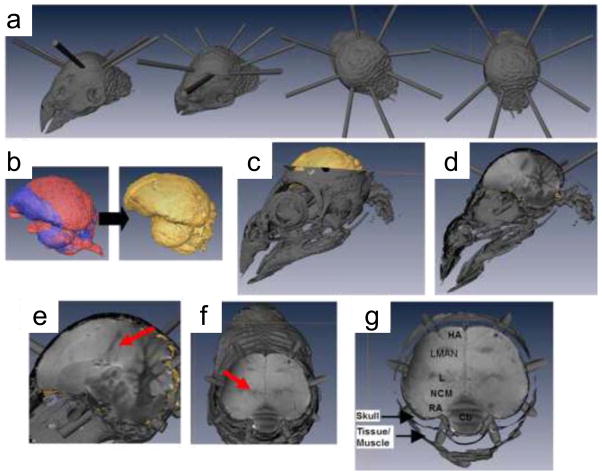
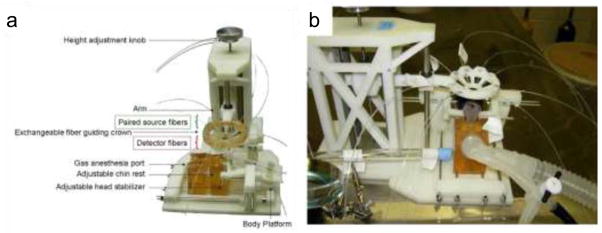
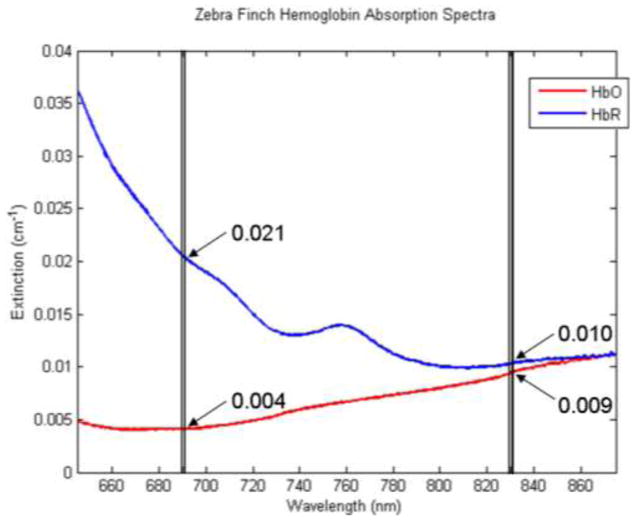
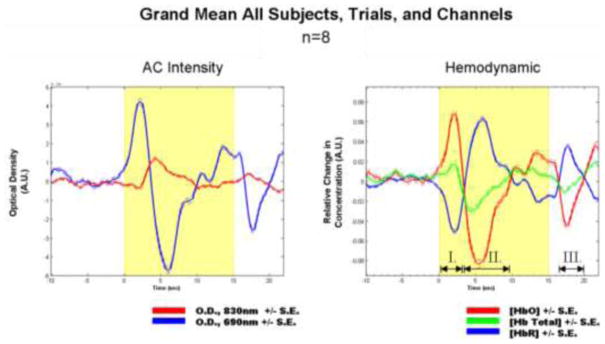
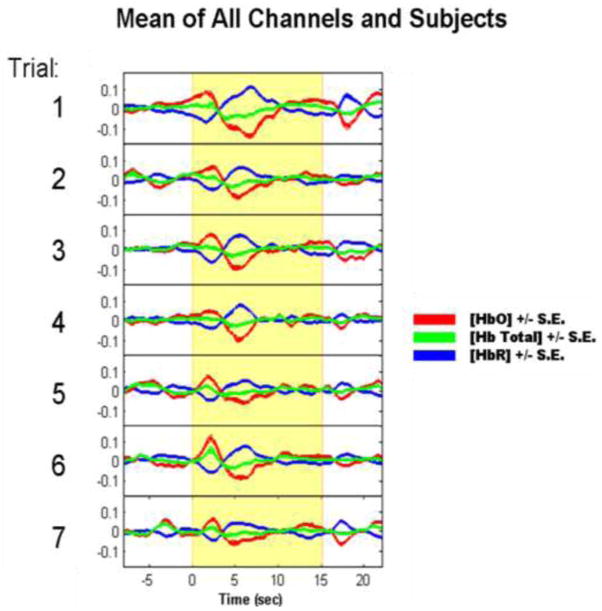
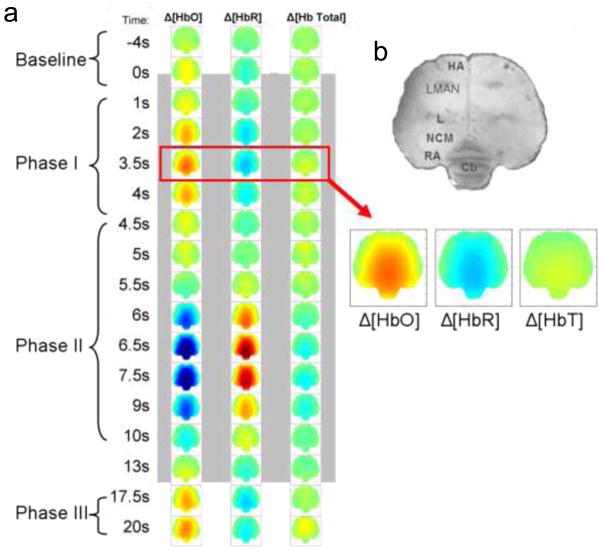
Songbirds communicate by learned vocalizations with concomitant changes in neurophysiological and genomic activities in discrete parts of the brain. Here, we tested a novel implementation of diffusive optical imaging (also known as diffuse optical imaging, DOI) for monitoring brain physiology associated with vocal signal perception. DOI noninvasively measures brain activity using red and near-infrared light delivered through optic fibers (optodes) resting on the scalp. DOI does not harm subjects, so it raises the possibility of repeatedly measuring brain activity and the effects of accumulated experience in the same subject over an entire life span, all while leaving tissue intact for further study. We developed a custom-made apparatus for interfacing optodes to the zebra finch (Taeniopygia guttata) head using 3D modeling software and rapid prototyping technology, and applied it to record responses to presentations of birdsong in isoflurane-anesthetized zebra finches. We discovered a subtle but significant difference between the hemoglobin spectra of zebra finches and mammals which has a major impact in how hemodynamic responses are interpreted in the zebra finch. Our measured responses to birdsong playback were robust, highly repeatable, and readily observed in single trials. Responses were complex in shape and closely paralleled responses described in mammals. They were localized to the caudal medial portion of the brain, consistent with response localization from prior gene expression, electrophysiological, and functional magnetic resonance imaging studies. These results define an approach for collecting neurophysiological data from songbirds that should be applicable to diverse species and adaptable for studies in awake behaving animals.


Figures

Fig 1
Fig 1
Optic fibers were coupled to the zebra finch scalp by designing and building interfaces around a scanned and digitized head. a Several views of the optode arrangement relative to the zebra finch head. b Optode arrangement is based on location of NCM. Visualization of NCM relative to the skull was accomplished by warping (in blue) the MRI zebra finch atlas (Poirier et al., 2008) with (in red) the brain-case of our digitized head to form a composite brain (yellow). See Methods for details. c The composite brain is fitted to the skull of our virtual head. The top part of the virtual head is removed to reveal the composite brain. d Mid-sagittal cut-away view of Fig. 1c showing the fitted MRI atlas. e A closer parasagittal and f horizontal view reveal brain areas relative to the optodes. The primary auditory area, Field L, serves as a landmark (dark area indicated by red arrow). g Closer view of the anatomical areas interrogated by the light paths from optodes to detectors. NCM = caudomedial nidopallium; L = field L; Cb = cerebellum; LMAN = lateral magnocellular nucleus of the anterior nidopallium; HA = apical part of the hyperpallium; and RA = robust nucleus of the arcopallium (Poirier et al., 2008; Reiner et al., 2004; Nixdorf-Bergweiler and Bischof, 2007 [cited 24 Mar 2010]).
Fig 2
Fig 2
a The apparatus for anesthetized-birds allows delivery of gas anesthesia while leaving the head free. Optodes are held in a crown that can be precisely lowered using a leadscrew. b A different angle of the apparatus showing a bird under gas anesthesia prior to having the guide-crown lowered.
Fig 3
Fig 3
Absorption spectra for zebra finch HbO (red) and HbR (blue). Extinction values are highlighted for 690nm and 830nm by the vertical double lines. The isosbestic point for zebra finch (Taeniopygia guttata) hemoglobin is between 870nm and 880nm, which is at a longer wavelength than it is for mammalian hemoglobin.
Fig 4
Fig 4
Grand mean AC intensity and hemodynamic responses of all subjects, channels, and trials during 15s song playback (yellow area shows when song was played). Bandpass filtered AC intensity values are shown on the left. Red lines are intensity values for 830nm; blue are for 690nm. These intensity values were used to estimate hemodynamic changes (on the right) by using the modified Beer-Lambert Law. Red, blue, and green lines show relative change from baseline in oxy-, deoxy-, and total hemoglobin concentrations, respectively. Dotted lines show respective standard errors for each time point calculated from the variance of all channels, subjects, and trials. The y-axis shows change relative to baseline in arbitrary units. Three distinct phases of the response are indicated by I, II, and III.
Fig 5
Fig 5
Mean hemodynamic response of all subjects and channels, displayed by trial. Red, blue, and green lines show relative change from baseline in oxy-, deoxy-, and total hemoglobin concentrations, respectively. Dotted lines show respective standard errors for each time point. Standard errors are small so they are difficult to see but are present in the above plot. Y-axis is in arbitrary units of change in concentration relative to baseline. Responses to the same stimulus were repeatable across trials and consistent in showing the three phases mentioned in Fig. 4.
Fig 6
Fig 6
Localization of responses: Hemodynamic activity maps showing spatiotemporal development of the response to the first presentation of the song stimulus for one subject (we arbitrarily chose to show the first subject). a Each map represents activity in the area shown in Fig. 1g. Greener colors correspond to baseline levels, redder colors indicate increases, and bluer colors indicate decreases. Time points are relative to stimulus onset and roughly trace the evolution of the response shown in Fig. 4. Brackets on the left side of the figure correspond to the approximate timing of response phases. Time is in seconds relative to stimulus onset (Note: the stimulus is 15s in duration), the gray box in the background represents time when stimulus was playing. b Enlarged versions of the boxes highlighted in red from Fig. 6a are shown below an anatomical slice of brain from the zebra finch MRI atlas. Maps crudely approximate areas of changes relative (and not absolute) to baseline. The color scale for these images was adjusted to prevent clipping.

Similar articles

Cited by

References

    1. Beauvoit B, Evans SM, Jenkins TW, Miller EE, Chance B. Correlation between the light scattering and the mitochondrial content of normal tissues and transplantable rodent tumors. Anal Biochem. 1995;226:167–174. - PubMed
    1. Berwick J, Martin C, Martindale J, Jones M, Johnston D, Zheng Y, Redgrave P, Mayhew J. Hemodynamic response in the unanesthetized rat: intrinsic optical imaging and spectroscopy of the barrel cortex. J Cereb Blood Flow Metab. 2002;22:670–679. - PubMed
    1. Boumans T, Gobes SM, Poirier C, Theunissen FE, Vandersmissen L, Pintjens W, Verhoye M, Bolhuis JJ, Van der Linden A. Functional MRI of auditory responses in the zebra finch forebrain reveals a hierarchical organisation based on signal strength but not selectivity. PLoS One. 2008;3:e3184. - PMC - PubMed
    1. Boumans T, Vignal C, Smolders A, Sijbers J, Verhoye M, Van Audekerke J, Mathevon N, Van der Linden A. Functional magnetic resonance imaging in zebra finch discerns the neural substrate involved in segregation of conspecific song from background noise. J Neurophysiol. 2008;99:931–938. - PubMed
    1. Boumans T, Theunissen FE, Poirier C, Van Der Linden A. Neural representation of spectral and temporal features of song in the auditory forebrain of zebra finches as revealed by functional MRI. Eur J Neurosci. 2007;26:2613–2626. - PMC - PubMed

Publication types

MeSH terms

LinkOut - more resources