. 2013 Jan 29;110(5):1941-6.
doi: 10.1073/pnas.1215165110. Epub 2013 Jan 15.

Toll-like receptor 4 stimulation with the detoxified ligand monophosphoryl lipid A improves Alzheimer's disease-related pathology

Affiliations

Toll-like receptor 4 stimulation with the detoxified ligand monophosphoryl lipid A improves Alzheimer's disease-related pathology

Jean-Philippe Michaud et al. Proc Natl Acad Sci U S A. .

Abstract

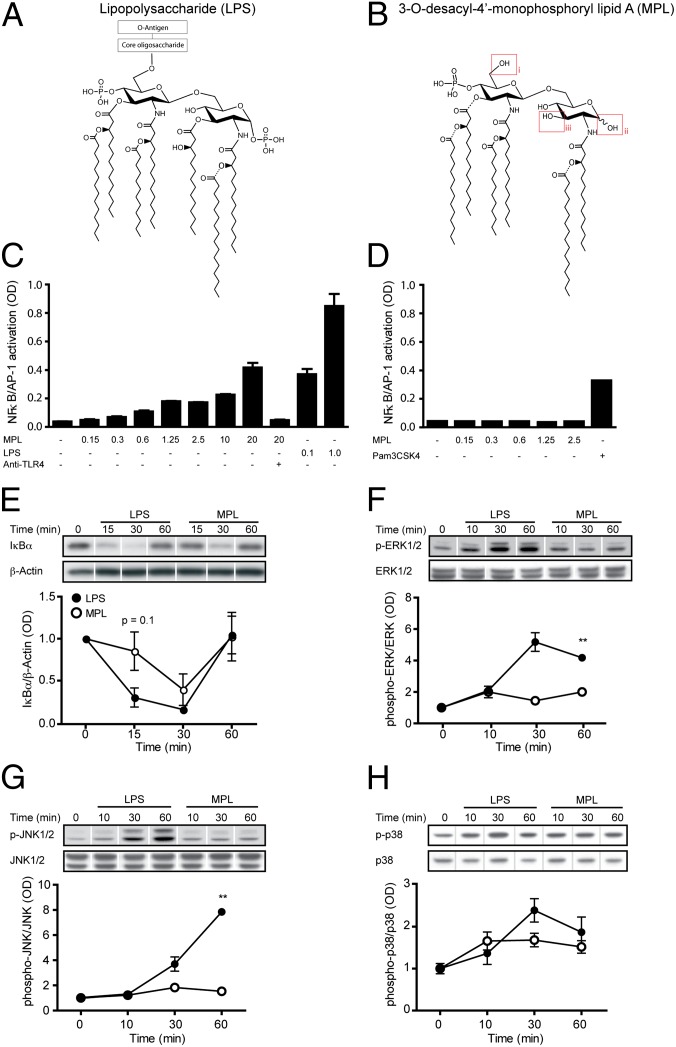
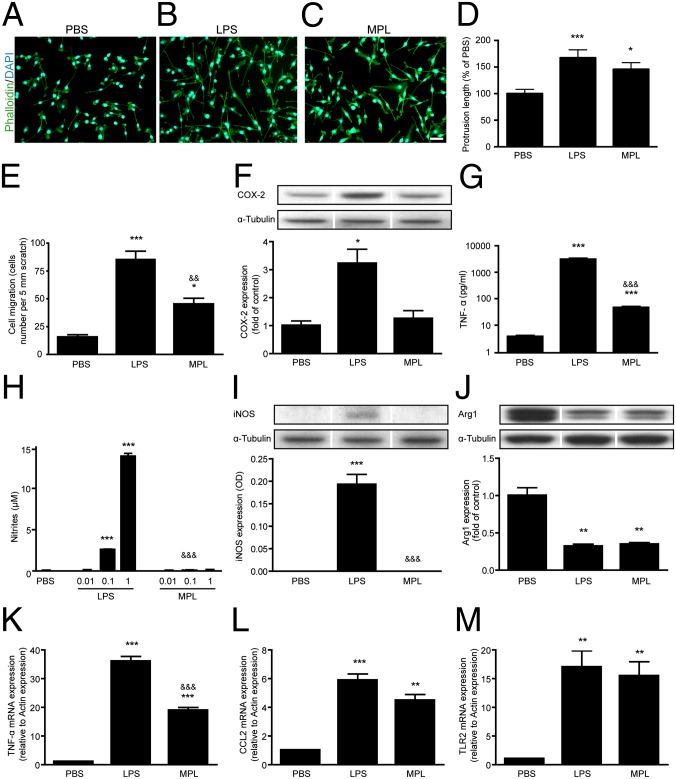
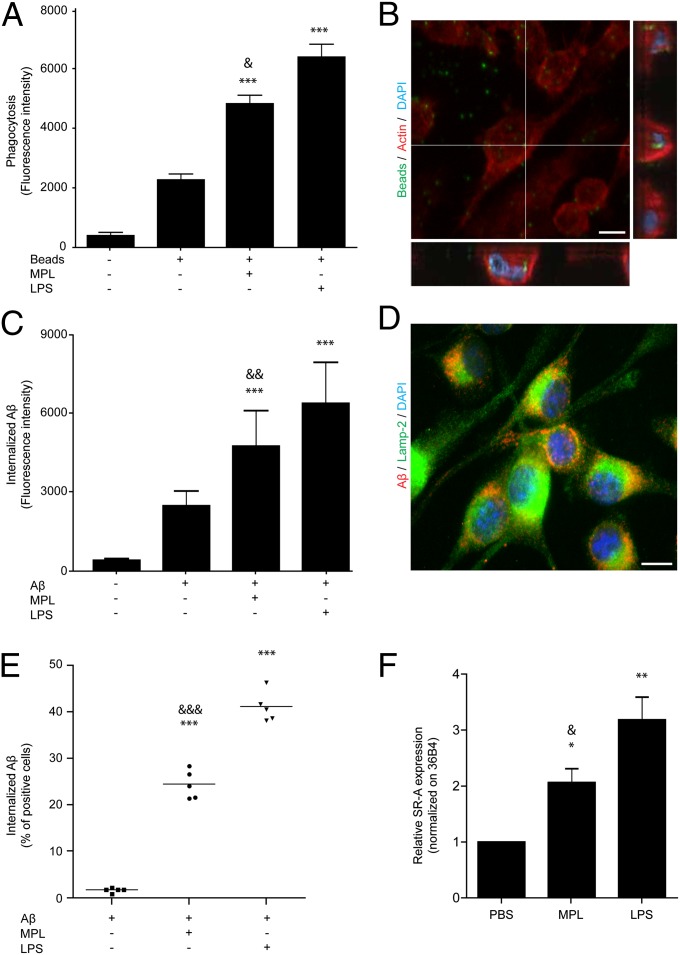
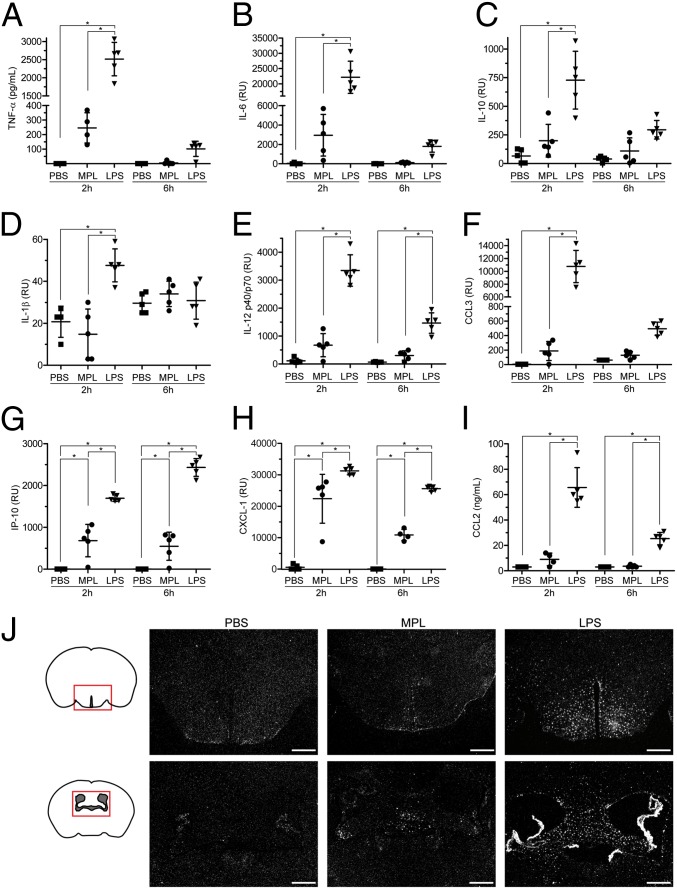
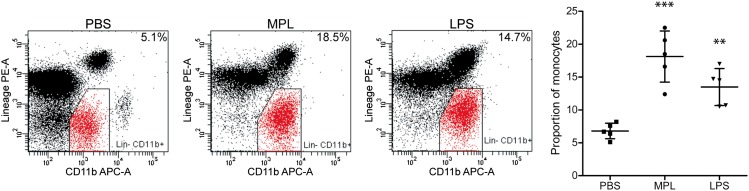
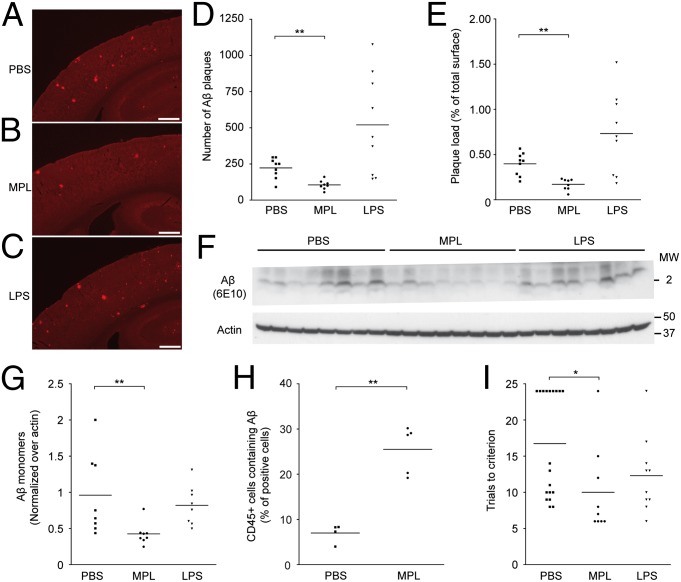
Alzheimer's disease (AD) is the most common cause of dementia worldwide. The pathogenesis of this neurodegenerative disease, currently without curative treatment, is associated with the accumulation of amyloid β (Aβ) in brain parenchyma and cerebral vasculature. AD patients are unable to clear this toxic peptide, leading to Aβ accumulation in their brains and, presumably, the pathology associated with this devastating disease. Compounds that stimulate the immune system to clear Aβ may therefore have great therapeutic potential in AD patients. Monophosphoryl lipid A (MPL) is an LPS-derived Toll-like receptor 4 agonist that exhibits unique immunomodulatory properties at doses that are nonpyrogenic. We show here that repeated systemic injections of MPL, but not LPS, significantly improved AD-related pathology in APP(swe)/PS1 mice. MPL treatment led to a significant reduction in Aβ load in the brain of these mice, as well as enhanced cognitive function. MPL induced a potent phagocytic response by microglia while triggering a moderate inflammatory reaction. Our data suggest that the Toll-like receptor 4 agonist MPL may be a treatment for AD.


Conflict of interest statement

Conflict of interest statement: M.H., P.T.-J., A.-M.L., R.J., C.C., V.B., R.P., A.P., and D.L. are employees of GlaxoSmithKline Vaccines. This research was supported in part by GlaxoSmithKline Vaccines.

Figures

Fig. 1.
Fig. 1.
Distinct mechanisms mediating LPS- and MPL-induced TLR4 signaling. (A) Comparison of LPS from Salmonella minnesota R595 and (B) the major hexa-acyl monophoryl lipid A (MPL) chemically extracted from Salmonella minnesota R595. MPL is characterized by three main chemical modifications: (i) elimination of the core oligosaccharide, (ii) hydrolysis of the 1-phosphate from the reducing end glucosamine, and (iii) removal of the acyl chain from the 3-position of the disaccharide. (C) TLR4-specific activation of NF-κB and AP-1 in HEK293 cells expressing TLR4, MD-2, and CD14 following stimulation with MPL and LPS for 5 h (n = 3). In contrast, (D) no TLR2 activation is observed in HEK293-TLR2 cells from MPL when used in vitro at concentrations up to 2.5 µg/mL. The TLR2 ligand Pam3CSK4 was used as a positive control (n = 3). Using the same concentration of ligands (1 μg/mL), (E) degradation of IκBα in BV-2 microglia is delayed and milder following MPL treatment compared with LPS. BV-2 cells incubated with MPL exhibit significantly lower (F) ERK1/2 and (G) JNK1/2 phosphorylation compared with LPS. However, (H) p38 phosphorylation in MPL-stimulated BV-2 cells was not statistically different from that in LPS-treated cells (n = 4–6 for EH). The lanes were run on the same gel but were noncontiguous. Data are expressed as the means ± SEM; **P < 0.01 vs. PBS.
Fig. 2.
Fig. 2.
MPL induces a low inflammatory response in microglia. BV-2 microglia were stimulated for 24 h with 1 μg/mL of LPS or MPL. F-actin (green) was stained with phalloidin to expose different cell morphologies: (A) nonactivated amoeboid shape, (B) LPS-activated elongated and multipolar morphology, and (C) an MPL-induced intermediate phenotype. (Scale bar, 100 μm.) (D) Total protrusion length was measured in a minimum of 70 cells per treatment group. (E) The migration of BV-2 cells was assessed using the scratch assay test (n = 3). (F) No induction of COX-2 was observed following MPL stimulation in contrast to LPS (n = 3–4). (G) A strong TNF-α secretion was seen in the media of LPS-incubated cells, whereas low levels were detected for MPL-treated cells (n = 6). (H and I) MPL did not generate nitrites or iNOS expression in comparison with the robust induction by LPS (n = 3–6). (J) Arginase 1 levels were similarly reduced following LPS or MPL stimulation (n = 3). (K) Two hours after cell stimulation, the transcriptional activation of TNF-α was lower in MPL-treated cells than in those treated with LPS. (L and M) Both MPL and LPS induced comparable levels of CCL2 and TLR2 mRNA at 2 h poststimulation (n = 3). The lanes were run on the same gel but were noncontiguous. Data are expressed as the means ± SEM. *P < 0.05, **P < 0.01, ***P < 0.001 (vs. PBS); &&P < 0.01, &&&P < 0.001 (vs. LPS).
Fig. 3.
Fig. 3.
MPL stimulates phagocytosis in microglia and monocytes. BV-2 microglia were stimulated with 1 μg/mL of LPS or MPL for 18 h. (A) Both MPL and LPS stimulate the phagocytosis of fluorescent Escherichia coli beads by microglia (n = 3). (B) The intracellular localization of these beads (green) was validated by confocal microscopy. (Scale bar, 10 μm.) (C) Mean fluorescence intensity of internalized fluorescent Aβ oligomers was evaluated by flow cytometry and was increased after treatment with LPS or MPL. (D) Intracellular Aβ oligomers (red) were colocalizing with the lysosomal Lamp-2 proteins (green). (Scale bar, 10 μm.) (E) Distinct wild-type mice received a single LPS (20 μg) or MPL (50 μg) i.p. injection, and 24 h later 5 μg of fluorescent Aβ was injected via tail vein. Monocytes were isolated 2 h later and significantly more Aβ-containing cells were observed in MPL- and LPS-injected mice. (F) Scavenger receptor A (SR-A) mRNA was induced in microglia after 24 h of incubation with LPS or MPL. Data are expressed as the means ± SEM. *P < 0.05, **P < 0.01, ***P < 0.001 (vs. PBS); &P < 0.05, &&P < 0.01, &&&P < 0.001 (vs. LPS).
Fig. 4.
Fig. 4.
Mild activation of the immune system in response to systemic MPL injection in mice. (AI) Cytokine and chemokine profile in sera of wild-type mice 2 and 6 h after an i.p. injection of LPS (20 μg) or MPL (50 μg). Results are shown in relative units (RU), pg/mL or ng/mL (n = 4–5). The bars represent mean ± SEM. (J) Representative TLR2 mRNA in situ hybridization in brains of mice injected i.p. with PBS, MPL (50 μg), or LPS (3 μg). Twenty-four hours after the injection, LPS provoked a strong TLR2 induction in the circumventricular organs, choroid plexus, and brain parenchyma, whereas MPL triggered weak expression, mainly in circumventricular organs. (Scale bar, 500 μm.) *P < 0.05.
Fig. 5.
Fig. 5.
MPL triggers the expansion of blood monocytes in mice. Wild-type mice received a single i.p. injection of PBS, MPL (50 μg), or LPS (20 μg) and their blood was analyzed 24 h later by flow cytometry. Cells were considered to be monocytes by their expression of CD11b and the lack of lineage (Lin) markers: CD3, NK1.1, Ly6G, and B220 (n = 5). Data are expressed as the percentage of total CD45+ leukocytes excluding debris. The bars represent mean ± SD; **P < 0.01, ***P < 0.001 (vs. PBS).
Fig. 6.
Fig. 6.
MPL treatment reduces Aβ levels and cognitive deficits in APPswe/PS1 mice. MPL (50 μg), LPS (3 μg), or PBS was administered once a week by i.p. injection in 3-mo-old APPswe/PS1 mice for 12 consecutive weeks. (AC) Representative Aβ immunoreactivity in cortex and hippocampus is shown in brain sections of APPswe/PS1 mice injected with PBS, MPL, or LPS. (Scale bar, 500 μm.) (D and E) Compared with the PBS control group, the number and the area of Aβ plaques are significantly reduced in the cortex of MPL-treated mice (n = 9). (F) Extracellular Aβ monomers in mouse brains were quantified by Western blot analysis. (G) MPL-treated mice had significantly fewer monomers compared with controls, whereas the LPS group remained essentially unchanged (n = 8). (H) Analysis of CD45+ brain cells in 10-mo-old APPswe/PS1 after five consecutive daily i.p. injections of MPL (25 μg). Flow cytometry analysis of CD45+ brain cells that were immunoreactive for intracellular Aβ (using monoclonal anti-Aβ 6E10 antibody) revealed a significant increase in MPL-injected mice compared with the PBS control group (n = 4–5). (I) The hippocampus-based spatial learning and memory of APPswe/PS1 mice was evaluated in the T water maze behavioral test. APPswe/PS1 mice treated with MPL had a significant improvement of their cognitive functions as shown by their lower number of trials to reach the criterion in the reversal phase of the test (n = 9–19). Each point represents a single mouse and the horizontal bars are the mean for each group. *P < 0.05, **P < 0.01 (vs. PBS).

Comment in

References

    1. Querfurth HW, LaFerla FM. Alzheimer’s disease. N Engl J Med. 2010;362(4):329–344. - PubMed
    1. Wyss-Coray T. Inflammation in Alzheimer disease: Driving force, bystander or beneficial response? Nat Med. 2006;12(9):1005–1015. - PubMed
    1. Tahara K, et al. Role of toll-like receptor signalling in Abeta uptake and clearance. Brain. 2006;129(Pt 11):3006–3019. - PMC - PubMed
    1. Cameron B, Landreth GE. Inflammation, microglia, and Alzheimer’s disease. Neurobiol Dis. 2010;37(3):503–509. - PMC - PubMed
    1. Reed-Geaghan EG, Savage JC, Hise AG, Landreth GE. CD14 and toll-like receptors 2 and 4 are required for fibrillar Abeta-stimulated microglial activation. J Neurosci. 2009;29(38):11982–11992. - PMC - PubMed

Publication types

MeSH terms