. 2013 Feb 22;288(8):5381-8.
doi: 10.1074/jbc.M112.447227. Epub 2013 Jan 14.

SON protein regulates GATA-2 through transcriptional control of the microRNA 23a~27a~24-2 cluster

Affiliations

SON protein regulates GATA-2 through transcriptional control of the microRNA 23a~27a~24-2 cluster

Erin Eun-Young Ahn et al. J Biol Chem. .

Abstract

SON is a DNA- and RNA-binding protein localized in nuclear speckles. Although its function in RNA splicing for effective cell cycle progression and genome stability was recently unveiled, other mechanisms of SON functions remain unexplored. Here, we report that SON regulates GATA-2, a key transcription factor involved in hematopoietic stem cell maintenance and differentiation. SON is highly expressed in undifferentiated hematopoietic stem/progenitor cells and leukemic blasts. SON knockdown leads to significant depletion of GATA-2 protein with marginal down-regulation of GATA-2 mRNA. We show that miR-27a is up-regulated upon SON knockdown and targets the 3'-UTR of GATA-2 mRNA in hematopoietic cells. Up-regulation of miR-27a was due to activation of the promoter of the miR-23a∼27a∼24-2 cluster, suggesting that SON suppresses this promoter to lower the microRNAs from this cluster. Our data revealed a previously unidentified role of SON in microRNA production via regulating the transcription process, thereby modulating GATA-2 at the protein level during hematopoietic differentiation.


Figures

FIGURE 1.
FIGURE 1.
Son expression in hematopoietic cells. A, Son expression level in mouse total bone marrow cells, Lin progenitor cells, and macrophages. RT-qPCR analysis of Son expression relative to GAPDH. The bar indicates the mean expression level (n = 3). Note that Son level is high in Lin bone marrow cells and low in macrophages. Error bars, S.D. *, p < 0.05, compared with total bone marrow. B, Son is highly expressed in fetal mouse liver compared with that in adult mouse liver. *, p < 0.02, compared with the liver sample. C, Son expression in LSK cells and other hematopoietic progenitor populations, CMP, GMP and MEP. *, p < 0.004, compared with LSK. D, Son down-regulation during TPA-mediated differentiation of U937 cells, detected by Northern blotting. Signal intensities of EtBr-stained 18 S/28 S rRNA indicate the relative loading of total RNA. E, relative Son expression levels in normal human bone marrow and bone marrow cells from AML patients (M2 subtype). RNAs from normal bone marrow and AML patient bone marrow cells were used for qPCR of SON using the primer set targeting exon 1 (forward) and exon 3 (reverse) described under “Experimental Procedures.” GAPDH qPCR was used as an internal control to calculate the relative levels of SON expression. The data are presented at log2 scale of the SON to GAPDH ratios (−ΔΔCt). AML patient bone marrow cells show higher Son expression compared with normal bone marrow cells (normal bone marrow; n = 5, AML patient bone marrow; n = 16). The average is indicated by a black horizontal bar. *, p < 0.001. The p value was determined by using Student's t test.
FIGURE 2.
FIGURE 2.
Down-regulation of Gata-2 expression upon Son knockdown. A, down-regulation of Gata-2 mRNA upon Son knockdown in mouse Lin bone marrow cells. Two different shRNAs for mouse Son were introduced by retroviral infection, and mRNA for Son and several hematopoietic transcription factors were measured by qPCR. *, p < 0.03, compared with control shRNA. Error bars, S.D. B, down-regulation of SON mRNA upon SON knockdown with siRNAs in K562 and EML cells. *, p < 0.001; **, p < 0.005, compared with control siRNA. C, reduction of the GATA-2 protein in SON-depleted cells. SON protein level was determined by Western blotting and measuring the density of the band. The bar graphs represent relative density of the band (average ± S.D.) from two independent experiments. Representative results of Western blotting are shown. *, p < 0.001.
FIGURE 3.
FIGURE 3.
miR-27 is up-regulated upon SON knockdown and targets the 3′-UTR of GATA-2 mRNA. A, miRs are predicted to target human GATA-2 3′-UTR. B, miR-27a and miR-24 are up-regulated by SON siRNA in human K562 cells and murine EML cells. *, p < 0.001, compared with control siRNA. Error bars, S.D. C, miR-27a, but not miR-24, targets 3′-UTR of human GATA-2. 3′-UTR of human GATA-2 was cloned at the downstream of the CMV promoter and the luciferase gene. This construct was transfected into K562 cells that were pretreated with microRNA mimics of miR-27a and miR-24, and relative luciferase activity was measured. *, p < 0.05. D, reduction of endogenous GATA-2 protein by miR-27a mimic in K562 cells is shown.
FIGURE 4.
FIGURE 4.
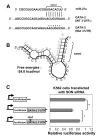
The 3′-UTR of GATA-2 mRNA contains miR-27a-binding sites. A, schematics showing the predicted miR-27a-binding sites in the 3′-UTR of human GATA-2 mRNA. The sequences altered in the mutant form of 3′-UTR are shown with asterisks. B, predicted structure of GATA-2 3′-UTR interacting with miR-27a. Gray line, miR-27a; black line, GATA-2 3′-UTR. C, sequence mutation at the predicted miR-27a binding site of GATA-2 3′-UTR alleviating the repressive effect of SON knockdown on luciferase expression. *, p < 0.04.
FIGURE 5.
FIGURE 5.
SON depletion activates the promoter of the miR-23a∼27a∼24-2 cluster. A, primary transcript of miR-23a∼27a∼24-2 is up-regulated upon SON knockdown, measured by qPCR. Locations of two primer sets used for qPCR are indicated with arrows in the figure of the transcript. *, p < 0.001. B, the promoter of the miR-23a∼27a∼24-2 is activated upon SON knockdown. The promoter contains the nucleotides from the positions bp −603 to +36 of the miR-23a∼27a∼24-2 gene (23P639). *, p < 0.001. C, the nucleotide sequences from −603 to −403 of the promoter contribute to SON-mediated suppression. Luciferase activity upon SON siRNA transfection was normalized by the luciferase activity of control siRNA-transfected cells to calculate -fold activation. *, p < 0.05, compared with −603 ∼ +36. D, schematic shows SON function in regulating the GATA-2 protein level through inhibition of the miR-23a∼27a∼24-2 cluster.

References

    1. Berdichevskii F. B., Chumakov I. M., Kiselev L. L. (1988) Decoding the primary structure of the son3 region in human genome: identification of a new protein with unusual structure and homology with DNA-binding proteins. Mol. Biol. 22, 794–801 - PubMed
    1. Chumakov I. M., Berdichevskii F. B., Sokolova N. V., Reznikov M. V., Prasolov V. S. (1991) Identification of a protein product of a novel human gene SON and the biological effect upon administering a changed form of this gene into mammalian cells. Mol. Biol. 25, 731–739 - PubMed
    1. Greenhalf W., Lee J., Chaudhuri B. (1999) A selection system for human apoptosis inhibitors using yeast. Yeast 15, 1307–1321 - PubMed
    1. Ahn E. Y., DeKelver R. C., Lo M. C., Nguyen T. A., Matsuura S., Boyapati A., Pandit S., Fu X. D., Zhang D. E. (2011) SON controls cell-cycle progression by coordinated regulation of RNA splicing. Mol. Cell 42, 185–198 - PMC - PubMed
    1. Sun C. T., Lo W. Y., Wang I. H., Lo Y. H., Shiou S. R., Lai C. K., Ting L. P. (2001) Transcription repression of human hepatitis B virus genes by negative regulatory element-binding protein/SON. J. Biol. Chem. 276, 24059–24067 - PubMed

Publication types

MeSH terms

LinkOut - more resources