. 2013 Mar 1;288(9):6511-21.
doi: 10.1074/jbc.M112.399485. Epub 2013 Jan 15.

Mutations in critical domains confer the human mTOR gene strong tumorigenicity

Affiliations

Mutations in critical domains confer the human mTOR gene strong tumorigenicity

Avaniyapuram Kannan Murugan et al. J Biol Chem. .

Abstract

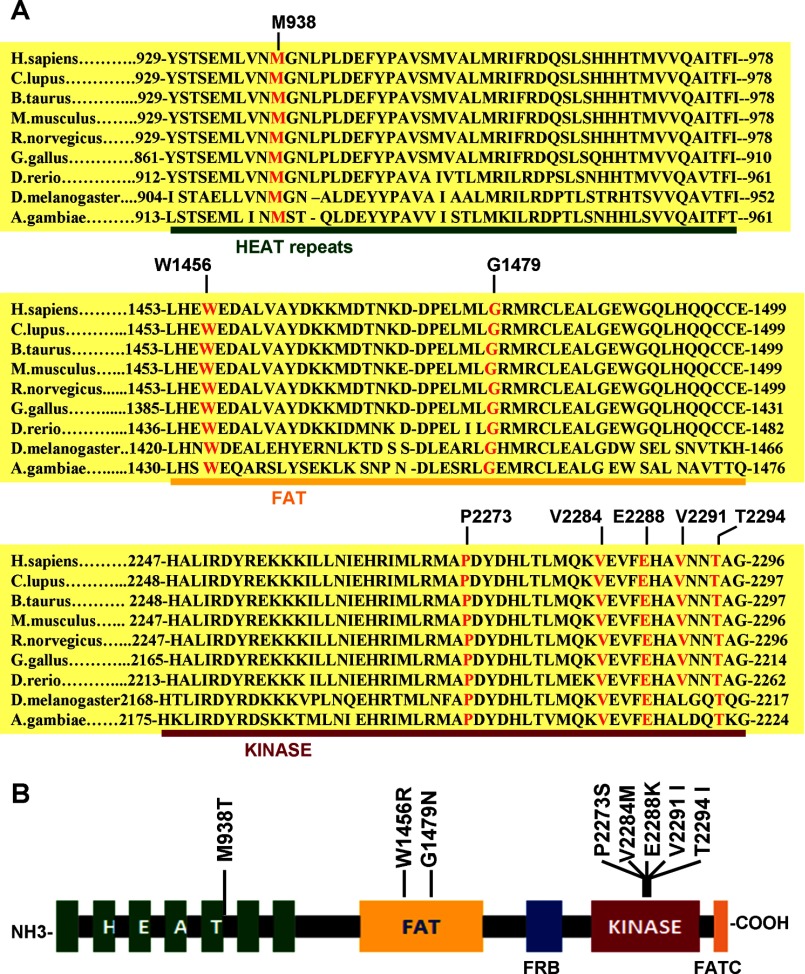
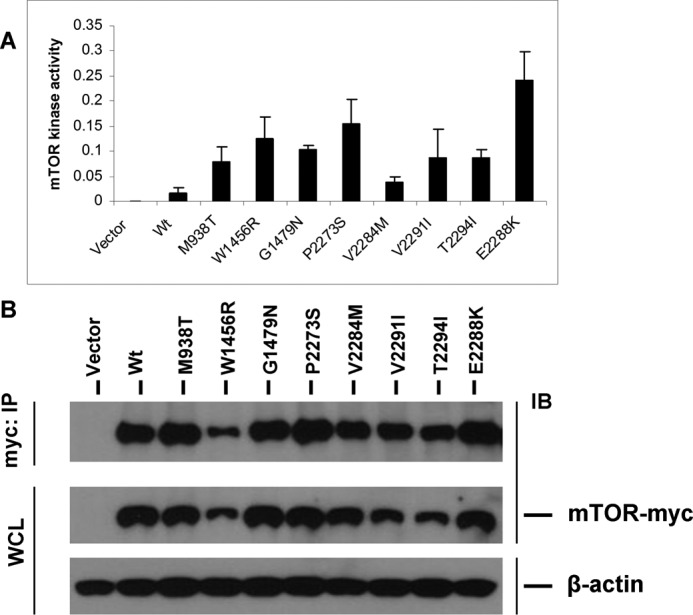
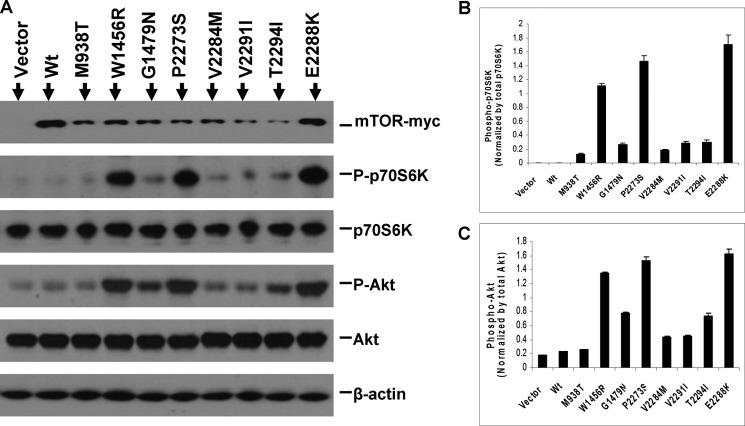
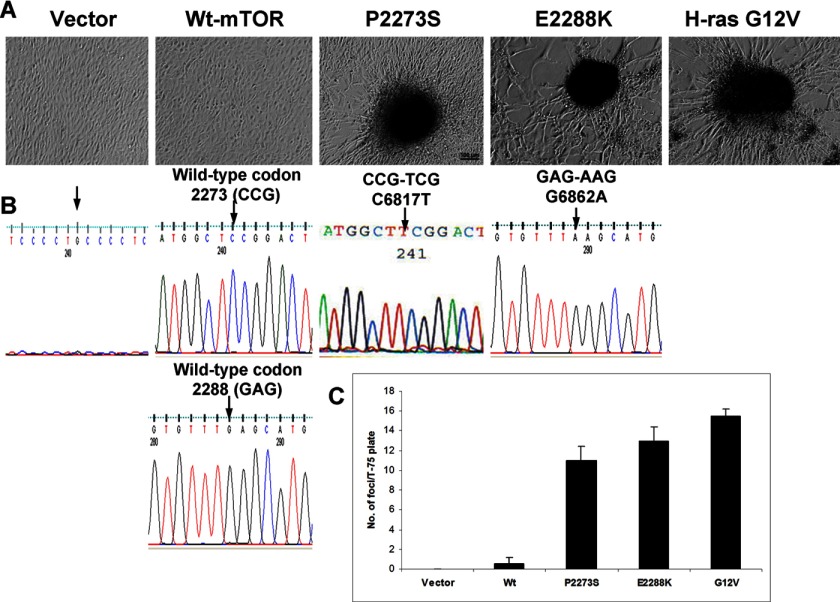
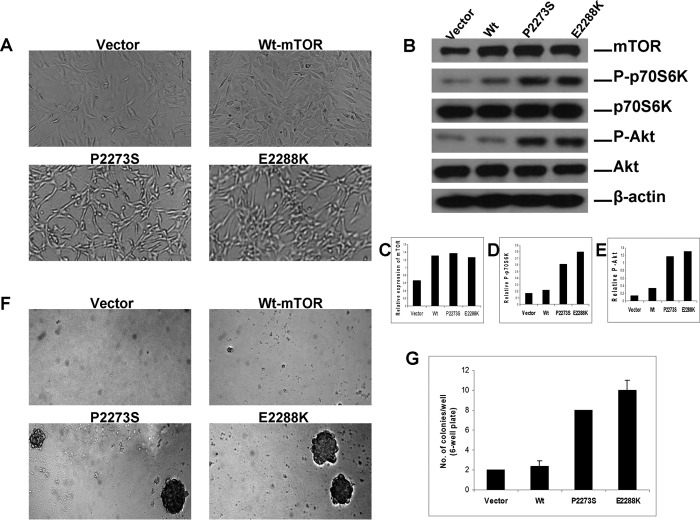
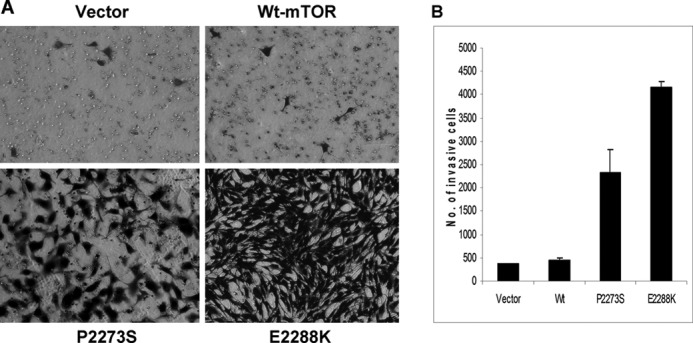
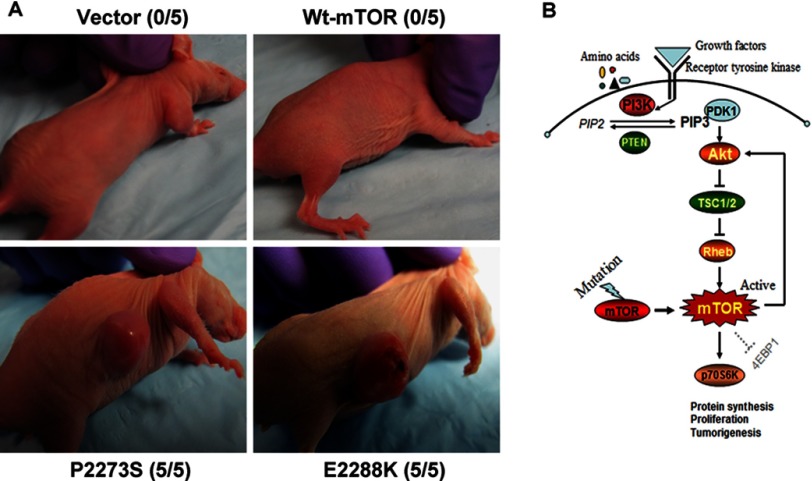
Mammalian target of rapamycin (mTOR) is a serine/threonine protein kinase that regulates cell growth, proliferation, and survival. mTOR is frequently activated in human cancers and is a commonly sought anticancer therapeutic target. However, whether the human mTOR gene itself is a proto-oncogene possessing tumorigenicity has not been firmly established. To answer this question, we mutated evolutionarily conserved amino acids, generated eight mutants in the HEAT repeats (M938T) and the FAT (W1456R and G1479N) and kinase (P2273S, V2284M, V2291I, T2294I, and E2288K) domains of mTOR, and studied their oncogenicity. On transient expression in HEK293T cells, these mTOR mutants displayed elevated protein kinase activities accompanied by activated mTOR/p70S6K signaling at varying levels, demonstrating the gain of function of the mTOR gene with these mutations. We selected P2273S and E2288K, the two most catalytically active mutants, to further examine their oncogenicity and tumorigenicity. Stable expression of the two mTOR mutants in NIH3T3 cells strongly activated mTOR/p70S6K signaling, induced cell transformation and invasion, and remarkably, caused rapid tumor formation and growth in athymic nude mice after subcutaneous inoculation of the transfected cells. This study confirms the oncogenic potential of mTOR suggested previously and demonstrates for the first time its tumorigenicity. Thus, beyond the pivotal position of mTOR to relay the oncogenic signals from the upstream phosphatidylinositol 3-kinase/Akt pathway in human cancer, mTOR is capable potentially of playing a direct role in human tumorigenesis if mutated. These results also further support the conclusion that mTOR is a major therapeutic target in human cancers.


Figures

FIGURE 1.
FIGURE 1.
Identification and selection of evolutionarily conserved wild-type amino acid residues in mTOR for the generation of mTOR mutants. A, amino acid sequence alignment of the mTOR proteins from nine different species. The eight selected amino acid residues (Met-938 in the HEAT repeats, Trp-1456 and Gal-1479 in the FAT domain, and Pro-2273, Val-2284, Glu-2288, Val-2291, and Thr-2294 in the kinase domain) are evolutionarily highly conserved among these different species. The selection criteria are as detailed under “Experimental Procedures.” B, schematic diagram of the major functional domains of the mTOR protein. Shown are the mutations generated by site-directed mutagenesis of the eight amino acids listed in A and the mTOR domains that carry them. The numbers indicate amino acid or codon positions, with the initiation codon (methionine) of the protein defined as number 1.
FIGURE 2.
FIGURE 2.
mTOR mutants show increased protein kinase activities. A, in vitro assay of protein kinase activities of mTOR mutants. HEK293T cells were transiently transfected with Myc-tagged vector, wild-type mTOR (Wt), and each of the eight mTOR mutants as indicated. Cell lysates were immunoprecipitated with the anti-c-Myc antibody, and immunoprecipitates were assayed for protein kinase activity of mTOR as described under “Experimental Procedures.” B, expression of mTOR mutants in the HEK293T cells corresponding to the assays shown in A. HEK293T cells transiently transfected with the indicated vector constructs described in A and cell lysate proteins were subjected to immunoprecipitation followed by the corresponding protein kinase assays described in A. Part of these immunoprecipitates (IP) and whole cell lysate (WCL) from the above indicated transfectants were visualized by SDS-PAGE and Western blotting analyses (IB) and for the indicated proteins using appropriate antibodies as described under “Experimental Procedures.” Successful immunoprecipitation of Myc-tagged wild-type mTOR and each of the mTOR mutants is shown in the top row. Successful expression of the wild type and each of the mTOR mutants was reconfirmed by analyzing the whole cell lysate shown in the middle row. β-Actin was used for quality control of the loading proteins.
FIGURE 3.
FIGURE 3.
Activation of the mTOR/p70S6K and Akt signaling pathways by mTOR mutants in HEK293T cells. A, Western blotting analysis of the HEK293T cells transfected with Myc-tagged vector, wild-type mTOR, and each of the mTOR mutants. Activation is reflected by increased phosphorylation of p70S6K (P-p70S6K) and Akt (P-Akt). HEK293T cells were transiently transfected with c-Myc-tagged vector, wild-type mTOR (Wt), and each of the mTOR mutants as indicated. Cell lysates were subjected to Western blotting analyses for the indicated proteins using the appropriate antibodies as described under “Experimental Procedures.” Shown, from top to bottom, are the expression of empty vector, wild-type mTOR, and eight mTOR mutants; phosphorylation levels of p70S6K (Thr-389); total p70S6K; phosphorylation levels of Akt (Ser-473); total Akt; and β-actin for quality controls of loading proteins. B and C, quantitative presentation of the phosphorylation levels of p70S6K and Akt, respectively. The phosphorylation levels of p70S6K and Akt corresponding to the transfection conditions described in A as indicated were normalized by dividing the intensities of P-p70S6K by the total p70S6K and P-Akt by the total Akt described in A. The results represent mean ± S.D. of three independent experiments.
FIGURE 4.
FIGURE 4.
Focus formation of NIH3T3 cells promoted by mTOR mutants. A, cell focus-forming activities of mTOR mutants. Shown are images of adherent growth of NIH3T3 cells transfected with Myc-tagged vector, wild-type mTOR, and each of the mTOR mutants as indicated. Cells were cultured in regular medium with 10% FCS under standard conditions. Images of cell foci were photographed with ×10 magnification after appropriate culture of cells as described under “Experimental Procedures.” Transfection of cells with H-Ras G12V as a positive control induced cell focus formation. B, a sequencing electropherogram of the mTOR gene. Each of the multilayered foci was cloned and cultured, and genomic DNA was isolated, PCR-amplified, and sequenced as described under “Experimental Procedures.” As expected, the sequencing electropherogram of the empty vector shows no amplification or a junk, the two wild types show no mutation in the corresponding positions of the mutants analyzed, and the mutants show the expected introduced mutations for P2273S and E2288K. C, number of cell foci formed with the indicated transfections. The number of transfected foci was counted 21 days after cell transfection. The results represent mean ± S.D. of three independent experiments.
FIGURE 5.
FIGURE 5.
Morphologic transformation and anchorage-independent growth of cells transfected with mTOR mutants. A, morphologic transformation of NIH3T3 cells stably expressing mTOR mutants. Cells were plated at low density, cultured, maintained, and photographed as detailed under “Experimental Procedures.” Shown are representative images of morphology of NIH3T3 cells stably expressing empty vector, wild-type mTOR, and the indicated mTOR mutants. B, corresponding expression of the mTOR mutants and their activation of mTOR/p70S6K and Akt signaling in NIH3T3 cells. NIH3T3 cells corresponding to those mentioned in A, stably transfected with the empty vector, wild-type mTOR, and the indicated mTOR mutants were subjected to lysis and Western blotting analyses as described in the legend for Fig. 3A. Thus, stable transfection and expression of mTOR mutants in NIH3T3 cells also activated mTOR/p70S6K and Akt signaling, consistent with similar observations in transiently transfected HEK293T cells (Fig. 3). C, relative expression of the mTOR protein in stably transfected NIH3T3 cells. Densitometry was performed to measure the density of the mTOR and β-actin bands shown in B. The relative mTOR levels were obtained by dividing the mTOR band density by the corresponding β-actin band density. D and E, relative phosphorylation of the p70S6K and Akt protein in stably transfected NIH3T3 cells. Densitometry was performed to measure the densities of the phospho-p70S6K, p70S6K, phospho-Akt, and Akt bands shown in B. The relative phospho-p70S6K and phospho-Akt levels were obtained by dividing the phospho-p70S6K and phospho-Akt band densities by the corresponding p70S6K and Akt band density, respectively. F, anchorage-independent cell growth of mTOR mutants on soft agar. NIH3T3 cells stably transfected with the empty vector, wild-type mTOR, and the indicated mTOR mutants as confirmed in B were seeded in soft agar. Colonies formed 4 weeks later and were photographed with ×40 magnification. G, analysis of the number of colonies. The number of cell colonies corresponding to C that were >0.1 mm in diameter was counted. The results represent mean ± S.D. of three independent experiments.
FIGURE 6.
FIGURE 6.
Cell invasion promoted by mTOR mutants. A, in vitro invasion assay of NIH3T3 cells with various transfections. Cells were stably transfected with the empty vector, wild-type mTOR, and the indicated mTOR mutants followed by a cell invasion assay performed as described under “Experimental Procedures.” Shown are the cells that invaded on the Matrigel matrix-coated polyethylene terephthalate membrane after removal of the non-invasive cells. B, the number of invading cells with the indicated transfections. The results of each column represent the mean ± S.D. of the numbers of invasive cells from three independent experiments.
FIGURE 7.
FIGURE 7.
In vivo tumorigenicity of mTOR mutants in nude mice and mTOR mutant-promoted mTOR/p70S6K signaling. A, in vivo tumorigenic assay of NIH3T3 cells with various transfections. NIH3T3 cells stably transfected with the empty vector, wild-type mTOR, and the mTOR mutants P2273S or E2288K were inoculated subcutaneously into athymic nude mice as described under “Experimental Procedures” and subsequently were observed for tumor formation. Photographs of the tumors and animals were taken 2 weeks after cell inoculation. Tumor necrosis was seen in some cases. Each group consisted of five mice. A representative mouse is shown for each group, and the number shown in parentheses for each group represents the number of animals, of five total mice, that formed tumors. B, schematic illustration of mutant mTOR signaling to promote tumorigenesis. mTOR normally regulates translation initiation and cell proliferation by integrating inputs from upstream signaling pathways, particularly from the PI3K/Akt pathway, that are activated by growth factors and receptor tyrosine kinases through the indicated signaling cascade. Upon mutation, mTOR becomes strongly activated and continuously phosphorylates and activates its substrates, p70S6K and Akt, to promote protein synthesis, cell proliferation, and tumorigenesis.

Similar articles

Cited by

References

    1. Wullschleger S., Loewith R., Hall M. N. (2006) TOR signaling in growth and metabolism. Cell 124, 471–484 - PubMed
    1. Sabatini D. M. (2006) mTOR and cancer: insights into a complex relationship. Nat. Rev. Cancer 6, 729–734 - PubMed
    1. Zoncu R., Efeyan A., Sabatini D. M. (2011) mTOR: from growth signal integration to cancer, diabetes and ageing. Nat. Rev. Mol. Cell Biol. 12, 21–35 - PMC - PubMed
    1. Hay N., Sonenberg N. (2004) Upstream and downstream of mTOR. Genes Dev. 18, 1926–1945 - PubMed
    1. Sarbassov D. D., Guertin D. A., Ali S. M., Sabatini D. M. (2005) Phosphorylation and regulation of Akt/PKB by the rictor-mTOR complex. Science 307, 1098–1101 - PubMed

Publication types

MeSH terms