. 2013 Jan 15;6(258):rs2.
doi: 10.1126/scisignal.2003512.

Systems-level analysis of proteolytic events in increased vascular permeability and complement activation in skin inflammation

Affiliations

Systems-level analysis of proteolytic events in increased vascular permeability and complement activation in skin inflammation

Ulrich auf dem Keller et al. Sci Signal. .

Abstract

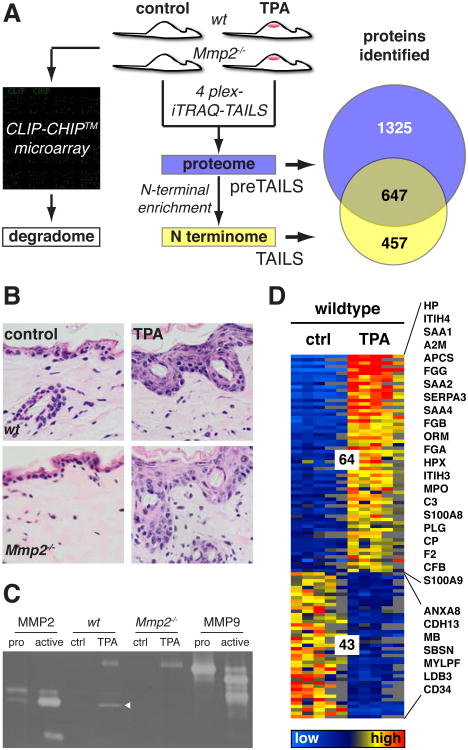
During inflammation, vascular permeability is increased by various proteolytic events, such as the generation of bradykinin, that augment local tissue responses by enabling tissue penetration of serum proteins, including complement and acute-phase proteins. Proteases also govern inflammatory responses by processing extracellular matrix proteins and soluble bioactive mediators. We quantified changes in the proteome and the nature of protein amino termini (the N-terminome) and the altered abundance of murine proteases and inhibitors during skin inflammation. Through analysis of the N-terminome by iTRAQ-TAILS, we identified cotranslational and posttranslational αN-acetylation motifs, quantitative increases in protein abundance, and qualitative changes in the proteolytic signature during inflammation. Of the proteins identified in normal skin, about half were cleaved, and phorbol ester-induced inflammation increased the proportion of cleaved proteins, including chemokines and complement proteins, that were processed at previously uncharacterized sites. In response to phorbol ester-induced inflammation, mice deficient in matrix metalloproteinase 2 (MMP2) showed reduced accumulation of serum proteins in the skin and exhibited different proteolytic networks from those of wild-type mice. We found that the complement 1 (C1) inhibitor attenuated the increase in serum protein accumulation in inflamed skin. Cleavage and inactivation of the C1 inhibitor by MMP2 increased complement activation and bradykinin generation in wild-type mice, leading to increased vessel permeability during inflammation, which was diminished in Mmp2(-/-) mice. Thus, our systems-level analysis of proteolysis dissected cleavage events associated with skin inflammation and demonstrated that loss of a single protease could perturb the proteolytic signaling network and enhance inflammation.


Conflict of interest statement

Competing interests: The authors declare that they have no competing interests

Figures

Fig. 1
Fig. 1
Proteomics and degradomics analysis of skin and skin inflammation. (A) The experimental strategy used to determine the transcriptome of the expressed proteases and inhibitors (also known as the protease degradome), the proteome, and the N-terminome in normal and inflamed skin of wild-type and Mmp2-/- mice. Analyzed were two animals per treatment type and genotype (8 mice in total) in five experiments (fig. S1). The total number of proteins identified by both iTRAQ-TAILS and iTRAQ-preTAILS is their union (2429), that is, 1325 proteins were identified only by preTAILS, 457 only by TAILS, and 647 by both iTRAQ-preTAILS and iTRAQ-TAILS. (B) Hematoxylin and eosin staining of back skin sections from wild-type and Mmp2-/- mice 48 hours after treatment with TPA or vehicle control. Multiple layers demonstrate hyperproliferation of epidermal keratinocytes and a higher cell density in the dermis as a result of the infiltration of immune cells, but no significant differences between wild-type and Mmp2-/- mice occurred. Back skins from all 8 animals (two per treatment type and genotype) were analyzed and representative images for each treatment type and genotype are shown. Scale bar: 20 μm. (C) Increased abundance of active MMP2 in inflamed skin. Gelatin zymography shows the increased abundance of active MMP2 (white triangle) in samples from TPA-treated wild-type compared to that in TPA-treated Mmp2-/- skin. ProMMP9 was present in the inflamed skin of mice of both genotypes. Recombinant pro- and active forms of MMP2 and MMP9 proteins were loaded as standards. (D) Differential abundance of proteins in response to TPA in the skin from wild-type mice. 976 proteins were quantified in at least three of five experiments (fig. S2A) and were analyzed for statistically significant changes in abundance between vehicle and TPA-treated skin from wild-type mice. The color code indicates the extent of change; thus, 64 proteins were increased ≥2- fold in abundance and 43 were reduced ≥ 2-fold in abundance (P ≤ 0.05, Limma moderated t-statistic, Benjamini-Hochberg multiple testing correction). Heatmap columns represent mice from each of five experiments. For details and a complete list of differentially abundant proteins see table S2.
Fig. 2
Fig. 2
Characterization of the N-terminome in inflamed skin. (A) Union of N-terminal peptides identified in all five experiments (fig. S1) and their assigned proteins. Examples of low-abundance proteins that were not identified by shotgun-like iTRAQ-preTAILS analysis but were identified after iTRAQ-TAILS are shown by the left side arrow. (B) Frequency distribution of N-termini based on annotation in the UniProtKB/Swiss-Prot database. Natural N-termini include proteins starting with or without an initiator methionine (Met), a signal peptide (Sig), a propeptide (Pro), or a mitochondrial transit peptide (Trans). Data for normal skin was from 298 N-termini identified by 2plex CLIP-TRAQ-TAILS analysis of untreated skin samples from wild-type and Mmp2-/- mice. (C) Original mature N-terminus of MPO as identified by iTRAQ-TAILS. MPO was identified in the TPA-treated skin of wild-type and Mmp2-/- mice by an N-terminal peptide (underlined) of the processed precursor one amino acid residue upstream of a “potential” start site predicted in UniProtKB/Swiss-Prot. Inset shows equivalent high-intensity iTRAQ reporter ions only in the 114 (WT-TPA) and 117 (KO-TPA) channels. (D) Yellow inset and upper yellow graph: Acetylation status and amino acid frequency distribution for methionine removal and αN-acetylation for N-termini starting at positions 1 and 2; after initiator methionine (1M) removal with or without acetylation (Ac) [1M.(Ac)P1’-X(n)] (367); all acetylated after removal of initiator methionine (1M.AcP1’-X(n)) (241); and following an acetylated intact initiator methionine (1AcM.P2’-X(n)) (69). Green inset and lower graph: Positional distribution, acetylation status, and amino acid frequency distribution for potential methionine removal and αN-acetylation for N-termini starting at positions ≥3. Forty N-terminal peptides started after a Met (XM.(Ac)X). Seven of these were acetylated (XM.Ac.X), and together with 8 acetylated peptides starting with a Met (X.AcMX) are candidates for cotranslational acetylated alternative start sites. Nineteen more were internal and acetylated (X.AcXX), representing posttranslational αN-acetylation. Asterisks show distribution patterns for 39 N-termini that are similar to patterns from known translation start sites and thus indicate that these are alternative start sites. Inset shows the different amino acid distributions for posttranslational αN-acetylation of internal cleaved peptides vs. cotranslational patterns. (E) Quantitative categorization of N-termini in normal and inflamed wild-type skin. The distribution of quantitative ratios for natural N-termini in TPA-treated and control skin was used to define cutoffs for statistically significant changes in the abundances of N-terminal peptides in inflamed vs. normal skin. Roman numerals I to V indicate quantitative categories for N termini based on log2 wt-TPA/wt-ctrl)-ratios. I: present only in TPA-treated skin; II: significantly more abundant in TPA-treated skin compared to normal skin but present in both conditions; III: not significantly changed in abundance by TPA; IV: significantly less abundant in TPA-treated skin compared to normal skin but present in both conditions; V: absent from TPA treated skin.
Fig. 3
Fig. 3
Examples of proteolytic processing events identified during inflammation and epidermal differentiation. (A and B) Proteolytic processing of S100A8 and S100A9 during inflammation generates neo-N-termini with reporter ions in the wild-type (114) and knockout (117) channels with equal ratios vs. normal skin. This indicates the higher abundance and increased cleavage of both proteins during inflammation in mice of both genotypes. The acetylated original mature N-terminus of S100A9 was also detected (fig. S7). Western blotting analysis was used for confirmation. (C) Known cleavages related to the inflammatory stimulus. (D) Proteolytic turnover during epidermal differentiation. The peptide in parentheses was identified but with a probability of correct identification below the cutoff for high-confidence peptide identifications. Domains in LEKTI are numbered according to sequence homology with the human protein.
Fig. 4
Fig. 4
Changes in protease and inhibitor transcript abundances during inflammation and upon loss of MMP2. (A) Intensity log-ratio (M) vs. mean log intensity (A) plot of differentially regulated protease-related transcripts (proteases, inhibitors, inactive homologs) in inflamed vs. normal wild-type skin (table S16). Total RNA from TPA-treated and control skin from wild-type mice was analyzed by the CLIP-CHIP microarray. Selected proteases and inhibitors are labeled. Values are the averages of two replicates; the green and red dotted lines show the median and mean A-value of the dataset, respectively. A-values give relative intensity information that characterizes the sensitivity of the cDNA microarray analysis. (B) Comparison of changes in protease web–related gene expression induced by TPA in the skin of wild-type and Mmp2-/- mice as assessed by CLIP-CHIP analysis (table S17). Log2-ratios for genes that are ≥ two-fold (dotted lines) increased or decreased in expression in TPA-treated wild-type skin (WT) are plotted against log2-ratios for the corresponding genes in skin from MMP2 knockout mice (KO). Only genes with expression intensities (A-value) above the median were included. WT-, not regulated in wild-type; KO-, not regulated in Mmp2-/-.
Fig. 5
Fig. 5
Decrease in the extent of protein exudation in inflamed Mmp2-/- skin and in MMP2-dependent proteolysis in vivo. (A) Differential abundances of proteins in TPA-treated skin from wild-type and Mmp2-/- mice. 976 proteins were quantified in at least 3 of 5 experiments and were analyzed for their statistically significant differential abundance between TPA-treated wild-type and Mmp2-/- skin (two-fold, P ≤ 0.05, Limma moderated t-statistic, Benjamini-Hochberg multiple testing correction). (B) Western blotting analysis of acute phase proteins in TPA-treated and control skin from wild-type and Mmp2-/- mice. All skin samples analyzed by iTRAQ-TAILS were also analyzed by Western blotting for the acute phase proteins SAA1 and haptoglobin with specific antibodies. (C) Western blotting analysis of haptoglobin in plasma from MMP2-deficient animals (n = 3 mice, two of which are shown) and wild-type controls (n = 3 mice, two of which are shown) before and after treatment with a model of mustard oil– induced ear skin inflammation. (D) Quantitative categorization of N-termini in inflamed skin from Mmp2-/- and wild-type mice based on natural N-termini. The distribution of quantitative ratios for natural N-termini in TPA-treated wild-type and Mmp2-/- skin was used to define cutoffs for statistically significant changes in the abundances of N-terminal peptides in inflamed wild-type vs. knockout skin. (E) Protein assignment to N-termini categorized by position in the mature protein and differential abundance in inflamed skin from wild-type and Mmp2-/- mice. The 4-way Venn diagram indicates how many proteins were identified by which categories of N-terminal peptides. N-termini in overlapping categories correspond to different N-terminal peptides from the same protein. Hence, four proteins were identified by their natural N-terminus, which were not altered in abundance, and by the increased abundance of neo-N-termini (only one per protein). (F) Assignment of N-termini to C1 inhibitor (C1 Inh) and apolipoprotein C1 (APOC1). C1 Inhibitor was identified by its natural N terminus with equal abundance in both genotypes and by a single neo-N-terminus with a high log2(wt-TPA/ko-TPA) ratio (1.70) at position 471, which indicated MMP2-dependent cleavage at the reactive bond. The high-ratio N-terminus assigned to APOC1 indicated an MMP2-dependent cleavage by dipeptidyl peptidase 4 (DPPIV) and which is known to cut at sites with this sequence.
Fig. 6
Fig. 6
Control of vascular permeability by MMP2-dependent regulation of bradykinin release. (A) Extended Ingenuity pathway analysis demonstrating the control of bradykinin release from kininogen by MMP2. Proteins identified by N-terminal peptides are in red. A higher log2-ratio for the plasma kallikrein (KLKB1)-generated neo-N-terminus of kininogen-1 (KNG1a) than for the natural N-terminus of plasma kallikrein indicates stimulation of the protease by MMP2 activity. (B) Direct cleavage of C1 inhibitor (C1 Inh) by MMP2. SDS-PAGE and silver staining demonstrated the release of the expected 4-kD fragment from human recombinant C1 inhibitor by active MMP2 (lower gel), and the corresponding reduction in the molecular mass of the remaining N-terminal part of the protein (upper gel) only in the absence of the MMP2 inhibitor Marimastat (Marim.). (C) Inactivation of C1 inhibitor activity on plasma kallikrein by MMP2. Generation of bradykinin (BDK, m/z = 1060) from plasma kallikrein was monitored by MALDI-TOF in relation to a spike in the control peptide (m/z = 1296) in the presence and absence of the C1 inhibitor that had either been pre-incubated with MMP2 or buffer control. Representative spectra recorded after 30 min of incubation are shown. (D) Quantification of the relative amount of bradykinin release from five replicated MALDI-TOF measurements after 60 min of incubation. Error bars represent the SD. (E) Time-course of bradykinin generation as recorded by MALDI-TOF. Values represent the averages of two independent experiments. (F and G) Representative images of wild-type (WT) and Mmp2-/- mice subjected to the Miles assay for vascular permeability and showing the fold-increase in Evans blue dye release from mustard oil–treated vs. vehicle-treated ears (n = 3 mice; *P < 0.05 by Student's t test).
Fig. 7
Fig. 7
N-terminal analysis of the complement network and its control by MMP2. (A) Extended Ingenuity pathway analysis. A part of the classical and lectin complement pathway is shown with proteins that have N-terminal peptides identified by iTRAQ-TAILS shown in red. High log2-ratios indicate higher abundance in wild-type mice than in MMP2-deficient mice. (B) Detection of the N termini of complement C4 and their validation by Western blotting analysis. Fragments generated by known cleavages and, where available, their log2-ratios are indicated. (C) Detection of the N-termini of complement C3, as described for (B). Peptides in parentheses were identified but with a probability of correct identification below the cutoff for high-confidence peptide identifications. (D) Inhibition of complement activity by C1 inhibitor (C1 Inh) as assessed in a hemolytic assay with red blood cells. Pre-incubation of C1 inhibitor with active MMP2 abolishes its inhibitory activity on complement activation. Data from three experiments performed in duplicate and with two different inhibitor preparations. Data are means ± SE. n = number of measurements For each incubation type and with the following concentrations of C1 Inh, the n numbers indicate the number of measurements: 2.73 μM (n = 4), 3.64 μM (n = 4), 4.55 μM (n = 6), 6.36 μM (n = 6), 7.27 μM (n = 2). **P ≤ 0.01; ***P ≤ 0.0001 by Student's t test.

Similar articles

Cited by

References

    1. Parks WC, Wilson CL, Lopez-Boado YS. Matrix metalloproteinases as modulators of inflammation and innate immunity. Nat Rev Immunol. 2004;4:617–629. - PubMed
    1. Doucet A, Butler GS, Rodriguez D, Prudova A, Overall CM. Metadegradomics: toward in vivo quantitative degradomics of proteolytic post-translational modifications of the cancer proteome. Mol Cell Proteomics. 2008;7:1925–1951. - PubMed
    1. Lange PF, Overall CM. Protein TAILS: when termini tell tales of proteolysis and function. Curr Opin Chem Biol. 2012 http://dx.doi.org/10.1016/j.cbpa.2012.1011.1025. - DOI - PubMed
    1. Riddel JP, Jr, Aouizerat BE, Miaskowski C, Lillicrap DP. Theories of blood coagulation. J Pediatr Oncol Nurs. 2007;24:123–131. - PubMed
    1. Ehrnthaller C, Ignatius A, Gebhard F, Huber-Lang M. New insights of an old defense system: structure, function, and clinical relevance of the complement system. Mol Med. 2011;17:317–329. - PMC - PubMed

Publication types

MeSH terms

LinkOut - more resources