. 2013:3:1065.
doi: 10.1038/srep01065. Epub 2013 Jan 15.

A serum "sweet-doughnut" protein facilitates fibrosis evaluation and therapy assessment in patients with viral hepatitis

Affiliations

A serum "sweet-doughnut" protein facilitates fibrosis evaluation and therapy assessment in patients with viral hepatitis

Atsushi Kuno et al. Sci Rep. 2013.

Abstract

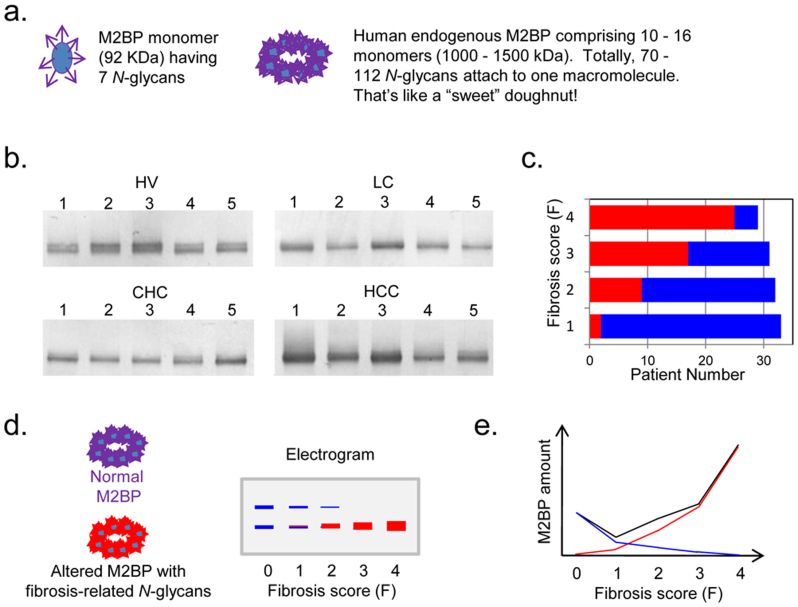
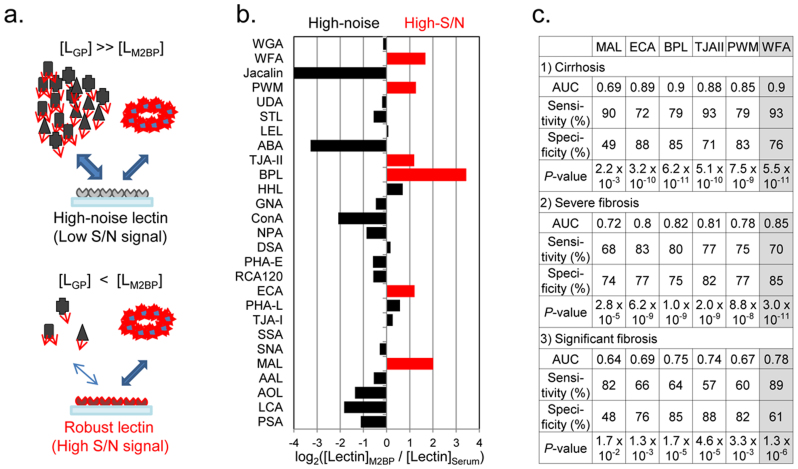
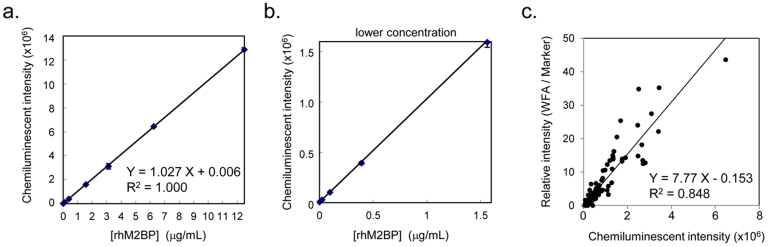
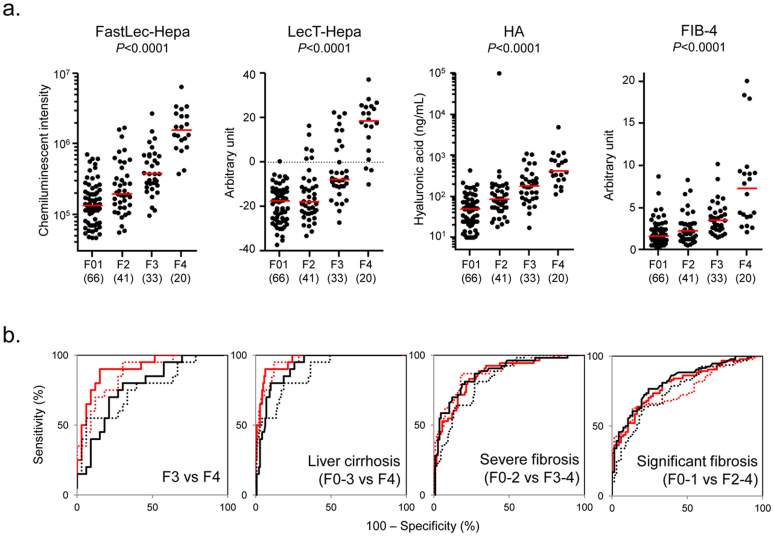
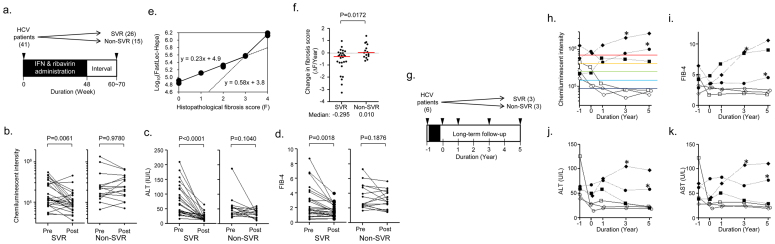
Although liver fibrosis reflects disease severity in chronic hepatitis patients, there has been no simple and accurate system to evaluate the therapeutic effect based on fibrosis. We developed a glycan-based immunoassay, FastLec-Hepa, to fill this unmet need. FastLec-Hepa automatically detects unique fibrosis-related glyco-alteration in serum hyperglycosylated Mac-2 binding protein within 20 min. The serum FastLec-Hepa counts increased with advancing fibrosis and illustrated significant differences in medians between all fibrosis stages. FastLec-Hepa is sufficiently sensitive and quantitative to evaluate the effects of PEG-interferon-α/ribavirin therapy in a short post-therapeutic interval. The obtained fibrosis progression is equivalent to -0.30 stages/year in patients with sustained virological response, and 0.01 stages/year in relapse/nonresponders. Furthermore, long-term follow-up of the severely affected patients found hepatocellular carcinoma developed in patients after therapy whose FastLec-Hepa counts remained above a designated cutoff value. FastLec-Hepa is the only assay currently available for clinically beneficial therapy evaluation through quantitation of disease severity.


Figures

Figure 1
Figure 1. Changes in the quality and quantity of human serum M2BP with progression of liver fibrosis.
(a) The unique shape of human endogenous serum M2BP. The arrowheads and circles represent the N-glycan moieties and core protein respectively. (b) Western blot analysis: M2BPs in 2 μl of serum were purified by immunoprecipitation before SDS-PAGE. HV, healthy volunteer; CHC, patient with chronic hepatitis C; LC, HCV-infected patient with liver cirrhosis; and HCC, HCV-infected patient with hepatocellular carcinoma. (c) Number of patients with single (red) or double (blue) band appearance on the blot. The number of bands was determined visually by two independent analysts. The total number of HCV patients who participated in this study was 125 (F0–F1 [n = 33], F2 [n = 32], F3 [n = 31], and F4 [n = 29]). (d) Typical changes of serum M2BP band intensities in patients with different fibrosis scores and (e) concentrations based on a previous report on quantitation of serum M2BP by Cheung et al. and our present results. The blue bands on the electrogram and blue line on the graph represent M2BPs secreted from normal liver. The red bands and line represent altered M2BP, the concentration of which is suggested to increase with the progression of fibrosis. The black line represents the total concentration of serum M2BP.
Figure 2
Figure 2. Selection of the optimal lectin for the lectin-antibody sandwich immunoassay.
(a) The kinetics of lectins binding to serum glycoproteins. The M2BP-binding lectins are divided into two categories: high-noise lectins and high signal-to-noise (S/N) lectins. The high-noise lectins bind to both M2BPs and abundant serum glycoproteins, causing a strong suppression of the M2BP–lectin interaction (see top panel). On the other hand, the number of binding targets in serum for the high S/N lectins is negligible, resulting in the specific interaction with the target M2BP (see lower panel). (b) Classification of M2BP-binding lectins. The high S/N lectins are those detecting M2BPs with at least twice the signal intensity seen for other serum glycoproteins. The classification strategy is summarized in Supplementary Fig. 4. (c) Diagnostic performance of 6 candidate lectins. P-values were determined using the nonparametric Mann–Whitney U test (Excel 2007, Microsoft).
Figure 3
Figure 3. Description of FastLec-Hepa, a fully automated WFA and anti-M2BP antibody sandwich immunoassay.
(a) Standard curve for quantitation of WFA-binding rhM2BP. Plots for the lower concentration of rhM2BP are alternatively highlighted in (b). (c) Scatterplot comparison of WFA+-M2BP data obtained from 125 different serum samples by both HISCL and a manual lectin microarray assay. The best-fit linear comparison with its correlation coefficient was calculated in Excel 2007 (Microsoft).
Figure 4
Figure 4. Comparison of diagnostic performance of FastLec-Hepa, LecT-Hepa, HA, and FIB-4.
(a) Scatterplots of the data obtained with FastLec-Hepa, LecT-Hepa, HA, and FIB-4 against the fibrosis score. Red horizontal lines represent the median. Correlation of the data with the progression of fibrosis was evaluated as significant differences in the medians relative to the fibrosis scores (P < 0.0001) by a nonparametric method, the Kruskal–Wallis one-way ANOVA. (b) Area under the receiver-operating characteristic (AUC-ROCs) curves of FastLec-Hepa, LecT-Hepa, HA, and FIB-4 for liver cirrhosis (F3 vs F4 or F0–3 vs F4), severe fibrosis (F0–2 vs F3–4), and significant fibrosis (F0–1 vs F2–4). FastLec-Hepa, LecT-Hepa, HA, and FIB-4 are indicated by a red solid line, red dotted line, black solid line, and black dotted line, respectively.
Figure 5
Figure 5. Evaluation of the curative effect of interferon therapy by FastLec-Hepa.
(a) Validation of FastLec-Hepa in short-interval evaluation. The numbers in parentheses represent the number of patients participated in this experiment. Arrowheads indicate the timing of blood collection. At week 0, blood was collected immediately before the treatment. Black box indicates the period of PEG-interferon-α and ribavirin therapy. Changes in the FastLec-Hepa counts (b), ALT (c), and the FIB-4 index (d) in patients with sustained virologic response (SVR) and relapse/nonresponders (non-SVR) during interferon therapy. The P-value was determined by a nonparametric method, the Wilcoxon matched pairs signed-rank test. (e) Dot-plot representation of the histopathological fibrosis score and the medians of FastLec-Hepa counts. Best-fit linear curves were calculated in Excel 2007 (Microsoft) allowing conversion of the FastLec-Hepa counts into fibrosis score. (f) Yearly changes in the converted fibrosis score. Changes for patients with SVR and non-SVR are indicated in the dot plots. Red horizontal lines represent the median. The P-value was determined by the Mann–Whitney U test. (g) Validation of FastLec-Hepa in long-term follow-up. The numbers in parentheses represent the number of patients participated in this experiment. Arrowheads indicate the timing of blood collection. At year -1 and 0, the blood was collected immediately before and after the treatment, respectively. Black box indicates the period of PEG-interferon-α and ribavirin therapy. Yearly changes of FastLec-Hepa counts (h), FIB-4 index (i), ALT (j), and AST (k) in individual patients after therapy. The five colored lines in (h) represent the median values obtained for each fibrosis stage (red, F4; orange, F3; green, F2; cyan, F1; blue, F0). Closed and opened symbols indicate the data obtained from non-SVR and SVR patients, respectively. * indicates the period when the development of HCC was found.

Similar articles

Cited by

References

    1. “Nature Outlook Hepatitis C” edited by Brody, H. et al. Nature 474, S1–S21 (2011). - PubMed
    1. Ge D. et al. Genetic variation in IL28B predicts hepatitis C treatment-induced viral clearance. Nature 461, 399–401 (2009). - PubMed
    1. Suppiah V. et al. IL28B is associated with response to chronic hepatitis C interferon-alpha and ribavirin therapy. Nat. Genet. 41, 1100–1104 (2009). - PubMed
    1. Tanaka Y. et al. Genome-wide association of IL28B with response to pegylated interferon-alpha and ribavirin therapy for chronic hepatitis C. Nat. Genet. 41, 1105–1109 (2009). - PubMed
    1. Ghany M. G., Strader D. B., Thomas D. L. & Seeff L. B. Diagnosis, management, and treatment of hepatitis C: an update. Hepatology 49, 1335–1374 (2009). - PMC - PubMed

Publication types

MeSH terms