

Emergent dynamics of laboratory insect swarms
- PMID: 23323215
- PMCID: PMC3545223
- DOI: 10.1038/srep01073
Emergent dynamics of laboratory insect swarms
Abstract
Collective animal behaviour occurs at nearly every biological size scale, from single-celled organisms to the largest animals on earth. It has long been known that models with simple interaction rules can reproduce qualitative features of this complex behaviour. But determining whether these models accurately capture the biology requires data from real animals, which has historically been difficult to obtain. Here, we report three-dimensional, time-resolved measurements of the positions, velocities, and accelerations of individual insects in laboratory swarms of the midge Chironomus riparius. Even though the swarms do not show an overall polarisation, we find statistical evidence for local clusters of correlated motion. We also show that the swarms display an effective large-scale potential that keeps individuals bound together, and we characterize the shape of this potential. Our results provide quantitative data against which the emergent characteristics of animal aggregation models can be benchmarked.
Figures
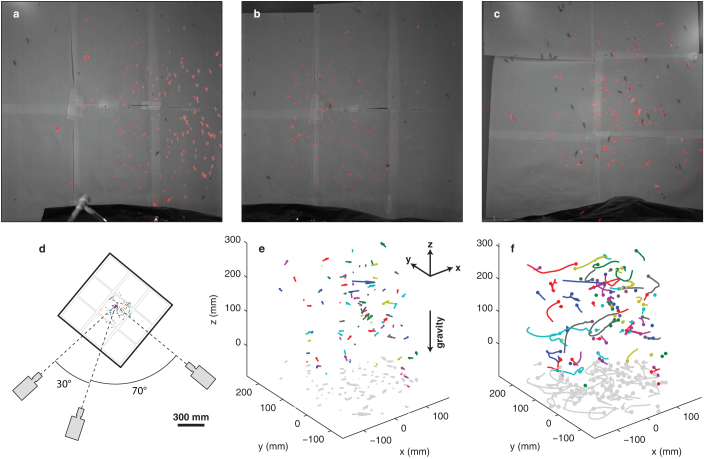
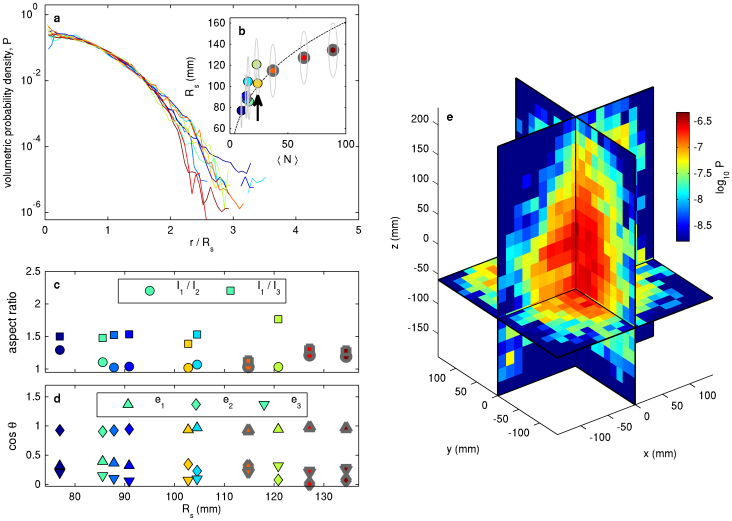
 . (b) Swarm size as a function of mean swarm population. Each data point is computed as the average over the entire time of observation, and the ellipses show the standard deviation. Note that the number of individuals in each swarm is not fixed, since midges may enter or leave the swarm during the measurement period. Marker colours correspond to curve colours in (a). The dashed curve is a Rs ∝ 〈N〉1/3 fit, as would be expected if the number density were independent of the swarm size. For the largest swarms, some of the midges flew outside the region imaged by the cameras; in these cases, the markers are outlined in grey. (c) Swarm aspect ratio as a function of swarm size. (d) Bulk swarm orientation. One axis of each swarm nearly aligns with gravity; for large swarms, it is the axis along which the swarm is longest, e1. (e) Spatial variation of swarm density. Slices through the three-dimensional probability density function of midge position are shown in colour on a logarithmic scale for the swarm marked with a black arrow in (b).
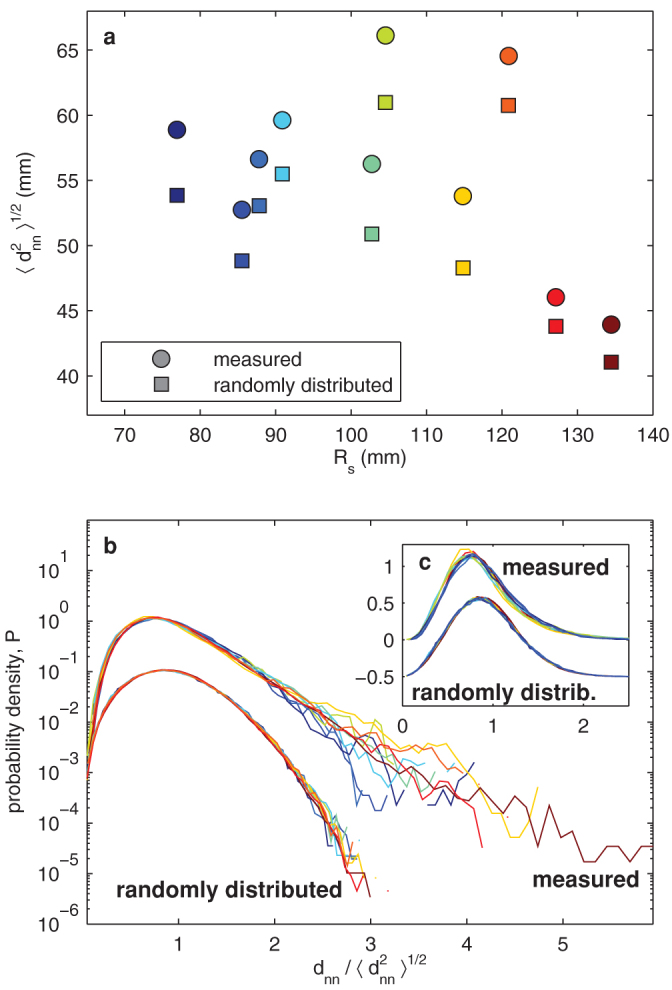
 for midge swarms and randomly distributed particles, shown as circles and squares, respectively. The data follow the same trend for each data set, but
  is always larger for real swarms. (b) Standardised PDFs of dnn for measured swarms (upper) and randomly positioned particles (lower); note that the lower curves have been vertically offset for clarity. Each curve shows data for one swarm. The most probable dnn is smaller for the swarms than for the random particles, (see also (c), which shows the same plots on linear axes), but the swarms also show a much longer tail, indicating larger voids.
Similar articles
-
Determining asymptotically large population sizes in insect swarms.J R Soc Interface. 2014 Oct 6;11(99):20140710. doi: 10.1098/rsif.2014.0710. J R Soc Interface. 2014. PMID: 25121646 Free PMC article.
-
Searching for effective forces in laboratory insect swarms.Sci Rep. 2014 Apr 23;4:4766. doi: 10.1038/srep04766. Sci Rep. 2014. PMID: 24755944 Free PMC article.
-
Mechanical spectroscopy of insect swarms.Sci Adv. 2019 Jul 10;5(7):eaaw9305. doi: 10.1126/sciadv.aaw9305. eCollection 2019 Jul. Sci Adv. 2019. PMID: 31501772 Free PMC article.
-
Understanding the thermodynamic properties of insect swarms.Sci Rep. 2021 Jul 22;11(1):14979. doi: 10.1038/s41598-021-94582-x. Sci Rep. 2021. PMID: 34294865 Free PMC article.
-
Dynamical aspects of animal grouping: swarms, schools, flocks, and herds.Adv Biophys. 1986;22:1-94. doi: 10.1016/0065-227x(86)90003-1. Adv Biophys. 1986. PMID: 3551519 Review.
Cited by
-
Simulating Flying Insects Using Dynamics and Data-Driven Noise Modeling to Generate Diverse Collective Behaviors.PLoS One. 2016 May 17;11(5):e0155698. doi: 10.1371/journal.pone.0155698. eCollection 2016. PLoS One. 2016. PMID: 27187068 Free PMC article.
-
Estimating Orientation of Flying Fruit Flies.PLoS One. 2015 Jul 14;10(7):e0132101. doi: 10.1371/journal.pone.0132101. eCollection 2015. PLoS One. 2015. PMID: 26173128 Free PMC article.
-
Determining asymptotically large population sizes in insect swarms.J R Soc Interface. 2014 Oct 6;11(99):20140710. doi: 10.1098/rsif.2014.0710. J R Soc Interface. 2014. PMID: 25121646 Free PMC article.
-
Unsupervised Bayesian Ising Approximation for decoding neural activity and other biological dictionaries.Elife. 2022 Mar 22;11:e68192. doi: 10.7554/eLife.68192. Elife. 2022. PMID: 35315769 Free PMC article.
-
Symmetry-breaking phase transitions in highly concentrated semen.J R Soc Interface. 2016 Oct;13(123):20160575. doi: 10.1098/rsif.2016.0575. J R Soc Interface. 2016. PMID: 27733694 Free PMC article.
References
-
- Cisneros L. H., Kessler J. O., Ganguly S. & Goldstein R. E. Dynamics of swimming bacteria: Transition to directional order at high concentration. Phys. Rev. E 83(6), 061907 (2011). - PubMed
-
- Chen X., Dong X., Be'er A., Swinney H. L. & Zhang H. P. Scale-invariant correlations in dynamic bacterial clusters. Phys. Rev. Lett. 108, 148101 (2012). - PubMed
-
- Buhl J., Sumpter D. J. T., Couzin I. D., Hale J. J., Despland E., Miller E. R. & Simpson S. J. From disorder to order in marching locusts. Science 312, 1402–1406 (2006). - PubMed
-
- Cavagna A., Giardina I., Orlandi A., Parisi G., Procaccini A., Viale M. & Zdravkovic V. The STARFLAG handbook on collective animal behaviour: 1. Empirical methods. Anim. Behav. 76, 217–236 (2008).
Publication types
MeSH terms
LinkOut - more resources
Full Text Sources
Other Literature Sources
