. 2013 Jan 16:14:5.
doi: 10.1186/1471-2105-14-5.

Random generalized linear model: a highly accurate and interpretable ensemble predictor

Affiliations

Random generalized linear model: a highly accurate and interpretable ensemble predictor

Lin Song et al. BMC Bioinformatics. .

Abstract

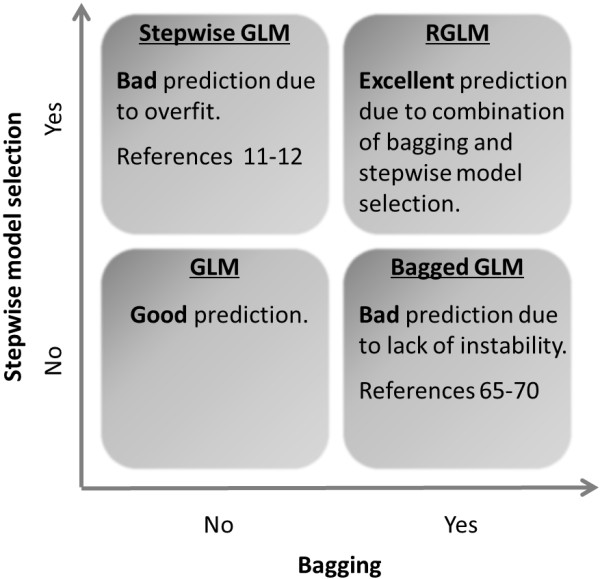
Background: Ensemble predictors such as the random forest are known to have superior accuracy but their black-box predictions are difficult to interpret. In contrast, a generalized linear model (GLM) is very interpretable especially when forward feature selection is used to construct the model. However, forward feature selection tends to overfit the data and leads to low predictive accuracy. Therefore, it remains an important research goal to combine the advantages of ensemble predictors (high accuracy) with the advantages of forward regression modeling (interpretability). To address this goal several articles have explored GLM based ensemble predictors. Since limited evaluations suggested that these ensemble predictors were less accurate than alternative predictors, they have found little attention in the literature.

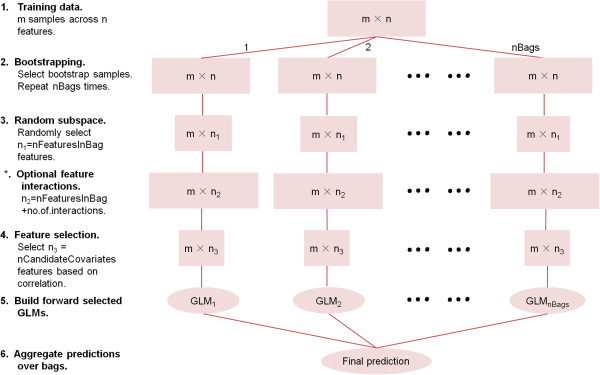
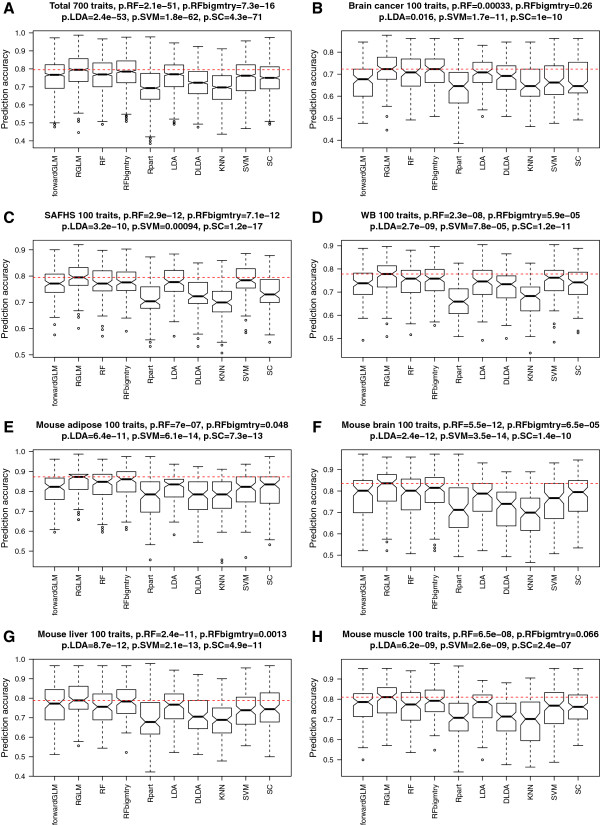
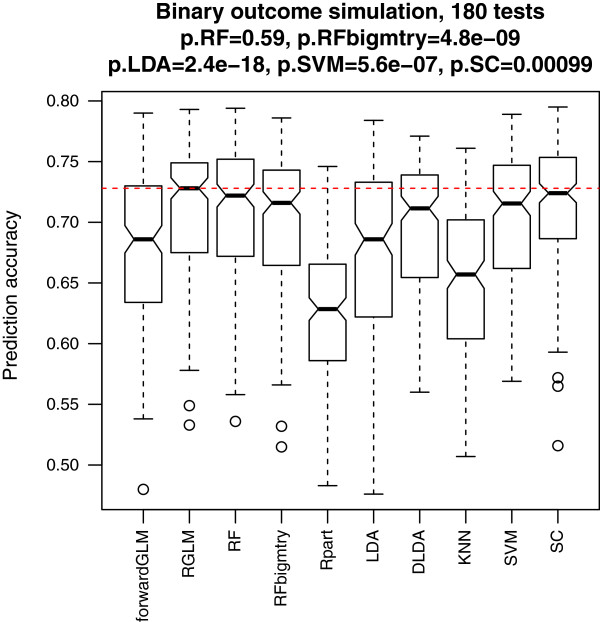
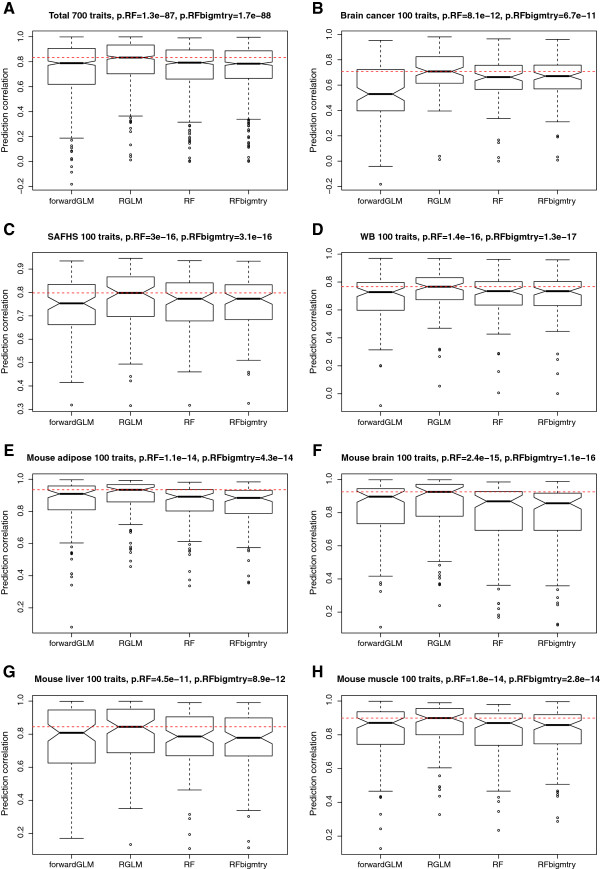
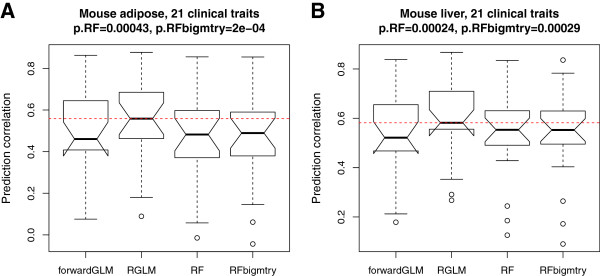
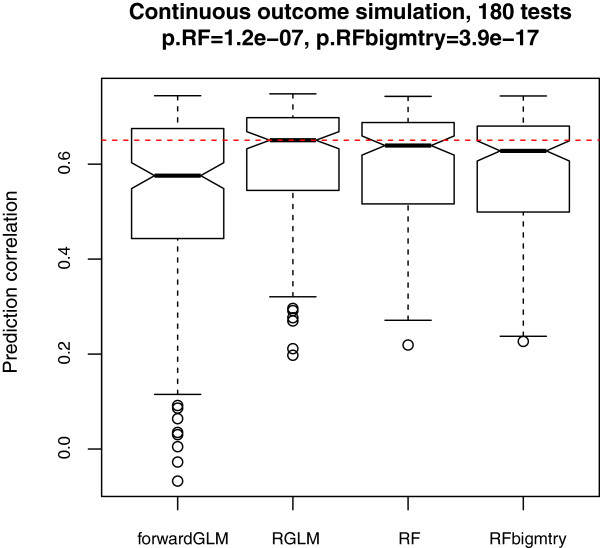
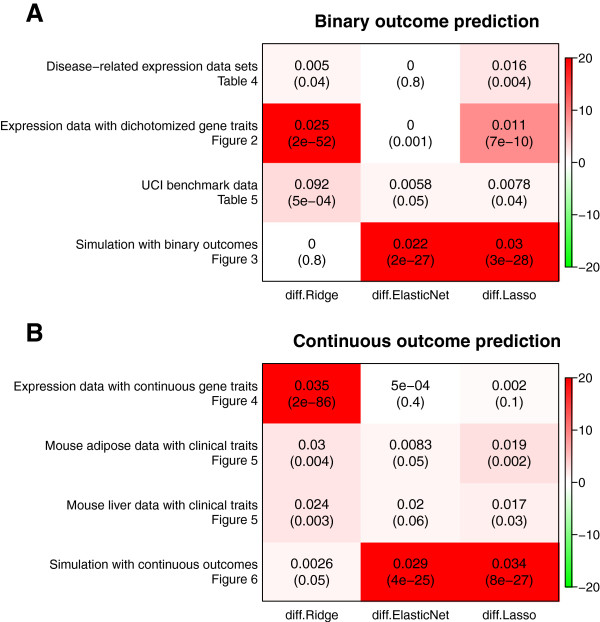
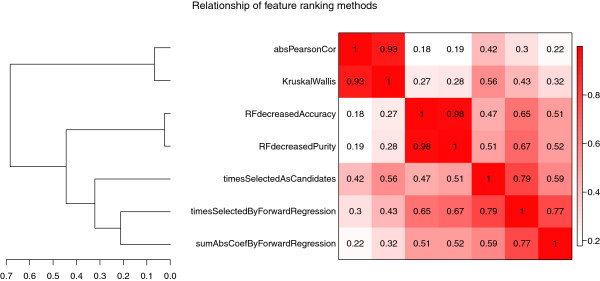
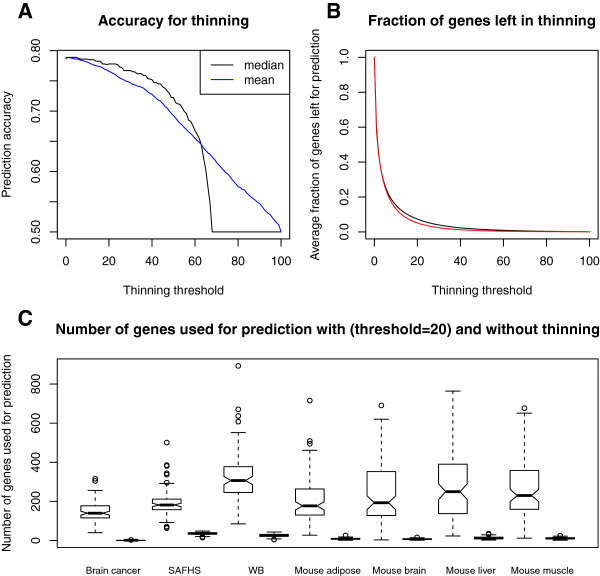
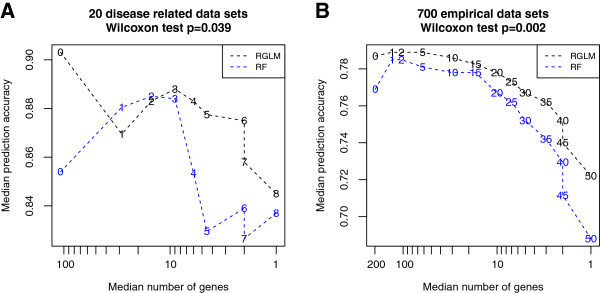
Results: Comprehensive evaluations involving hundreds of genomic data sets, the UCI machine learning benchmark data, and simulations are used to give GLM based ensemble predictors a new and careful look. A novel bootstrap aggregated (bagged) GLM predictor that incorporates several elements of randomness and instability (random subspace method, optional interaction terms, forward variable selection) often outperforms a host of alternative prediction methods including random forests and penalized regression models (ridge regression, elastic net, lasso). This random generalized linear model (RGLM) predictor provides variable importance measures that can be used to define a "thinned" ensemble predictor (involving few features) that retains excellent predictive accuracy.

Conclusion: RGLM is a state of the art predictor that shares the advantages of a random forest (excellent predictive accuracy, feature importance measures, out-of-bag estimates of accuracy) with those of a forward selected generalized linear model (interpretability). These methods are implemented in the freely available R software package randomGLM.


Figures

Figure 1
Figure 1
Overview of the RGLM construction. The figure outlines the steps used in the construction of the RGLM. The pink rectangles represent data matrices at each step. Width of a rectangle reflects the number of remaining features.
Figure 2
Figure 2
Binary outcome prediction in empirical gene expression data sets. The boxplots show the test set prediction accuracies across 700 comparisons. The horizontal line inside each box represents the median accuracy. The horizontal dashed red line indicates the median accuracy of the RGLM predictor. P-values result from using the two-sided Wilcoxon signed rank test for evaluating whether the median accuracy of RGLM is the same as that of the mentioned method. For example, p.RF results from testing whether the median accuracy of RGLM is the same as that of the RF. (A) summarizes the test set performance for predicting 100 dichotomized gene traits from each of the 7 expression data sets. (B-H) show the results for individual data sets. 100 randomly chosen, dichotomized gene traits were used. Note the superior accuracy of the RGLM predictor across the different data sets.
Figure 3
Figure 3
Binary outcome prediction in simulation. This boxplot shows the test set prediction accuracies across the 180 simulation scenarios.The red dashed line indicates the median accuracy of the RGLM. P-values result from using the two-sided Wilcoxon signed rank test for evaluating whether the median accuracy of RGLM is the same as that of the mentioned method.
Figure 4
Figure 4
Continuous outcome prediction in empirical gene expression data sets. The boxplots show the test set prediction correlation in 700 applications. P-values result from using the two-sided Wilcoxon signed rank test for evaluating whether the median accuracy of RGLM is the same as that of the mentioned method. (A) summarizes the test set performance for predicting 100 continuous gene traits from each of the 7 expression data set. (B-H) show the results for individual data sets. RGLM is superior to other methods overall.
Figure 5
Figure 5
Continuous clinical outcome prediction in mouse adipose and liver data sets. The boxplots show the test set prediction correlation for predicting 21 clinical outcomes in (A) mouse adipose and (B) mouse liver. The red dashed line indicates the median correlation for RGLM. P-values result from using the two-sided Wilcoxon signed rank test for evaluating whether the median accuracy of RGLM is the same as that of the mentioned method.
Figure 6
Figure 6
Continuous outcome prediction in simulation studies. This boxplot shows the test set prediction accuracy across the 180 simulation scenarios. The red dashed line indicates the median accuracy for the RGLM. Wilcoxon signed rank test p-values are presented.
Figure 7
Figure 7
Penalized regression models versus RGLM. The heatmap reports the median difference in accuracy between RGLM and 3 types of penalized regression models in (A) binary outcome prediction and (B) continuous outcome prediction. Each cell entry reports the paired median difference in accuracy (upper number) and the corresponding Wilcoxon signed rank test p-value (lower number). The cell color indicates the significance of the finding, where red implies that RGLM outperforms penalized regression model and green implies the opposite. The color panel on the right side shows how colors correspond to −log10(p-values). diff.Ridge =median(RGLM.accuracyRidgeRegression.accuracy). diff.ElasticNet =median(RGLM.accuracyElasticNet.accuracy). diff.Lasso =median(RGLM.accuracyLasso.accuracy).
Figure 8
Figure 8
Relationship between variable importance measures based on the Pearson correlation across 70 tests. This figure shows the hierarchical cluster tree (dendrogram) of 7 variable importance measures. absPearsonCor is the absolute Pearson correlation between each gene and the dichotomous trait. KruskalWallis stands for the −log10 p-value of the Kruskal-Wallis group comparison test (which evaluates whether the gene is differentially expressed between the two groups defined by the binary trait). RFdecreasedAccuracy and RFdecreasedPurity are variable importance measures of the RF. timesSelectedAsCandidates, timesSelectedByForwardRegression and sumAbsCoefByForwardRegression are RGLM measures. These measures are evaluated in 10 tests from each of the 7 empirical expression data sets. In every test, different measures independently score genes for their relationship with a specific dichotomized gene trait. A Pearson correlation matrix was calculated by correlating the scores of different variable importance methods. Matrices across the 70 tests were averaged and the result was transformed to a dissimilarity measure that was subsequently used as input of hierarchical clustering.
Figure 9
Figure 9
RGLM predictor thinning. This figure averages the thinning results of 700 applications (predicting 100 gene traits from each of 7 empirical data set). (A) Accuracies decrease as the thinning threshold increases. The black and blue lines represent the median and mean accuracies, respectively. (B) The average fraction of genes left in final models (y-axis) drops quickly as the thinning threshold increases as shown in the black line. The function in Equation 1 approximates the relationship between the two variables as shown in the red line. (C) Number of genes used in prediction for no thinning versus thinning threshold equal to 20. On average, less than 20% of genes remain.
Figure 10
Figure 10
RGLM thinning versus RF thinning. This figure compares the thinned RGLM with the thinned RF in (A) the 20 disease related data sets and (B) the 700 gene expression traits. Numbers that connect dashed lines are RGLM thinning thresholds. For a pre-specified threshold, the number of features used for a thinned random forest is matched with that for the thinned RGLM (except for a threshold of 0). The xaxis (log-scaled) and the yaxis report the median number of genes left for prediction and the median accuracy across data sets, respectively. The Wilcoxon signed rank test was used to test whether the median accuracy of the thinned RGLM equals that of the thinned RF. Note that the thinned RGLM consistently yields higher accuracies than the thinned RF (according to the 2-sided test p-values).
Figure 11
Figure 11
How do modifications of a GLM affect the prediction accuracy. The figure illustrates how two bad modifications to a GLM add up to a superior predictor (RGLM). In general, bagging or forward model selection alone lower the prediction accuracy of generalized linear models (such as logistic regression models). However, combining these two bad modifications leads to the superior prediction accuracy of the RGLM predictor. The figure may also explain why the benefits of RGLM type predictors were not previously recognized.

References

    1. Pinsky P, Zhu C. Building multi-marker algorithms for diesease prediction: the role of correlations among markers. Biomarker insights. 2011;6:83–93. - PMC - PubMed
    1. Vapnik V. The nature of statistical learning theory. New York: Springer; 2000.
    1. Breiman L, Friedman J, Stone C, Olshen R. Classification and regression trees. California: Wadsworth International Group; 1984.
    1. Dudoit S, Fridlyand J, Speed TP. Comparison of discrimination methods for the classification of tumors using gene expression data. J Am Stat Assoc. 2002;97(457):77–87. doi: 10.1198/016214502753479248. - DOI
    1. Diaz-Uriarte R, Alvarez de AndresS. Gene selection and classification of microarray data using random forest. BMC Bioinformatics. 2006;7:3. doi: 10.1186/1471-2105-7-3. [ http://www.biomedcentral.com/1471-2105/7/3] - DOI - PMC - PubMed

Publication types