. 2013 Jan 16:14:9.
doi: 10.1186/1471-2105-14-9.

MotifLab: a tools and data integration workbench for motif discovery and regulatory sequence analysis

Affiliations

MotifLab: a tools and data integration workbench for motif discovery and regulatory sequence analysis

Kjetil Klepper et al. BMC Bioinformatics. .

Abstract

Background: Traditional methods for computational motif discovery often suffer from poor performance. In particular, methods that search for sequence matches to known binding motifs tend to predict many non-functional binding sites because they fail to take into consideration the biological state of the cell. In recent years, genome-wide studies have generated a lot of data that has the potential to improve our ability to identify functional motifs and binding sites, such as information about chromatin accessibility and epigenetic states in different cell types. However, it is not always trivial to make use of this data in combination with existing motif discovery tools, especially for researchers who are not skilled in bioinformatics programming.

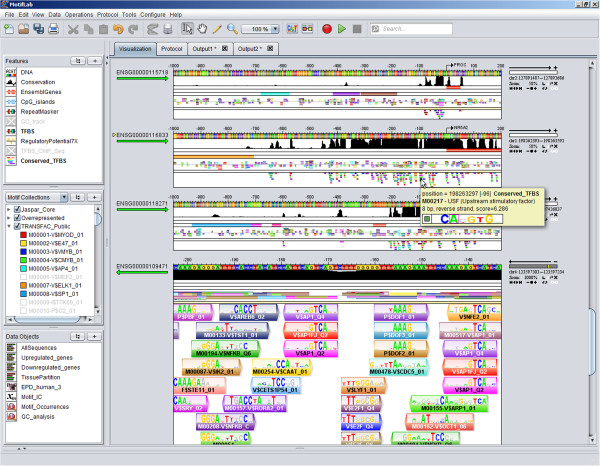
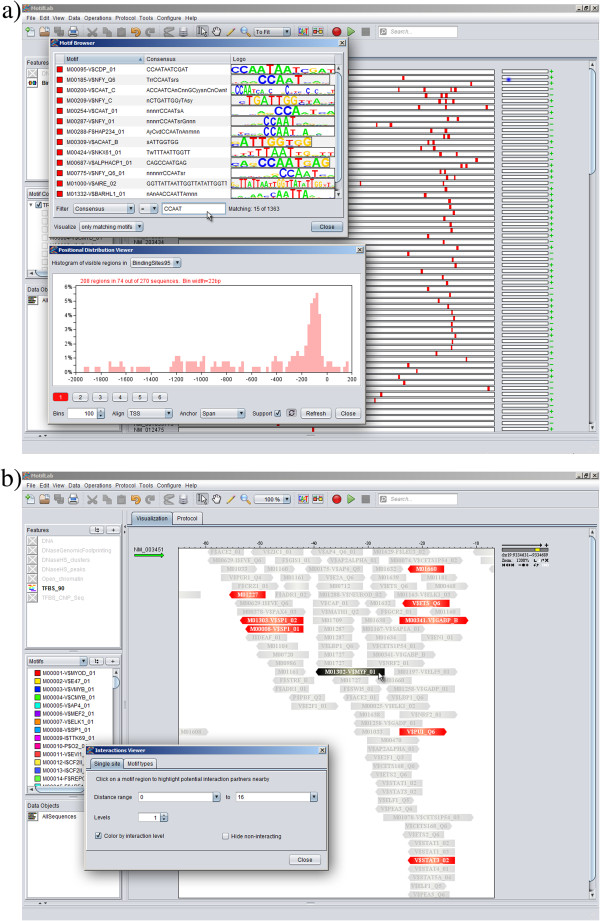
Results: Here we present MotifLab, a general workbench for analysing regulatory sequence regions and discovering transcription factor binding sites and cis-regulatory modules. MotifLab supports comprehensive motif discovery and analysis by allowing users to integrate several popular motif discovery tools as well as different kinds of additional information, including phylogenetic conservation, epigenetic marks, DNase hypersensitive sites, ChIP-Seq data, positional binding preferences of transcription factors, transcription factor interactions and gene expression. MotifLab offers several data-processing operations that can be used to create, manipulate and analyse data objects, and complete analysis workflows can be constructed and automatically executed within MotifLab, including graphical presentation of the results.

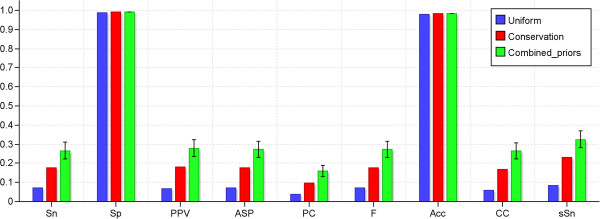
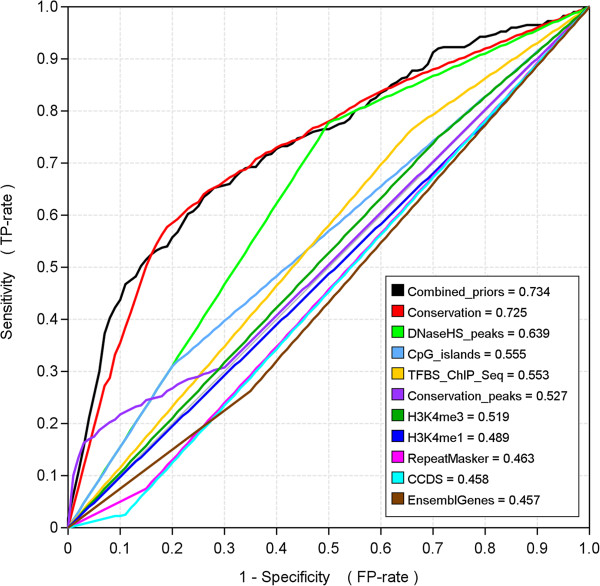
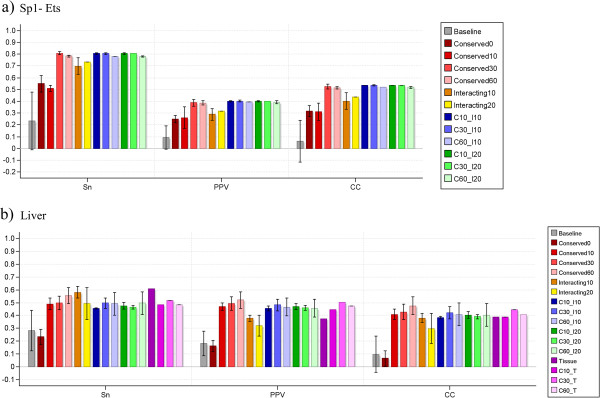
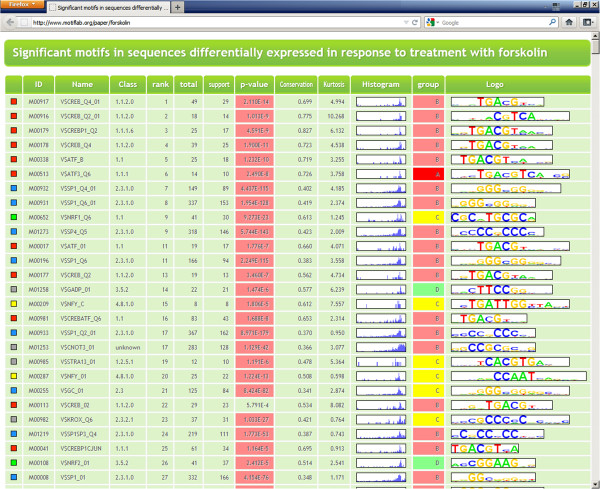
Conclusions: We have developed MotifLab as a flexible workbench for motif analysis in a genomic context. The flexibility and effectiveness of this workbench has been demonstrated on selected test cases, in particular two previously published benchmark data sets for single motifs and modules, and a realistic example of genes responding to treatment with forskolin. MotifLab is freely available at http://www.motiflab.org.


Figures

Figure 1
Figure 1
MotifLab’s graphical user interface. The screenshot shows MotifLab’s graphical user interface with three data panels to the left and with the sequence browser to the right taking up most of the screen space. The top data panel contains the feature datasets in the order they are visualized as tracks in the sequence browser, the middle data panel contains the motifs and modules, and the bottom panel contains miscellaneous data objects that to not belong in the first two panels. Features and motifs that are greyed out in the data panels are hidden from view in the sequence browser. The bottommost sequence shows a motif track in “close-up mode” which is activated at zoom-levels above 1000%. The binding sites are shown with superimposed “match logos” where the base matching the DNA sequence in that position is shown in colour and the other three bases are greyed out.
Figure 2
Figure 2
Examples of interactive tools. a) The Motif Browser tool (top dialog box) has here been used to search for TRANSFAC motifs containing the consensus sequence “CCAAT” (both orientations). The corresponding binding site predictions for the 15 motifs matching this criterion are shown as red boxes in the sequence browser partly visible in the background. The Positional Distribution Viewer tool (bottom dialog box) shows a histogram of the locations of these binding sites, and the prominent peak indicates that the majority of the sites are located within 200 bp upstream of the TSS. b) The Interactions Viewer tool. A part of a motif track is shown in close-up mode at 1200% scale (binding sites are displayed here without motif logos). The black binding site in the middle is the target site selected by the user and the red sites on either side have been highlighted by MotifLab as binding sites for transcription factors that are known to interact with the target factor(s) from other locations. All other binding sites are greyed out.
Figure 3
Figure 3
Results from example 1 – Single motif discovery benchmark. The figure shows the performance of MEME on the single motif discovery benchmark when guided respectively by a uniform positional priors track, a priors track based only on conservation, and a combined priors track made by automatically integrating information from several features with the use of a Priors Generator. The statistics were calculated by combining all sequences from the 22 datasets into one large dataset and measuring the overlap between the predicted binding sites and the target sites. The first eight statistics are nucleotide-level statistics whereas the last statistic is the site-level sensitivity (number of predicted sites overlapping with at least 25% of a target site). Due to the stochastic nature of the algorithm used to train the Priors Generator, the combined priors track could vary slightly depending on the training. We therefore trained 20 different Priors Generators and ran MEME with priors tracks generated by each of them. The bars show the average scores with standard deviations over the 20 runs.
Figure 4
Figure 4
Predictive capabilities of individual features. These ROC-curves illustrate the ability of both the auto-generated combined priors and the 10 individual features the combined priors were based on to discriminate between sequence positions that are part of binding sites or part of the background sequence. The numbers in the legend box are the area under the curve (AUC) values for each feature.
Figure 5
Figure 5
Results from example 2 – Module discovery benchmark. This figure shows the nucleotide-level performance of ModuleSearcher on two of the datasets from the module discovery benchmark. Since ModuleSearcher is based on a non-deterministic algorithm, we ran it 10 times on each dataset. The bars show the average scores with standard deviations. The “baseline” scores reflect the performance when no pre-processing was performed to filter candidate binding sites, and the other scores are for different filtering criteria and combinations thereof. “C10_I10” means that the sites were filtered according to both the “Conservation10” and “Interacting10” criteria etc. a) The “Sp1-Ets” dataset was one of the hardest in the original benchmark, but filtering sites based on either conservation or potential interacting sites nearby significantly improves the performance of ModuleSearcher on this dataset. b) For the “liver” dataset we also filtered binding sites for motifs that were not known to be expressed in liver (“Tissue”) and combined this criterion with different requirements on conservation level (“C10_T” etc.).
Figure 6
Figure 6
Results from example 3 – Genes responding to forskolin treatment. Results from the forskolin-analysis output in HTML format. The table is a combination of results from four different analyses performed in MotifLab. The “total”, “support” and “p-value” columns are from an analysis that counts the number of times each motif occurs in the sequences and estimates the significance of overrepresentation (significant p-values are highlighted in red). The “conservation” column is the average score taken from an analysis that compares the binding sites for each motif to a selected numeric feature (here conservation). The “kurtosis” and “histogram” columns are from an analysis of the positional distribution of the binding sites for each motif. The “group” column is from an analysis that compares the number of binding sites for each motif within sequences from two different groups to see if some motifs are overrepresented in one group compared to the other. Here we compared the group of upregulated genes to the downregulated genes. Motifs in the “A” and “B” groups (in red) were significantly overrepresented in the upregulated sequences whereas motifs in the “D” group (in green) were overrepresented in the downregulated sequences. Motifs in the “C” group (yellow) occurred at approximately the same rates in both groups. The table is sorted according to the combined ranks of p-values (ascending), conservation (descending) and kurtosis (descending). Note that almost all top ranking motifs are preferentially located within a narrow region upstream of the TSS, as indicated by the sharp peaks in the histograms around this position. Motif types are colour coded in the left-most column (CREB/ATF motifs with boxes in red, SP1 in blue, NF-Y in yellow, nuclear respiratory factors in green, others in grey).

Similar articles

Cited by

References

    1. Wasserman WW, Sandelin A. Applied bioinformatics for the identification of regulatory elements. Nat Rev Genet. 2004;5:276–287. doi: 10.1038/nrg1315. - DOI - PubMed
    1. Tompa M, Li N, Bailey TL, Church GM, De Moor B, Eskin E, Favorov AV, Frith MC, Fu Y, Kent WJ. et al.Assessing computational tools for the discovery of transcription factor binding sites. Nat Biotechnol. 2005;23:137–144. doi: 10.1038/nbt1053. - DOI - PubMed
    1. Okumura T, Makiguchi H, Makita Y, Yamashita R, Nakai K. Melina II: a web tool for comparisons among several predictive algorithms to find potential motifs from promoter regions. Nucleic Acids Res. 2007;35:W227–W231. doi: 10.1093/nar/gkm362. - DOI - PMC - PubMed
    1. Sun H, Yuan Y, Wu Y, Liu H, Liu JS, Xie H. Tmod: toolbox of motif discovery. Bioinformatics. 2010;26:405–407. doi: 10.1093/bioinformatics/btp681. - DOI - PMC - PubMed
    1. Hu J, Yang YD, Kihara D. EMD: an ensemble algorithm for discovering regulatory motifs in DNA sequences. BMC Bioinforma. 2006;7:342. doi: 10.1186/1471-2105-7-342. - DOI - PMC - PubMed

Publication types