. 2013 Jan 16:14:15.
doi: 10.1186/1471-2105-14-15.

xMSanalyzer: automated pipeline for improved feature detection and downstream analysis of large-scale, non-targeted metabolomics data

Affiliations

xMSanalyzer: automated pipeline for improved feature detection and downstream analysis of large-scale, non-targeted metabolomics data

Karan Uppal et al. BMC Bioinformatics. .

Abstract

Background: Detection of low abundance metabolites is important for de novo mapping of metabolic pathways related to diet, microbiome or environmental exposures. Multiple algorithms are available to extract m/z features from liquid chromatography-mass spectral data in a conservative manner, which tends to preclude detection of low abundance chemicals and chemicals found in small subsets of samples. The present study provides software to enhance such algorithms for feature detection, quality assessment, and annotation.

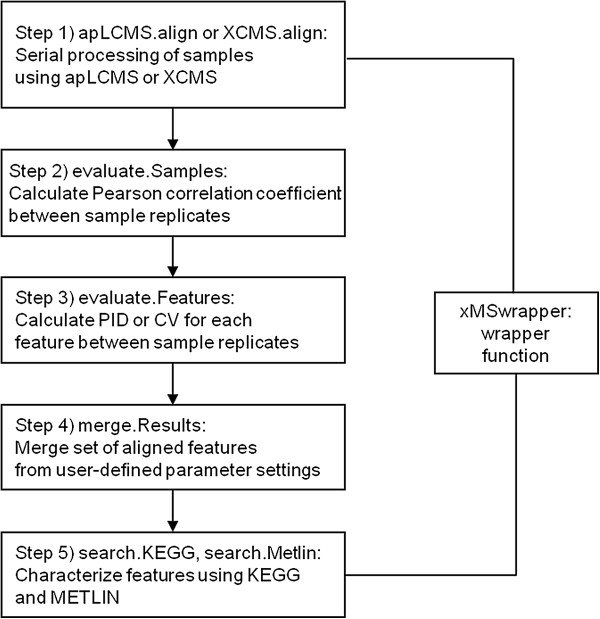
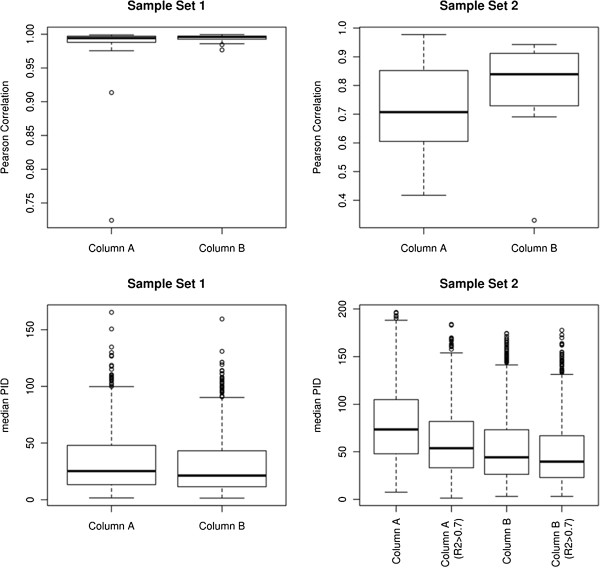
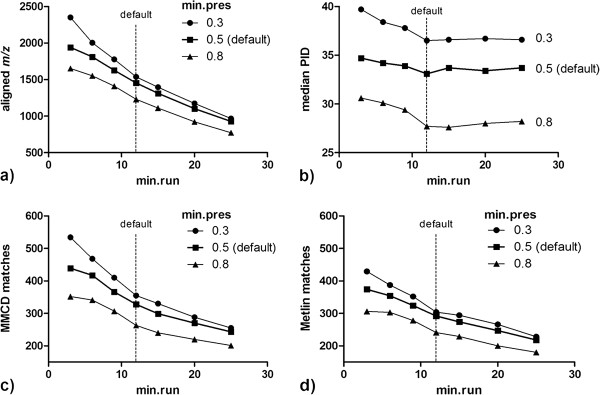
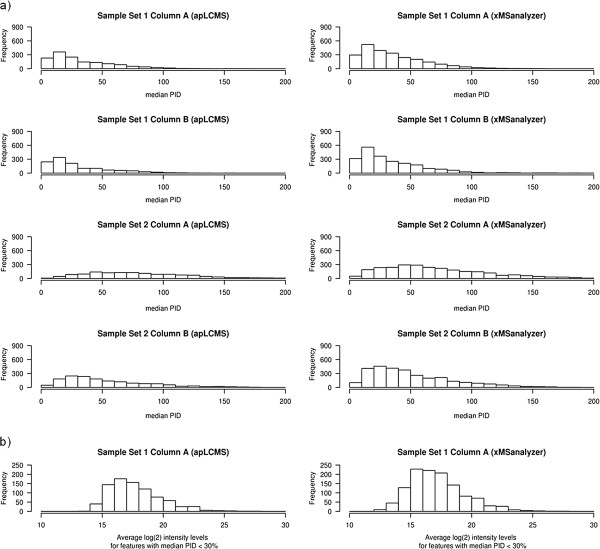
Results: xMSanalyzer is a set of utilities for automated processing of metabolomics data. The utilites can be classified into four main modules to: 1) improve feature detection for replicate analyses by systematic re-extraction with multiple parameter settings and data merger to optimize the balance between sensitivity and reliability, 2) evaluate sample quality and feature consistency, 3) detect feature overlap between datasets, and 4) characterize high-resolution m/z matches to small molecule metabolites and biological pathways using multiple chemical databases. The package was tested with plasma samples and shown to more than double the number of features extracted while improving quantitative reliability of detection. MS/MS analysis of a random subset of peaks that were exclusively detected using xMSanalyzer confirmed that the optimization scheme improves detection of real metabolites.

Conclusions: xMSanalyzer is a package of utilities for data extraction, quality control assessment, detection of overlapping and unique metabolites in multiple datasets, and batch annotation of metabolites. The program was designed to integrate with existing packages such as apLCMS and XCMS, but the framework can also be used to enhance data extraction for other LC/MS data software.


Figures

Figure 1
Figure 1
xMSwrapper workflow.
Figure 2
Figure 2
Quantitative evaluation of LC/MS profile alignment using apLCMS. Top row shows Pearson correlation within sample duplicates in both datasets; bottom row shows the median PID of feature intensities within sample duplicates. The effect of re-aligning profiles after removing poor quality samples (correlation coefficient, R2 < 0.7) on the quantitative reproducibility of features is shown in the bottom right panel. A noticeable difference in median PID can be seen between alignment using all samples and alignment using only high quality samples for both columns of Sample Set 2.
Figure 3
Figure 3
Variation in stringency for feature detection in sample analyses. Using apLCMS, min.run was varied from 25, 20, 15, 12, 9, 6, 3 (panel a); min.pres was varied from 0.3, 0.5, 0.8 (panel b); and m/z were matched to Madison Metabolomics Consortium Database (MMCD) (panel c) and Metlin database (panel d) for Column A from Sample Set 1 at 5 and 10 ppm mass tolerance. Results at 10 ppm tolerance level are shown here.
Figure 4
Figure 4
xMSanalyzer improves the sensitivity of feature detection without compromising data quality. a) Histograms showing number of peaks with ranges of percent intensity differences (PID) for LC/MS profile alignments using apLCMS (left) and xMSanalyzer (right). The results show that the xMSanalyzer routine allows detection of more quantitatively reproducible features; b) Histograms showing the average log2 intensity levels in features with median PID less than 30% detected using apLCMS (left) and xMSanalyzer (right) in Sample Set 2, Column A. xMSanalyzer not only improves the overall quantitative reproducibility of features, but also allows detection of reliable low abundance features.

Similar articles

Cited by

References

    1. Zhang H, Wang Y, Gu X, Zhou J, Yan C. Metabolomic profiling of human plasma in pancreatic cancer using pressurized capillary electrochromatography. Electrophoresis. 2011;32(3–4):340–347. - PubMed
    1. Dettmer K, Aronov PA, Hammock BD. Mass spectrometry-based metabolomics. Mass Spectrom Rev. 2007;26(1):51–78. doi: 10.1002/mas.20108. - DOI - PMC - PubMed
    1. Nobeli I, Thornton JM. A bioinformatician’s view of the metabolome. Bioessays. 2006;28(5):534–545. doi: 10.1002/bies.20414. - DOI - PubMed
    1. Johnson JM, Strobel FH, Reed M, Pohl J, Jones DP. A rapid LC-FTMS method for the analysis of cysteine, cystine and cysteine/cystine steady-state redox potential in human plasma. Clin Chim Acta. 2008;396(1–2):43–48. - PMC - PubMed
    1. Podwojski K, Fritsch A, Chamrad DC, Paul W, Sitek B, Stuhler K, Mutzel P, Stephan C, Meyer HE, Urfer W. et al.Retention time alignment algorithms for LC/MS data must consider non-linear shifts. Bioinformatics. 2009;25(6):758–764. doi: 10.1093/bioinformatics/btp052. - DOI - PubMed

Publication types