

Integrative pathway dissection of molecular mechanisms of moxLDL-induced vascular smooth muscle phenotype transformation
- PMID: 23324130
- PMCID: PMC3556327
- DOI: 10.1186/1471-2261-13-4
Integrative pathway dissection of molecular mechanisms of moxLDL-induced vascular smooth muscle phenotype transformation
Abstract
Background: Atherosclerosis (AT) is a chronic inflammatory disease characterized by the accumulation of inflammatory cells, lipoproteins and fibrous tissue in the walls of arteries. AT is the primary cause of heart attacks and stroke and is the leading cause of death in Western countries. To date, the pathogenesis of AT is not well-defined. Studies have shown that the dedifferentiation of contractile and quiescent vascular smooth muscle cells (SMC) to the proliferative, migratory and synthetic phenotype in the intima is pivotal for the onset and progression of AT. To further delineate the mechanisms underlying the pathogenesis of AT, we analyzed the early molecular pathways and networks involved in the SMC phenotype transformation.
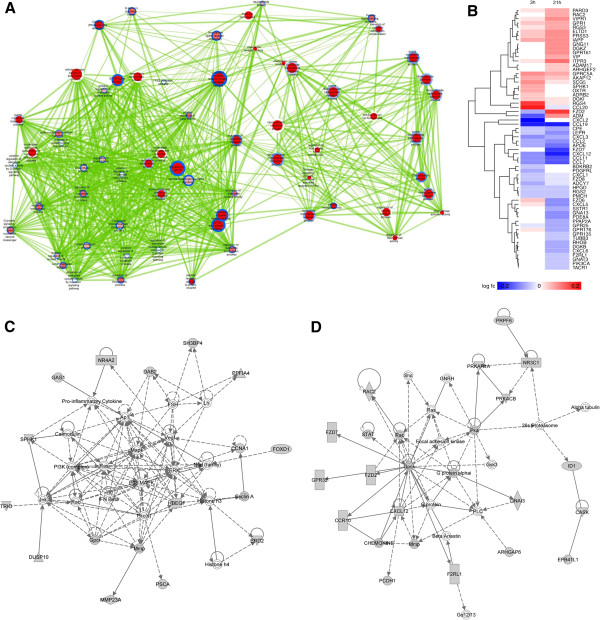
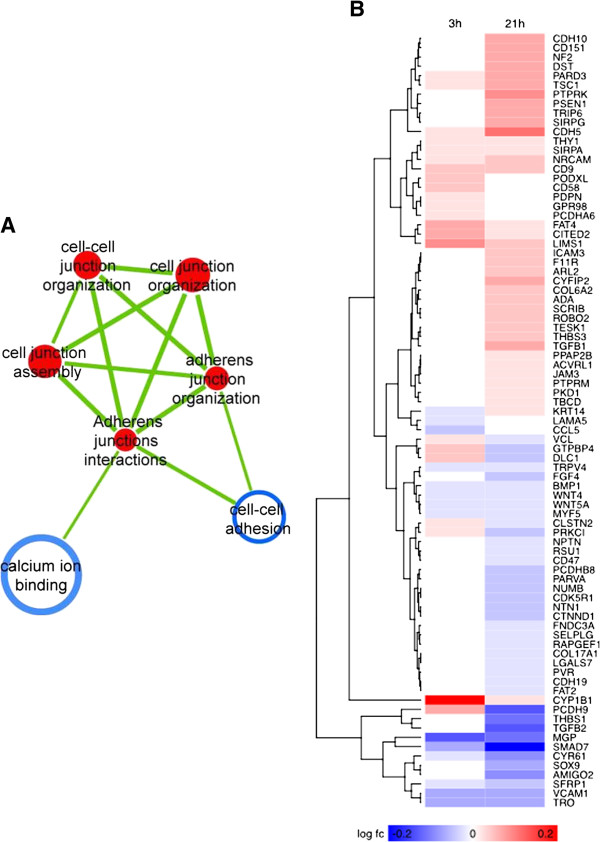
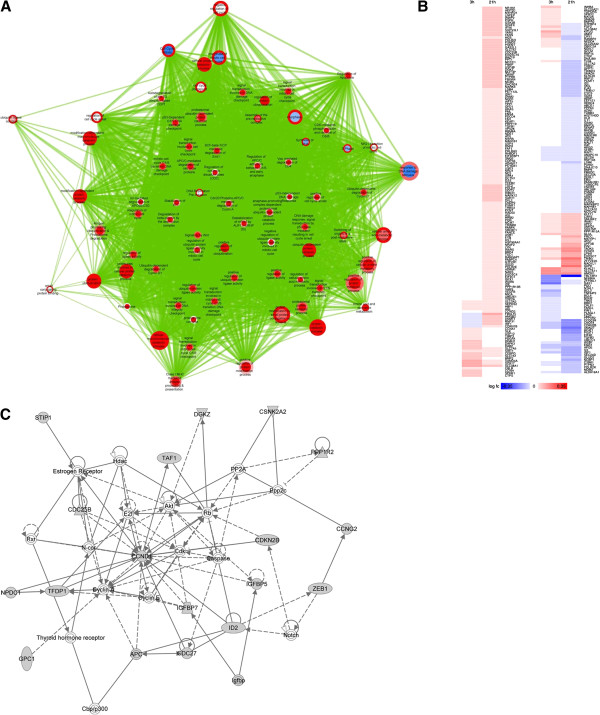
Methods: Quiescent human coronary artery SMCs were treated with minimally-oxidized LDL (moxLDL), for 3 hours and 21 hours, respectively. Transcriptomic data was generated for both time-points using microarrays and was subjected to pathway analysis using Gene Set Enrichment Analysis, GeneMANIA and Ingenuity software tools. Gene expression heat maps and pathways enriched in differentially expressed genes were compared to identify functional biological themes to elucidate early and late molecular mechanisms of moxLDL-induced SMC dedifferentiation.
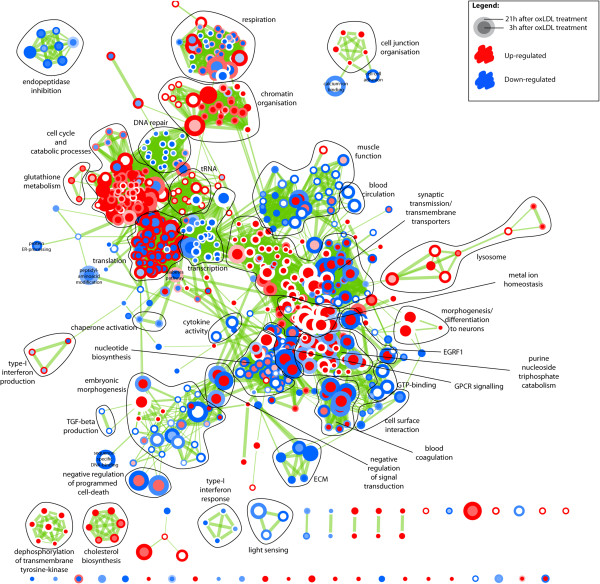
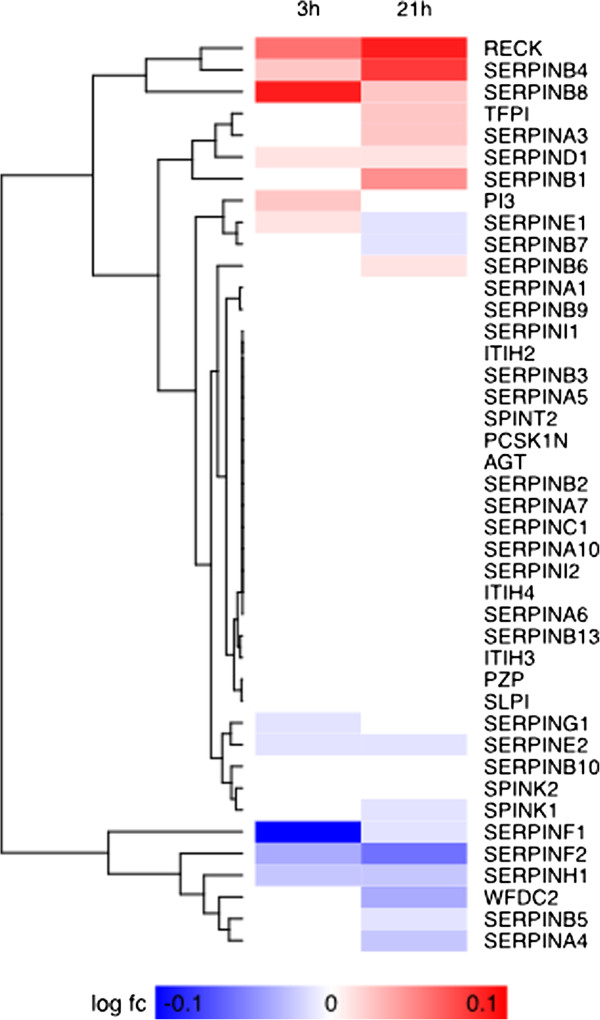
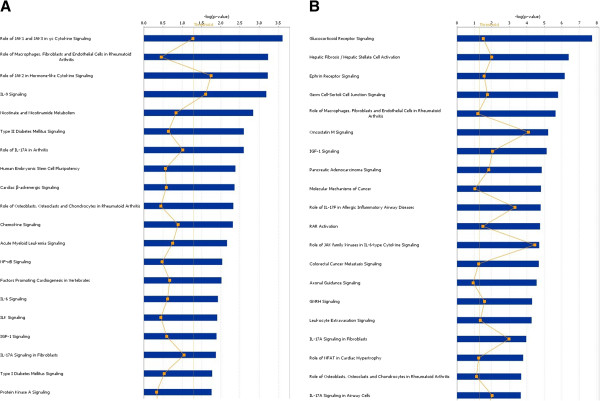
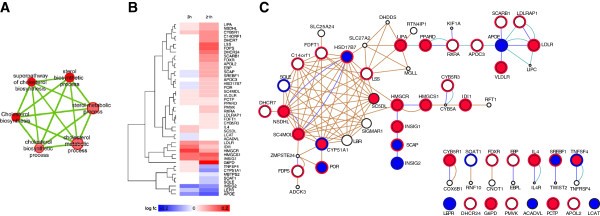
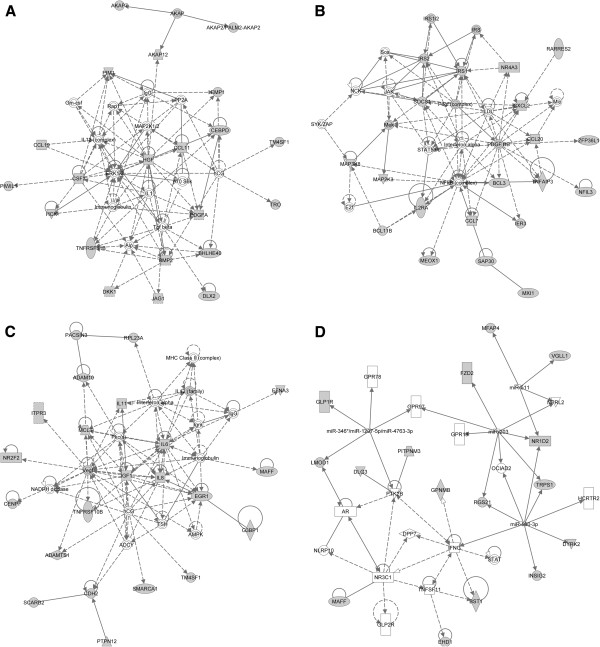
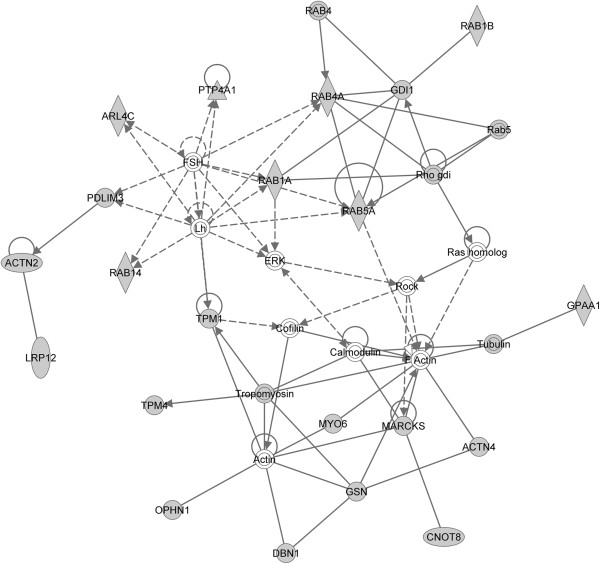
Results: Differentially expressed genes were found to be enriched in cholesterol biosynthesis, inflammatory cytokines, chemokines, growth factors, cell cycle control and myogenic contraction themes. These pathways are consistent with inflammatory responses, cell proliferation, migration and ECM production, which are characteristic of SMC dedifferentiation. Furthermore, up-regulation of cholesterol synthesis and dysregulation of cholesterol metabolism was observed in moxLDL-induced SMC. These observations are consistent with the accumulation of cholesterol and oxidized cholesterol esters, which induce proinflammatory reactions during atherogenesis. Our data implicate for the first time IL12, IFN-α, HGF, CSF3, and VEGF signaling in SMC phenotype transformation. GPCR signaling, HBP1 (repressor of cyclin D1 and CDKN1B), and ID2 and ZEB1 transcriptional regulators were also found to have important roles in SMC dedifferentiation. Several microRNAs were observed to regulate the SMC phenotype transformation via an interaction with IFN-γ pathway. Also, several "nexus" genes in complex networks, including components of the multi-subunit enzyme complex involved in the terminal stages of cholesterol synthesis, microRNAs (miR-203, miR-511, miR-590-3p, miR-346*/miR- 1207-5p/miR-4763-3p), GPCR proteins (GPR1, GPR64, GPRC5A, GPR171, GPR176, GPR32, GPR25, GPR124) and signal transduction pathways, were found to be regulated.
Conclusions: The systems biology analysis of the in vitro model of moxLDL-induced VSMC phenotype transformation was associated with the regulation of several genes not previously implicated in SMC phenotype transformation. The identification of these potential candidate genes enable hypothesis generation and in vivo functional experimentation (such as gain and loss-of-function studies) to establish causality with the process of SMC phenotype transformation and atherogenesis.
Figures
Similar articles
-
Phenotypic Modulation of Smooth Muscle Cells in Atherosclerosis Is Associated With Downregulation of LMOD1, SYNPO2, PDLIM7, PLN, and SYNM.Arterioscler Thromb Vasc Biol. 2016 Sep;36(9):1947-61. doi: 10.1161/ATVBAHA.116.307893. Epub 2016 Jul 28. Arterioscler Thromb Vasc Biol. 2016. PMID: 27470516 Free PMC article.
-
Oncological miR-182-3p, a Novel Smooth Muscle Cell Phenotype Modulator, Evidences From Model Rats and Patients.Arterioscler Thromb Vasc Biol. 2016 Jul;36(7):1386-97. doi: 10.1161/ATVBAHA.115.307412. Epub 2016 May 19. Arterioscler Thromb Vasc Biol. 2016. PMID: 27199451
-
CD8+ T Cells Drive Plaque Smooth Muscle Cell Dedifferentiation in Experimental Atherosclerosis.Arterioscler Thromb Vasc Biol. 2024 Aug;44(8):1852-1872. doi: 10.1161/ATVBAHA.123.320084. Epub 2024 Jun 13. Arterioscler Thromb Vasc Biol. 2024. PMID: 38868941
-
Pathways of smooth muscle foam cell formation in atherosclerosis.Curr Opin Lipidol. 2019 Apr;30(2):117-124. doi: 10.1097/MOL.0000000000000574. Curr Opin Lipidol. 2019. PMID: 30664015 Review.
-
Nutritional control, gene regulation, and transformation of vascular smooth muscle cells in atherosclerosis.Cardiovasc Hematol Disord Drug Targets. 2006 Sep;6(3):151-68. doi: 10.2174/187152906778249545. Cardiovasc Hematol Disord Drug Targets. 2006. PMID: 17017900 Review.
Cited by
-
Intracellular Ca2+ Dysregulation in Coronary Smooth Muscle Is Similar in Coronary Disease of Humans and Ossabaw Miniature Swine.J Cardiovasc Transl Res. 2022 Feb;15(1):167-178. doi: 10.1007/s12265-021-10153-5. Epub 2021 Jul 20. J Cardiovasc Transl Res. 2022. PMID: 34286469 Free PMC article.
-
Role of non-coding RNAs in maintaining primary airway smooth muscle cells.Respir Res. 2014 May 16;15(1):58. doi: 10.1186/1465-9921-15-58. Respir Res. 2014. PMID: 24886442 Free PMC article.
-
Galectin-3-induced oxidized low-density lipoprotein promotes the phenotypic transformation of vascular smooth muscle cells.Mol Med Rep. 2015 Oct;12(4):4995-5002. doi: 10.3892/mmr.2015.4075. Epub 2015 Jul 13. Mol Med Rep. 2015. PMID: 26165519 Free PMC article.
-
TGF-β1 induces human aortic vascular smooth muscle cell phenotype switch through PI3K/AKT/ID2 signaling.Am J Transl Res. 2015 Dec 15;7(12):2764-74. eCollection 2015. Am J Transl Res. 2015. PMID: 26885273 Free PMC article.
-
Oncogenic roles of GPR176 in breast cancer: a potential marker of aggressiveness and a potential target of gene therapy.Clin Transl Oncol. 2023 Oct;25(10):3042-3056. doi: 10.1007/s12094-023-03174-w. Epub 2023 Apr 20. Clin Transl Oncol. 2023. PMID: 37079213 Free PMC article.
References
-
- Tracy RE, Newman WP 3rd, Wattigney WA, Berenson GS. Risk factors and atherosclerosis in youth autopsy findings of the Bogalusa Heart Study. Am J Med Sci. 1995;310(Suppl 1):S37–S41. - PubMed
Publication types
MeSH terms
Substances
Grants and funding
LinkOut - more resources
Full Text Sources
Other Literature Sources
Medical
Research Materials
Miscellaneous
