Comparative Study
. 2013 Jan 16:14:32.
doi: 10.1186/1471-2164-14-32.

A RAD-based linkage map and comparative genomics in the gudgeons (genus Gnathopogon, Cyprinidae)

Affiliations
Comparative Study

A RAD-based linkage map and comparative genomics in the gudgeons (genus Gnathopogon, Cyprinidae)

Ryo Kakioka et al. BMC Genomics. .

Abstract

Background: The construction of linkage maps is a first step in exploring the genetic basis for adaptive phenotypic divergence in closely related species by quantitative trait locus (QTL) analysis. Linkage maps are also useful for comparative genomics in non-model organisms. Advances in genomics technologies make it more feasible than ever to study the genetics of adaptation in natural populations. Restriction-site associated DNA (RAD) sequencing in next-generation sequencers facilitates the development of many genetic markers and genotyping. We aimed to construct a linkage map of the gudgeons of the genus Gnathopogon (Cyprinidae) for comparative genomics with the zebrafish Danio rerio (a member of the same family as gudgeons) and for the future QTL analysis of the genetic architecture underlying adaptive phenotypic evolution of Gnathopogon.

Results: We constructed the first genetic linkage map of Gnathopogon using a 198 F2 interspecific cross between two closely related species in Japan: river-dwelling Gnathopogon elongatus and lake-dwelling Gnathopogon caerulescens. Based on 1,622 RAD-tag markers, a linkage map spanning 1,390.9 cM with 25 linkage groups and an average marker interval of 0.87 cM was constructed. We also identified a region involving female-specific transmission ratio distortion (TRD). Synteny and collinearity were extensively conserved between Gnathopogon and zebrafish.

Conclusions: The dense SNP-based linkage map presented here provides a basis for future QTL analysis. It will also be useful for transferring genomic information from a "traditional" model fish species, zebrafish, to screen candidate genes underlying ecologically important traits of the gudgeons.


Figures

Figure 1
Figure 1
A linkage map of the interspecific cross between Gnathopogon caerulescens and Gnathopogon elongatus . The bars on each linkage group represent mapped RAD-tag markers. The lengths of the linkage groups are based on Kosambi cM. A detailed map is presented in Additional file 2: Figure S1.
Figure 2
Figure 2
Linkage map, extent of deviation from Mendelian segregation, and genotype frequencies in LG3M. (A) Schematic chart of LG3M. (B) Degree of deviation from the expected 1:2:1 segregation along LG3M. The x-axis represents the position in LG3M; y-axis represents χ2-test P-values for distorted segregation. Each white dot represents female progeny; the black dots represent male progeny. The y-coordinate of female progeny is based on the homologous marker of the male linkage map. The dotted line represents α = 0.001. (C–D) Each line represents the genotype frequency of loci positioned on LG3M. AA denotes a homozygote derived from the grandmother; BB denotes a homozygote derived from the grandfather; AB denotes a heterozygote.
Figure 3
Figure 3
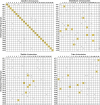
Oxford grid comparing genomes of Gnathopogon and four model fishes. Each number in a cell denotes the number of homologous pair of loci in each genome. The homologous loci were inferred from sequence similarity searches of mapped RAD-tag marker against the genome sequences of model fishes. Cells with more than one pair are highlighted in yellow.
Figure 4
Figure 4
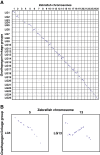
Oxford grid comparing genomes of Gnathopogon and zebrafish. Each dot represents the position of a homologous locus. The x-axis is proportional to physical length; the y-axis is proportional to Kosambi cM. (A) Genome-wide comparison of the positions of homologous loci. (B) Enlarged cells of the Oxford grid, showing extensive and disrupted collinearity of the syntenic chromosomes of Gnathopogon and zebrafish species.
Figure 5
Figure 5
Oxford grid comparing Gnathopogon linkage groups LG3 and LG3M and zebrafish chromosome 3. Each dot represents the position of a homologous locus. The x-axis is proportional to physical length; the y-axis is proportional to Kosambi cM.

Similar articles

Cited by

References

    1. Schluter D. The Ecology of Adaptive Radiation. Oxford: Oxford University Press; 2000.
    1. Ellegren H, Sheldon BC. Genetic basis of fitness differences in natural populations. Nature. 2008;452:169–175. doi: 10.1038/nature06737. - DOI - PubMed
    1. Gross JB, Protas M, Conrad M, Scheid PE, Vidal O, Jeffery WR, Borowsky R, Tabin CJ. Synteny and candidate gene prediction using an anchored linkage map of Astyanax mexicanus. Proc Natl Acad Sci USA. 2008;105:20106–20111. doi: 10.1073/pnas.0806238105. - DOI - PMC - PubMed
    1. Sarropoulou E, Fernandes JM. Comparative genomics in teleost species: Knowledge transfer by linking the genomes of model and non-model fish species. Comp Biochem Physiol Part D Genomics Proteomics. 2011;6:92–102. doi: 10.1016/j.cbd.2010.09.003. - DOI - PubMed
    1. Sarropoulou E, Nousdili D, Magoulas A, Kotoulas G. Linking the genomes of nonmodel teleosts through comparative genomics. Marine Biotechnol. 2008;10:227–233. doi: 10.1007/s10126-007-9066-5. - DOI - PubMed

Publication types

Substances