. 2013 Apr;109(7):1746-63.
doi: 10.1152/jn.00891.2012. Epub 2013 Jan 16.

Status epilepticus enhances tonic GABA currents and depolarizes GABA reversal potential in dentate fast-spiking basket cells

Affiliations

Status epilepticus enhances tonic GABA currents and depolarizes GABA reversal potential in dentate fast-spiking basket cells

Jiandong Yu et al. J Neurophysiol. 2013 Apr.

Abstract

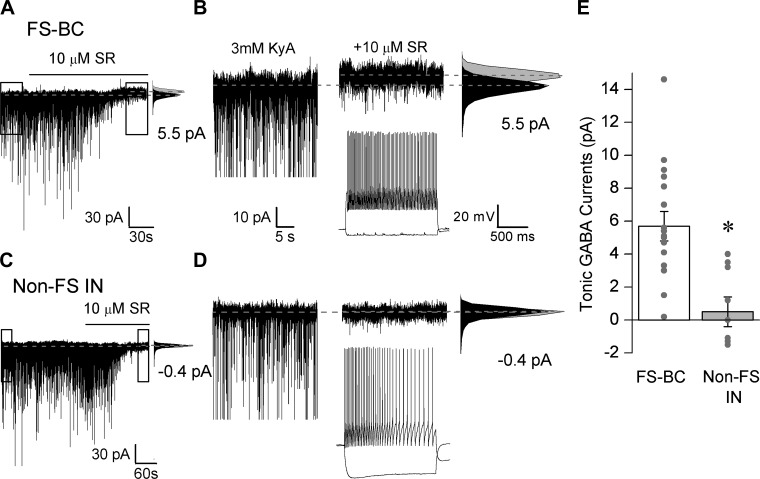
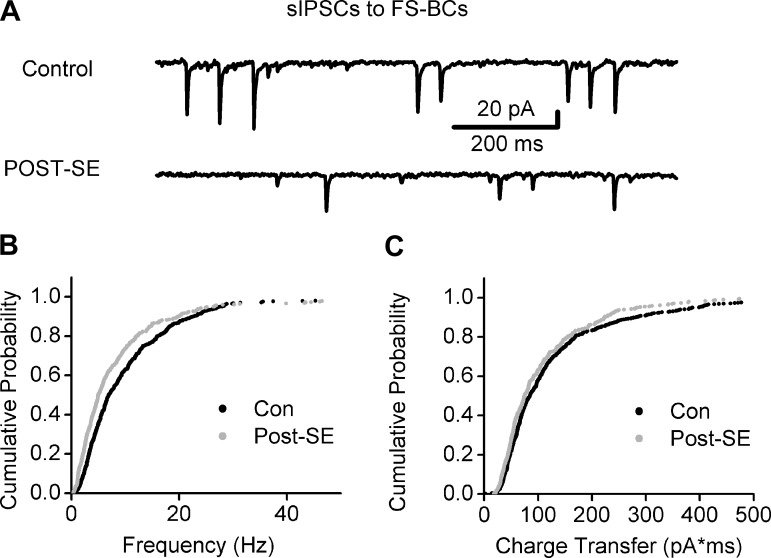
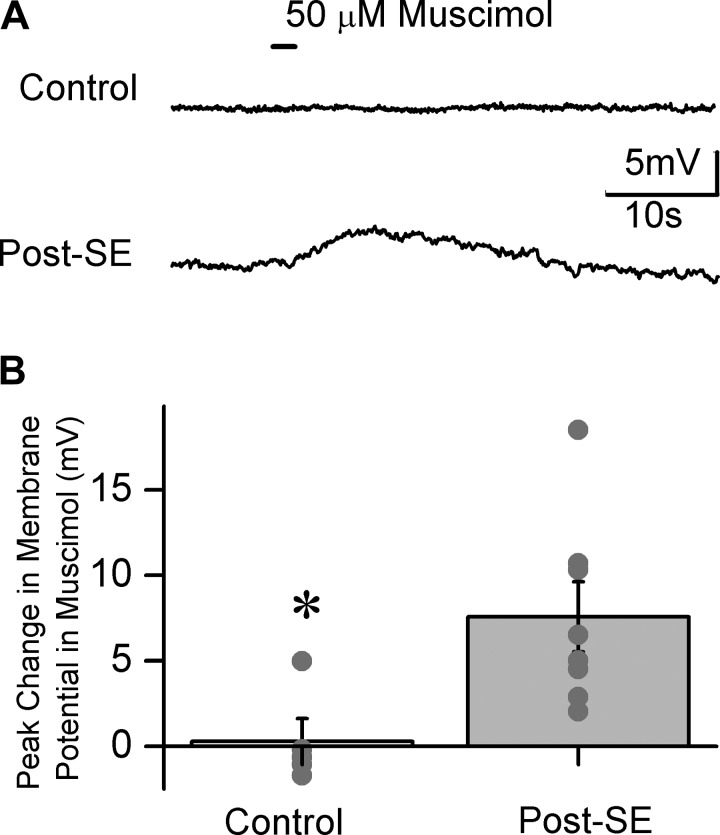
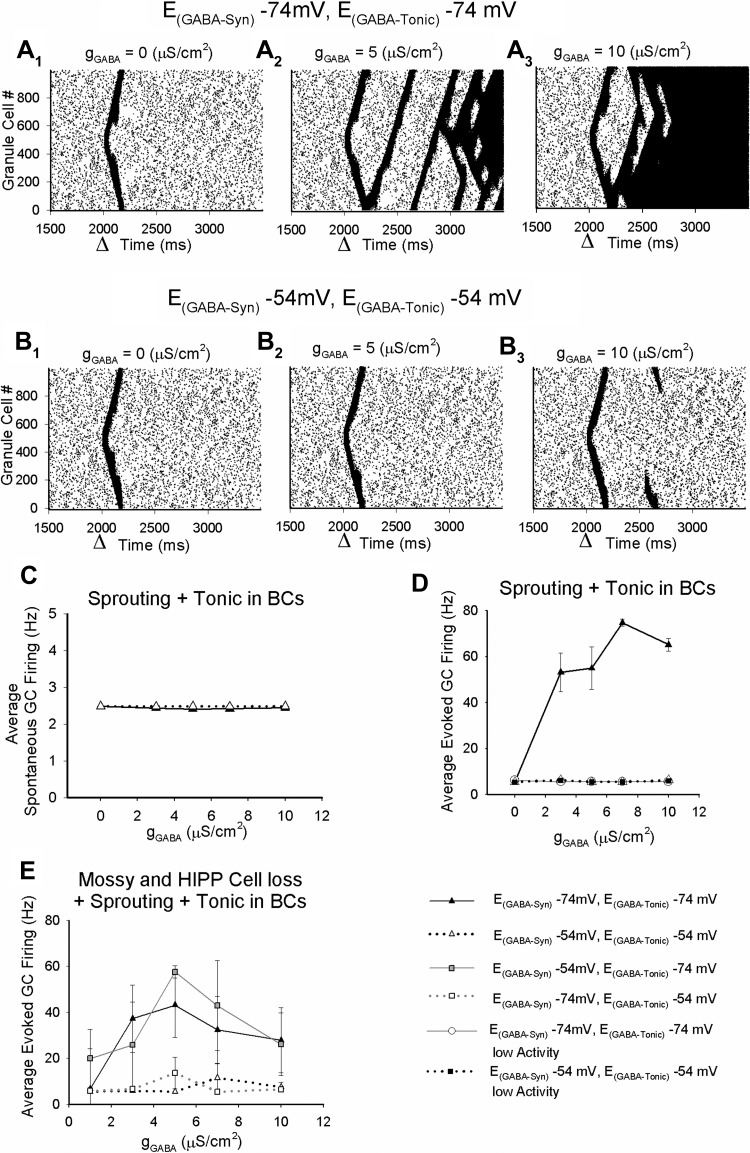
Temporal lobe epilepsy is associated with loss of interneurons and inhibitory dysfunction in the dentate gyrus. While status epilepticus (SE) leads to changes in granule cell inhibition, whether dentate basket cells critical for regulating granule cell feedforward and feedback inhibition express tonic GABA currents (I(GABA)) and undergo changes in inhibition after SE is not known. We find that interneurons immunoreactive for parvalbumin in the hilar-subgranular region express GABAA receptor (GABA(A)R) δ-subunits, which are known to underlie tonic I(GABA). Dentate fast-spiking basket cells (FS-BCs) demonstrate baseline tonic I(GABA) blocked by GABA(A)R antagonists. In morphologically and physiologically identified FS-BCs, tonic I(GABA) is enhanced 1 wk after pilocarpine-induced SE, despite simultaneous reduction in spontaneous inhibitory postsynaptic current (sIPSC) frequency. Amplitude of tonic I(GABA) in control and post-SE FS-BCs is enhanced by 4,5,6,7-tetrahydroisoxazolo[5,4-c]pyridin-3-ol (THIP), demonstrating the contribution of GABA(A)R δ-subunits. Whereas FS-BC resting membrane potential is unchanged after SE, perforated-patch recordings from FS-BCs show that the reversal potential for GABA currents (E(GABA)) is depolarized after SE. In model FS-BCs, increasing tonic GABA conductance decreased excitability when E(GABA) was shunting and increased excitability when E(GABA) was depolarizing. Although simulated focal afferent activation evoked seizurelike activity in model dentate networks with FS-BC tonic GABA conductance and shunting E(GABA), excitability of identical networks with depolarizing FS-BC E(GABA) showed lower activity levels. Thus, together, post-SE changes in tonic I(GABA) and E(GABA) maintain homeostasis of FS-BC activity and limit increases in dentate excitability. These findings have implications for normal FS-BC function and can inform studies examining comorbidities and therapeutics following SE.


Figures

Fig. 1.
Fig. 1.
Early changes in dentate network function after pilocarpine-induced status epilepticus (SE). A and B: photomicrographs of NeuN-stained sections obtained from rats perfused 1 wk after saline injection or pilocarpine-induced SE demonstrate the presence of numerous NeuN-stained hilar neurons in the section from the control (A) and fewer hilar NeuN-stained neurons in a level-matched post-SE section (B). GCL, granule cell layer. Scale bars, 200 μm. C: representative traces of granule cell field responses evoked by perforant path stimulation in slices from control (top) and 1 wk after SE (bottom) illustrate the larger population spike amplitude in the post-SE dentate. Traces are an average of 4 trials in response to a 4-mA stimulus to the perforant path. Arrowheads indicate the location of the truncated stimulus artifact, and arrows point to the population spike. D: summary data demonstrate the post-SE increase in dentate-evoked excitability at various stimulation intensities. Error bars indicate SE. *P < 0.05 by repeated-measures ANOVA.
Fig. 2.
Fig. 2.
GABAA receptor (GABAAR) δ-subunit expression in parvalbumin (PV) interneurons. A–D: confocal images from slices labeled for PV (left) and GABAAR δ-subunit (center). Merged images (right) show colabeling of PV and GABAAR δ-subunit in soma (A) and a hilar dendrite (B) from a control rat and soma (C) and a hilar dendrite (D) from a post-SE rat. Arrows indicate colabeled cells, and arrowheads point to cells expressing GABAAR δ-subunit not labeled for PV. Scale bars (10 μm) in A and C apply to A–D. E: summary data show % of PV+ neurons in the hilar-GCL border colabeled for GABAAR δ-subunit. F: histogram of fluorescence intensity for GABAAR δ-subunit staining in the somata of PV+ neurons from control and post-SE rats.
Fig. 3.
Fig. 3.
Morphological and physiological characterization of dentate interneurons projecting to granule cell somata and dendrites. A, top: reconstruction of a fast-spiking basket cell (FS-BC) filled during recordings shows the typical morphology with soma and dendrites in blue and axon in GCL in black. ML, molecular layer. Bottom: membrane voltage traces from the same cell illustrate the fast-spiking, nonadapting firing pattern during a +500 pA current injection and relatively low membrane hyperpolarization in response to a −100 pA current injection. Inset: confocal image of biocytin-filled (BIO) soma and dendrites (arrowheads) of the cell in A (top) and labeling for PV in the dendrites (middle); bottom: merged image showing PV colabeling in the biocytin-filled dendrites (arrowheads). Scale bar, 100 μm. B, top: Neurolucida reconstruction of a non-fast-spiking interneuron (non-FS-IN) with axon in the ML. Bottom: membrane voltage traces from the same cell show the typical adapting firing during a +200 pA current injection and membrane hyperpolarization and depolarizing sag (arrowhead) during a −100-pA current injection. Note the difference in membrane hyperpolarization in response to −100-pA current injections between the FS-BC (A) and non-FS-IN (B).
Fig. 4.
Fig. 4.
Expression of tonic GABA currents (IGABA) in dentate FS-BCs. A: representative voltage-clamp recordings (Vhold = −70 mV) from a FS-BC in the hilar-GCL border illustrates the presence of tonic IGABA blocked by SR95531 (gabazine, 10 μM). B: expanded 30-s traces of the boxed area in A. Gaussian fits to all-points histograms derived from the illustrated recording periods in control conditions, in the presence of 3 mM kynurenic acid (KyA), and after the addition of gabazine used to determine tonic current amplitude are shown on right. Dashed lines indicate Gaussian means, and the difference currents are noted. Inset: membrane voltage trace from the same cell shows fast-spiking firing. C: representative voltage-clamp recordings (Vhold = −70 mV) from a non-FS-IN in the hilar-GCL border illustrates lack of tonic IGABA on blocking GABAAR with SR95531 (10 μM). D: expanded 30-s traces of the boxed area in C. Gaussian fits to all-points histograms used to determine tonic current amplitude are presented on right. Inset: membrane voltage trace from the cell in C and D shows adapting firing. E: summary data of tonic IGABA amplitude in 3 mM kynurenic acid in FS-BCs and non-FS-IN. Individual data points are represented by gray dots. *P < 0.05 by unpaired Student's t-test.
Fig. 5.
Fig. 5.
Tonic IGABA in dentate FS-BCs are enhanced after SE. A and B: segments (30 s) of representative voltage-clamp recordings (Vhold = −70 mV) from control (A) and post-SE (B) FS-BCs illustrate the enhancement of tonic IGABA by addition of 4,5,6,7-tetrahydroisoxazolo[5,4-c]pyridin-3-ol (THIP, 1 μM). Tonic IGABA was measured as the current blocked by SR95531 (10 μM). Panels on right show Gaussian fits to all-points histograms of the 30-s recording periods in 3 mM kynurenic acid, after the addition of THIP (1 μM), and in SR95531. Dashed lines indicate Gaussian means, and the difference currents are noted. Insets: membrane voltage traces show fast-spiking firing of the respective cells. C: summary of the magnitude of FS-BC tonic IGABA in 3 mM kynurenic acid and after perfusion of THIP (1 μM) in controls and after SE. D: histogram presents baseline tonic IGABA recorded in 3 mM kynurenic acid normalized to the cell membrane capacitance. E: tonic IGABA in control and post-SE FS-BCs measured with the GABA transporter antagonist NO-711 (10 μM) in the presence of 3 mM kynurenic acid. *P < 0.05 by paired and unpaired Student's t-test.
Fig. 6.
Fig. 6.
Decrease in FS-BC spontaneous inhibitory postsynaptic current (sIPSC) frequency after SE. A: representative traces of voltage-clamp recordings from control (top) and post-SE (bottom) FS-BCs show the higher sIPSC frequency in the control FS-BC. Note the decrease in sIPSC frequency in the recording from the post-SE FS-BC. B and C: cumulative probability plot of the sIPSC instantaneous frequency (B) and charge transfer (C) in control and post-SE FS-BCs measured with symmetrical chloride from a holding potential of −70 mV in kynurenic acid (3 mM). The same number of individual events was selected from each cell to develop the cumulative probability distribution (control: n = 10 cells; post-SE: n = 7 cells).
Fig. 7.
Fig. 7.
FS-BC GABA reversal potential (EGABA) is depolarized after status epilepticus. A: gramicidin-perforated-patch recordings show current traces from control (a) and post-SE (b) FS-BCs recorded during depolarizing ramps (bottom) in the absence of GABA (gray) and during pressure application of 100 μM GABA (black). Horizontal dashed line represents holding current (Ihold) = 0 pA at which resting membrane potential (RMP) was determined (gray arrows in insets). The ramp potential at which the current traces without GABA and with GABA crossed represents EGABA (black arrow in inset). Vertical dashed lines intersecting the command potential schematic show the range of command voltage in the boxed area. Insets: expanded traces of boxed regions illustrate the FS-BC RMP (gray arrow) and EGABA (black arrow) in control (a) and post-SE (b) FS-BCs. c: Representative traces from a control experiment showing overlapping current traces in response to depolarizing ramps in the absence of (gray) and during pressure application of the vehicle (black). B: summary plot of FS-BC RMP and EGABA. *P < 0.05 by paired and unpaired Student's t-test.
Fig. 8.
Fig. 8.
GABA agonists depolarize FS-BCs 1 wk after SE. A: cell-attached recordings show membrane voltage traces from control (top) and post-SE (bottom) FS-BC recorded during pressure application of 50 μM muscimol (black bar). B: summary plot of the maximum change in FS-BC membrane potential in response to muscimol application. Individual data points are represented by gray dots. *P < 0.05 by unpaired Student's t-test.
Fig. 9.
Fig. 9.
SE decreases expression of KCC2 in PV interneurons. Confocal images from sections labeled for KCC2 (left) and PV (center) are shown. Merged images (right) show colabeling of KCC2 particularly in the periphery of the PV-positive neurons from a control (top) and a post-SE (bottom) rat. Boxed areas are shown at higher magnification in insets. Images were obtained with identical camera settings. Scale bars, 10 μm.
Fig. 10.
Fig. 10.
Effect of GABA reversal and tonic GABA conductance (gGABA) on model FS-BC excitability. A: responses of biophysically realistic multicompartmental model FS-BC to depolarizing and hyperpolarizing current injections illustrate nonadapting firing and low input resistance (Rin). B: summary plot shows tonic IGABA and Rin in model FS-BCs as a function of tonic gGABA. In simulations with perisomatic gGABA, tonic GABA channels were distributed only in the soma and proximal dendrite. Simulations incorporated voltage-clamp recording conditions with symmetrical chloride and Vhold = −70 mV. Shaded region represents biologically relevant tonic IGABA and gGABA range. C: membrane voltage traces illustrate firing in FS-BC simulations during 200 Hz during identical Poisson-distributed excitatory inputs when tonic gGABA is systematically increased from 0 to 1 mS/cm2. Peak amplitude of input synaptic conductance (gAMPA) was 3 nS. Simulations were performed with control (−74 mV, left) and post-SE (−54 mV, right) EGABA values (Erev). D: summary plot of FS-BC firing evoked by 200-Hz excitatory synaptic inputs (3 nS peak conductance) in the presence of increasing tonic gGABA in FS-BC with EGABA set at −74 and −54 mV. E: summary data show effect of EGABA on FS-BC firing during excitatory synaptic activation at 200 Hz at increasing FS-BC tonic gGABA. Peak conductance of synaptic inputs was 20 nS.
Fig. 11.
Fig. 11.
Basket cell (BC) tonic GABAergic inhibition regulates dentate network excitability. A: granule cell (GC) spike rasters show the action potential firing of each of the 1,000 GCs. Each action potential is represented by a dot corresponding to the active cell (GC number on y-axis) at a certain simulation time (x-axis). Dentate networks were simulated as a ring with 20% sprouting. Network activity was established with Poisson-distributed suprathreshold inputs to granule cell dendrites at 2.5 Hz. A single synchronous suprathreshold activation of 100 GCs at the time marked by the arrowhead in each plot was used to simulate focal afferent activation. Spike rasters illustrate simulations performed with model FS-BC EGABA at −74 mV, in the absence of tonic gGABA (A1), with gGABA = 5 μS/cm2 corresponding to a 30-pA FS-BC tonic IGABA (A2), and with gGABA = 10 μS/cm2 corresponding to a 60-pA tonic IGABA (A3). B: GC spikes form networks simulated as in A, with EGABA in model FS-BCs set to −54 mV. GC spike rasters from simulations in the absence of tonic gGABA (B1), with gGABA = 5 μS/cm2 corresponding to a 30-pA FS-BC tonic IGABA (B2), and with gGABA = 10 μS/cm2 corresponding to a 60-pA tonic IGABA (B3) are illustrated. Spike rasters in A and B were derived from structurally identical network simulations. C: summary plots, on 3 runs in each condition, show the average spontaneous GC firing during 1,000–2,000 ms of the simulations as FS-BC tonic gGABA was increased. D: summary of the average evoked GC firing during 2,001–3,500 ms of the simulation following focal afferent activation as a function of model FS-BC tonic gGABA. Simulations were performed with EGABA set at −74 mV or −54 mV (8 independent runs). Simulations in networks with “high activity” levels when EGABA was −74 mV are summarized separately (4 runs at EGABA-Tonic = −74 mV and 5 runs at EGABA-Tonic = −54 mV) from networks with low activity at both −74 mV and −54 mV EGABA (5 runs each). E: summary of the average evoked GC firing following focal afferent activation as a function of model FS-BC tonic gGABA in networks including mossy fiber sprouting and hilar neuronal loss. Simulations were conducted on 4 structurally identical networks showing high activity with tonic and synaptic EGABA set at −74 mV. Key on right applies to D and E.

References

    1. Arima-Yoshida F, Watabe AM, Manabe T. The mechanisms of the strong inhibitory modulation of long-term potentiation in the rat dentate gyrus. Eur J Neurosci 33: 1637–1646, 2011 - PubMed
    1. Baldi R, Varga C, Tamas G. Differential distribution of KCC2 along the axo-somato-dendritic axis of hippocampal principal cells. Eur J Neurosci 32: 1319–1325, 2010 - PubMed
    1. Banke TG, McBain CJ. GABAergic input onto CA3 hippocampal interneurons remains shunting throughout development. J Neurosci 26: 11720–11725, 2006 - PMC - PubMed
    1. Bartos M, Vida I, Frotscher M, Geiger JR, Jonas P. Rapid signaling at inhibitory synapses in a dentate gyrus interneuron network. J Neurosci 21: 2687–2698, 2001 - PMC - PubMed
    1. Bartos M, Vida I, Frotscher M, Meyer A, Monyer H, Geiger JR, Jonas P. Fast synaptic inhibition promotes synchronized gamma oscillations in hippocampal interneuron networks. Proc Natl Acad Sci USA 99: 13222–13227, 2002 - PMC - PubMed

Publication types

LinkOut - more resources