. 2013 Apr;109(7):1824-36.
doi: 10.1152/jn.00612.2012. Epub 2013 Jan 16.

Chronic electrical stimulation homeostatically decreases spontaneous activity, but paradoxically increases evoked network activity

Affiliations

Chronic electrical stimulation homeostatically decreases spontaneous activity, but paradoxically increases evoked network activity

Anubhuti Goel et al. J Neurophysiol. 2013 Apr.

Abstract

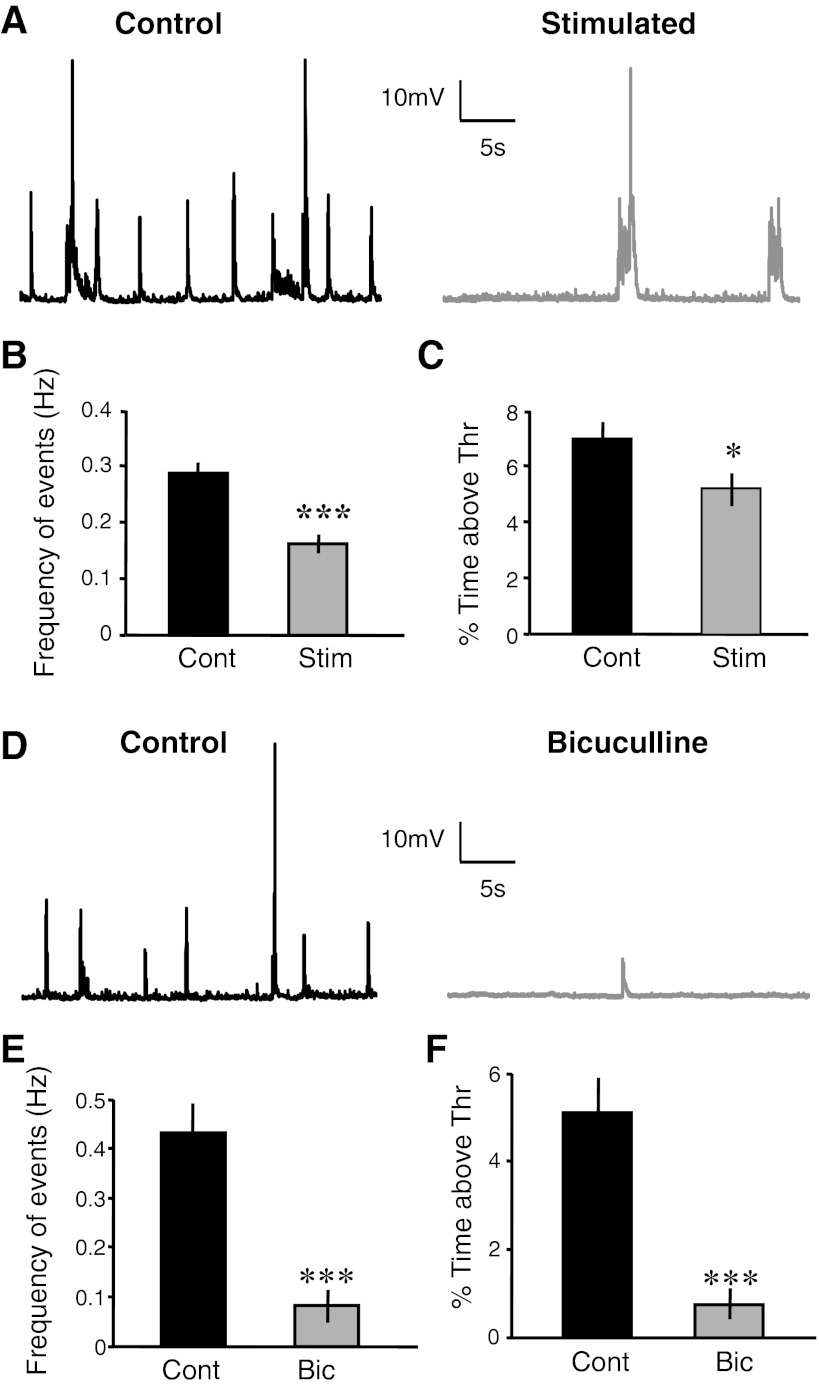
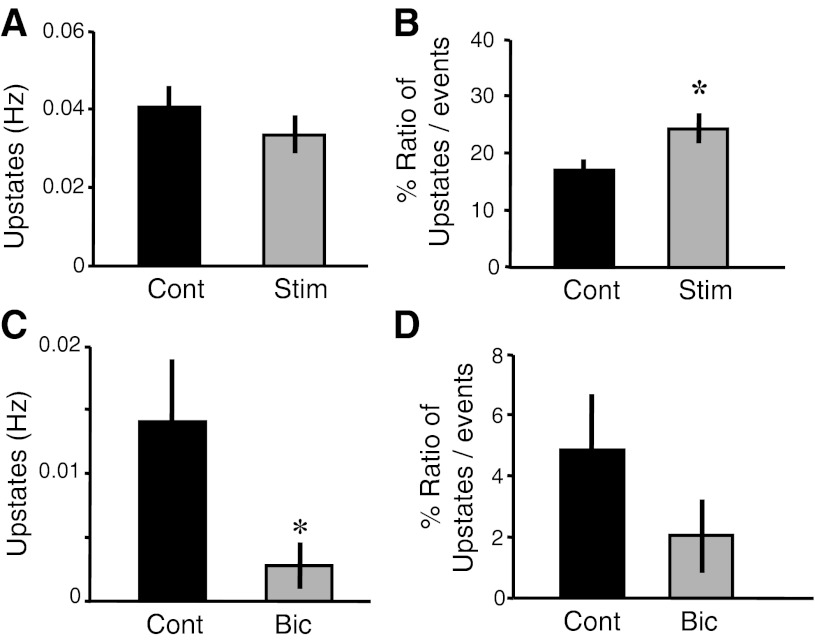
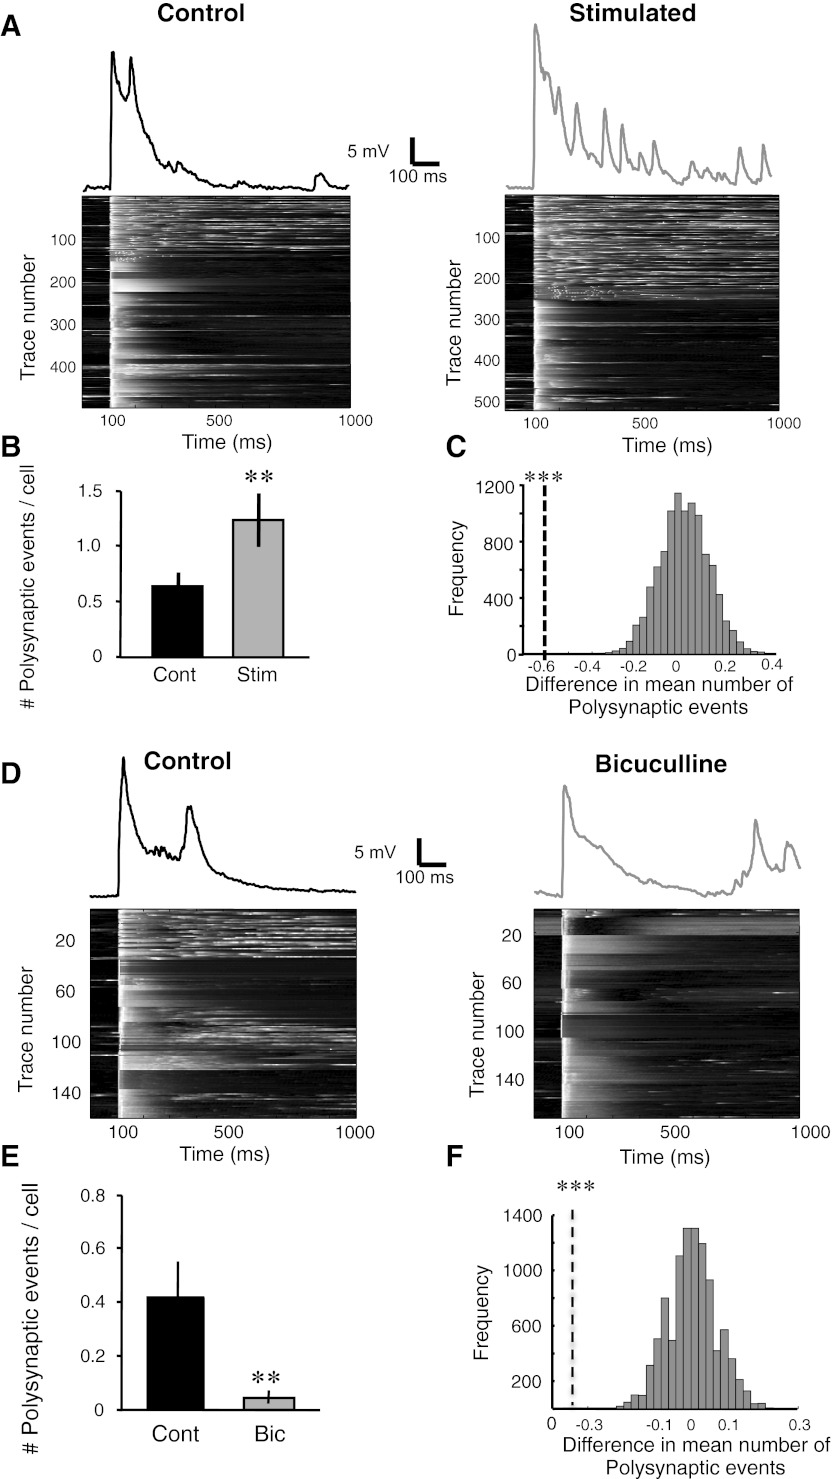
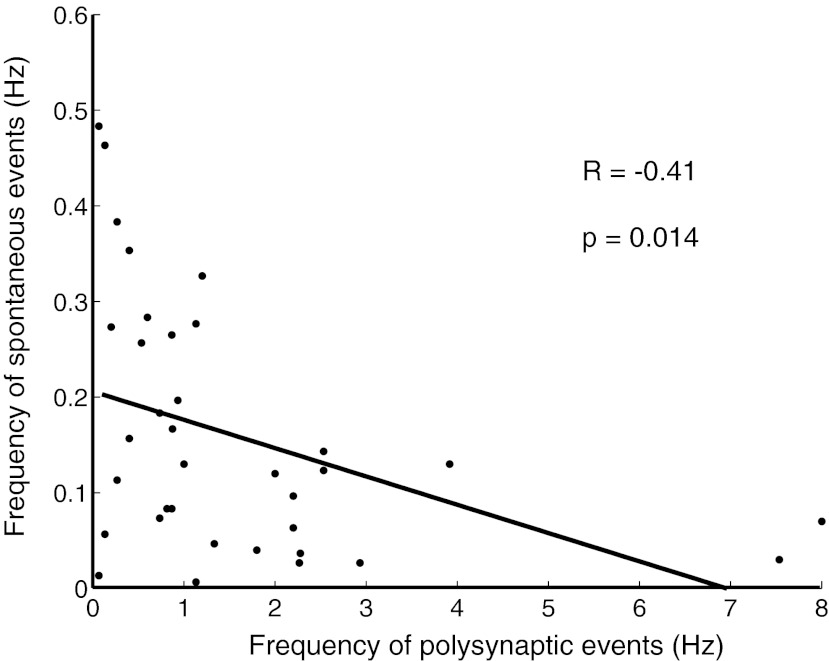
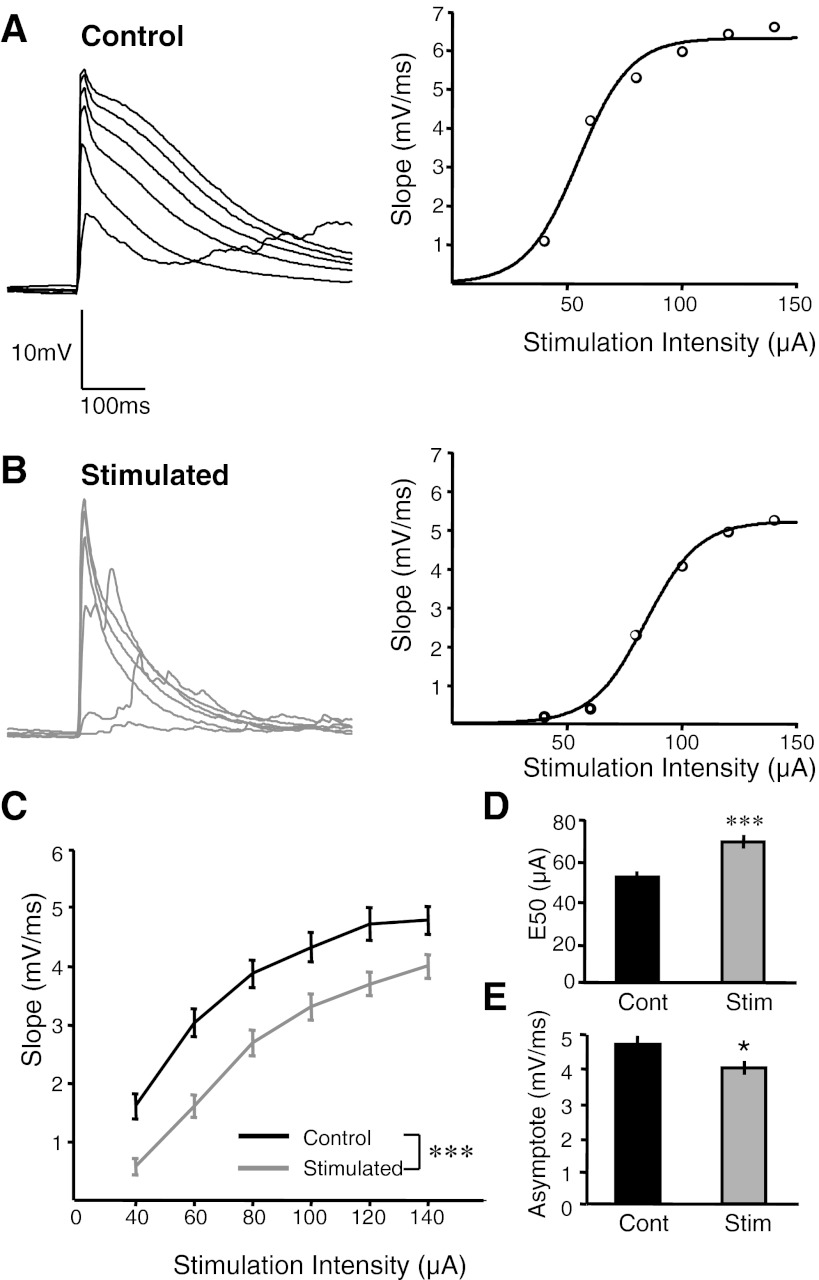
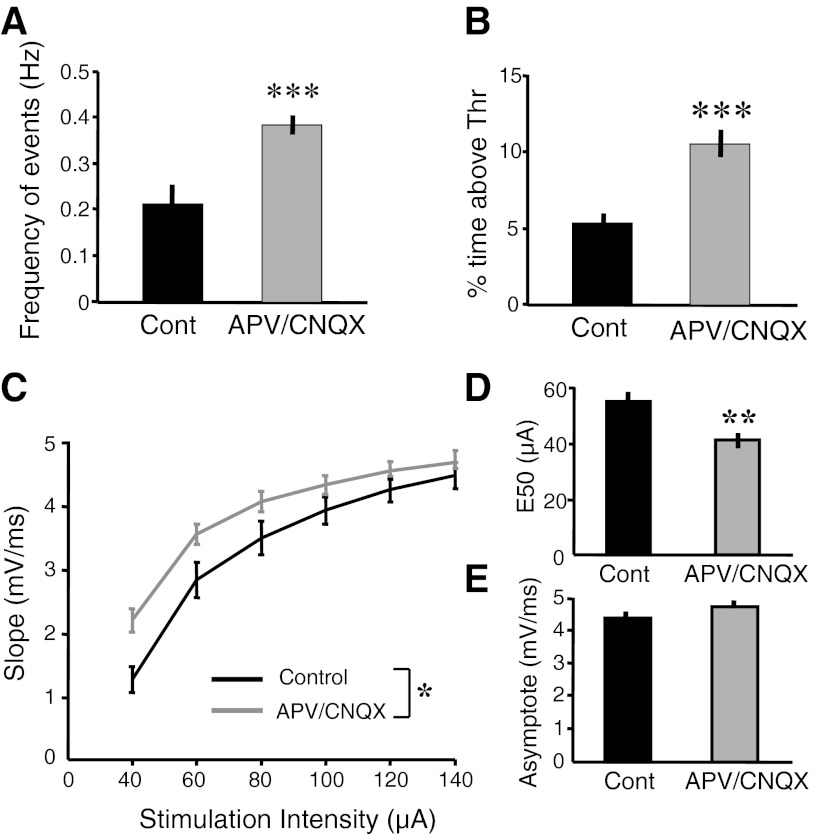
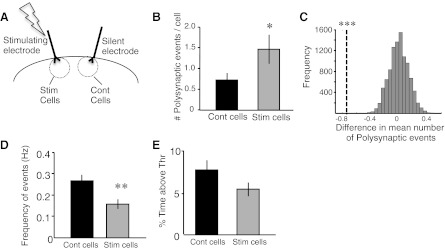
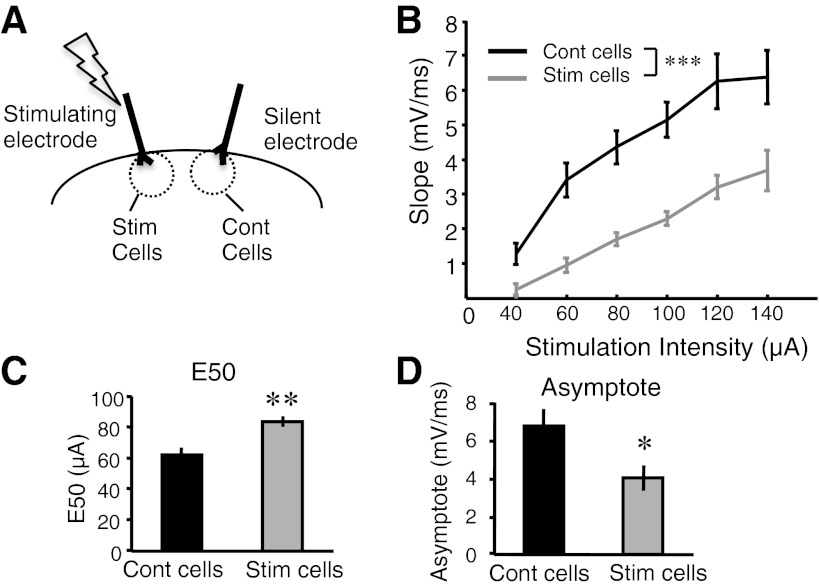
Neural dynamics generated within cortical networks play a fundamental role in brain function. However, the learning rules that allow recurrent networks to generate functional dynamic regimes, and the degree to which these regimes are themselves plastic, are not known. In this study we examined plasticity of network dynamics in cortical organotypic slices in response to chronic changes in activity. Studies have typically manipulated network activity pharmacologically; we used chronic electrical stimulation to increase activity in in vitro cortical circuits in a more physiological manner. Slices were stimulated with "implanted" electrodes for 4 days. Chronic electrical stimulation or treatment with bicuculline decreased spontaneous activity as predicted by homeostatic learning rules. Paradoxically, however, whereas bicuculline decreased evoked network activity, chronic stimulation actually increased the likelihood that evoked stimulation elicited polysynaptic activity, despite a decrease in evoked monosynaptic strength. Furthermore, there was an inverse correlation between spontaneous and evoked activity, suggesting a homeostatic tradeoff between spontaneous and evoked activity. Within-slice experiments revealed that cells close to the stimulated electrode exhibited more evoked polysynaptic activity and less spontaneous activity than cells close to a control electrode. Collectively, our results establish that chronic stimulation changes the dynamic regimes of networks. In vitro studies of homeostatic plasticity typically lack any external input, and thus neurons must rely on "spontaneous" activity to reach homeostatic "set points." However, in the presence of external input we propose that homeostatic learning rules seem to shift networks from spontaneous to evoked regimes.


Figures

Fig. 1.
Fig. 1.
Chronic electrical stimulation decreases spontaneous activity. A: raw representative spontaneous trace from a cell from a control (left) and a chronically stimulated slice (right). B: spontaneous events as quantified by frequency were decreased in the stimulated group (t-test, ***P = 10−5). C: spontaneous activity as quantified by percent time above a predetermined threshold (5 mV above rest) (t-test, *P = 0.03) was decreased in the stimulated slices compared with the control slices. D: raw representative spontaneous traces from cells from control (left) and bicuculline-treated groups (right). E and F: spontaneous activity as quantified by frequency (t-test, ***P = 10−5) and percent time above threshold (t-test, ***P = 10−5), respectively, were decreased in the bicuculline group. Stim, stimulated group; Cont, control group; Bic, bicuculline-treated group; Thr, threshold.
Fig. 2.
Fig. 2.
Chronic electrical stimulation increases the relative proportion of Up states. A: number of Up States per second was unchanged between the control and electrically stimulated groups. B: there was an increase in the relative number of Up States in the stimulated group compared with the control (t-test, *P < 0.02). C and D: there was a decrease in Up-state frequency in the bicuculline-treated group (C; t-test, *P < 0.03); however, there was no change in the ratio of Up states (D).
Fig. 3.
Fig. 3.
Chronic electrical stimulation increases evoked network activity as measured by evoked polysynaptic events. A: raw representative excitatory postsynaptic potential (EPSP) trace (includes overlapping monosynaptic and polysynaptic events) from a cell from a control (top left) and a chronically stimulated slice (top right). All the raw evoked data collected from the control and stimulated groups are plotted as voltagegrams (bottom). Data are sorted according to the presence or absence of polysynaptic events, and the voltage value in each trace is normalized to its own peak. Note the increase in number of traces exhibiting polysynaptic activity in the stimulated group (right). B: the stimulated group showed a significant increase in number of polysynaptic events per cell (Wilcoxon test, **P < 0.01). C: bootstrap analysis (explained in detail in materials and methods) showed a significant difference in the polysynaptic events between the stimulated and control groups (***P < 10−4). The black dashed line represents the empirically derived difference in the mean number of polysynaptic events per trace (control minus stimulated). The gray histogram represents 10,000 simulations of this difference when the groups are composed of shuffled data. D: raw representative EPSP trace from a cell from a control (top left) and a bicuculline-treated slice (top right). All the raw evoked data collected from the control and bicuculline-treated groups are plotted as voltagegrams (bottom). Note the dramatic decrease in polysynaptic events in the bicuculline-treated group (right). E: the stimulated group showed a significant decrease in number of polysynaptic events per cell (Wilcoxon test, **P < 0.01). F: bootstrap analysis showed a significant difference in the distribution of polysynaptic peaks between the bicuculline-treated and control groups (***P < 10−4).
Fig. 4.
Fig. 4.
Frequency of spontaneous events was negatively correlated with the evoked polysynaptic events in the chronically stimulated group. There was a significant inverse correlation between the spontaneous and evoked polysynaptic events (R = −0.41, P = 0.014).
Fig. 5.
Fig. 5.
Chronic electrical stimulation decreases evoked EPSP strength as analyzed by input/output (I/O) function. A: representative evoked monosynaptic EPSPs from a control cell at 6 stimulation intensities superimposed (left) and the respective I/O curve constructed from the slope measurements of these 6 EPSPs (right). B: representative evoked monosynaptic EPSPs from a cell from a chronically stimulated slice at 6 stimulation intensities (left) and the respective I/O curve constructed from the slope measurements of these 6 EPSPs (right). Note the shift in I/O curve to the right in the stimulated cell. C: slope of initial EPSPs at different stimulation intensities was significantly decreased in the stimulated group compared with the control group (ANOVA: F1,68 = 13.1, P < 0.001). D: I/O function analysis shows a significant increase in the stimulation intensity that elicits half-maximal EPSPs (E50) (t-test, ***P < 10−4). E: there was a significant decrease in the estimated asymptote (t-test, *P < 0.04) in the stimulated group compared with the control group.
Fig. 6.
Fig. 6.
Activity blockade using dl-2-amino-5-phosphonovaleric acid and 6-cyano-7-nitroquinoxaline-2,3-dione (APV/CNQX) increases spontaneous activity and evoked EPSP strength. A: the APV/CNQX-treated group showed an increase in spontaneous events as quantified by frequency (t-test, ***P = 10−4). B: spontaneous activity as quantified by percent time above threshold (t-test, ***P = 10−5) was increased in the APV/CNQX-treated group compared with the control group. C: slope of initial EPSPs at different stimulation intensities was significantly increased in the APV/CNQX-treated group compared with the control group (ANOVA: F1,55 = 4.56, *P < 0.03). D: I/O function analysis showed a significant increase in E50 in the APV/CNQX-treated group (t-test, **P < 0.002). E: there was no change in the asymptote of the I/O curve between the 2 groups.
Fig. 7.
Fig. 7.
Increase in evoked polysynaptic response and decrease in spontaneous activity are local to the stimulating electrode. A: schematic showing the placement of stimulating and silent electrodes in the slice and the 2 populations of recorded cells. B: the stimulated group showed a significant increase in number of polysynaptic events in the cells close to the stimulating electrode (Wilcoxon test, *P < 0.05). Note all evoked responses were elicited by the “close” electrode. C: bootstrap analysis (explained in detail in materials and methods) showed a significant difference in the mean number of polysynaptic events per trace between the stimulated and control cells (***P < 10−4). D and E: spontaneous events as quantified by frequency were decreased (D; t-test, **P = 0.005), whereas there was a trend for a decrease in percent time above threshold (E; t-test, P = 0.11) in the stimulated group.
Fig. 8.
Fig. 8.
Decrease in evoked monosynaptic response is local to the stimulating electrode. A: schematic similar to Fig 7 showing the placement of stimulating and silent electrodes in the slice and the 2 populations of recorded cells. B: slope of monosynaptic EPSPs at different stimulation intensities was significantly decreased in the stimulated cells (close to stimulating electrode) compared with control cells (close to silent electrode) (ANOVA: F1,34 = 27.9, ***P = 10−6). C: I/O function analysis showed a significant increase in E50 (t-test, **P < 0.002). D: there was a significant decrease in the asymptote of the I/O function (t-test, *P < 0.02) in the stimulated cells compared with control cells.

Similar articles

Cited by

References

    1. Abbott LF, Nelson SB. Synaptic plasticity: taming the beast. Nat Neurosci 3: 1178–1183, 2000 - PubMed
    1. Bazhenov M, Timofeev I, Steriade M, Sejnowski TJ. Model of thalamocortical slow-wave sleep oscillations and transitions to activated States. J Neurosci 22: 8691–8704, 2002 - PMC - PubMed
    1. Benedetti BL, Glazewski S, Barth AL. Reliable and precise neuronal firing during sensory plasticity in superficial layers of primary somatosensory cortex. J Neurosci 29: 11817–11827, 2009 - PMC - PubMed
    1. Buonomano DV. A learning rule for the emergence of stable dynamics and timing in recurrent networks. J Neurophysiol 94: 2275–2283, 2005 - PubMed
    1. Buonomano DV. Timing of neural responses in cortical organotypic slices. Proc Natl Acad Sci USA 100: 4897–4902, 2003 - PMC - PubMed

Publication types

LinkOut - more resources