

A computational model for optimal muscle activity considering muscle viscoelasticity in wrist movements
- PMID: 23324321
- PMCID: PMC3628039
- DOI: 10.1152/jn.00542.2011
A computational model for optimal muscle activity considering muscle viscoelasticity in wrist movements
Abstract
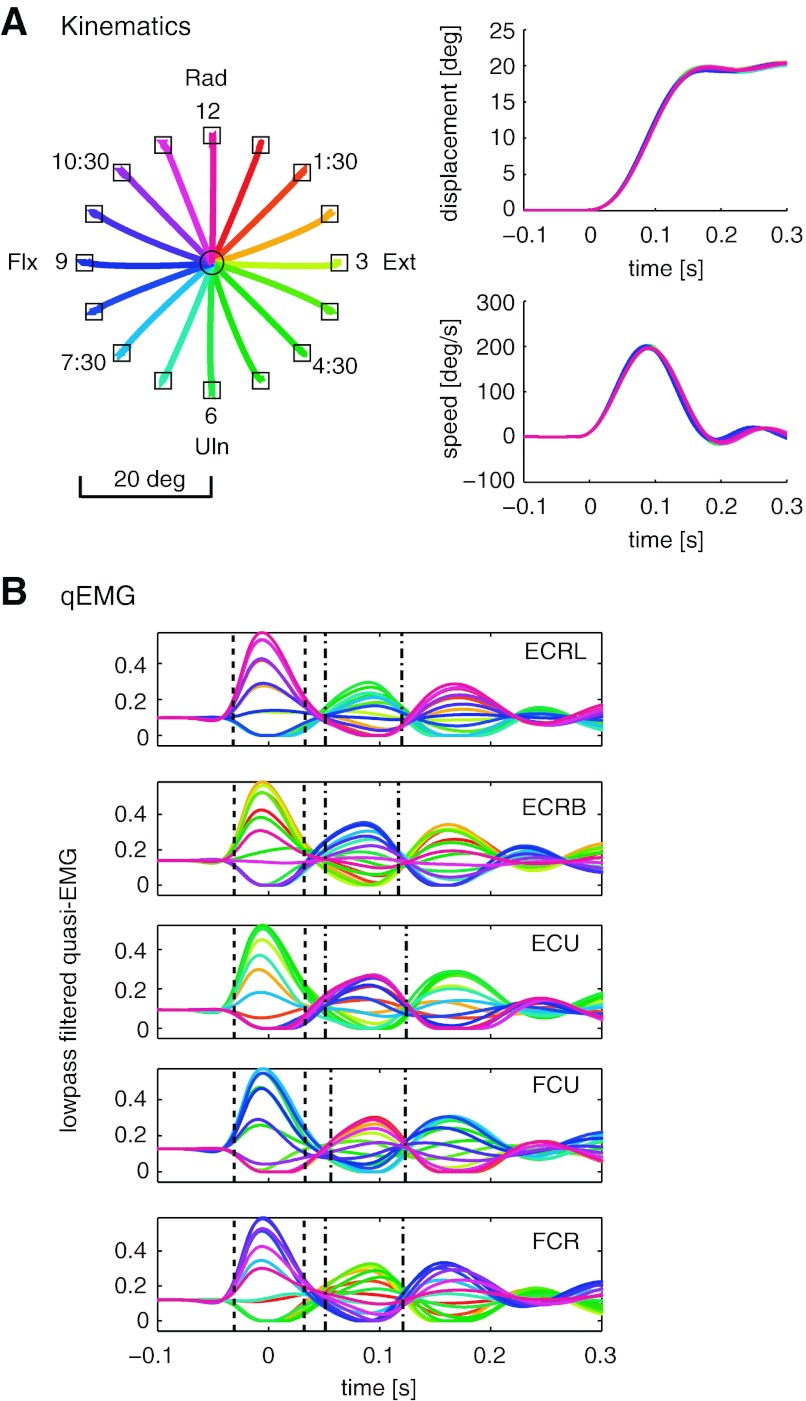
To understand the mechanism of neural motor control, it is important to clarify how the central nervous system organizes the coordination of redundant muscles. Previous studies suggested that muscle activity for step-tracking wrist movements are optimized so as to reduce total effort or end-point variance under neural noise. However, since the muscle dynamics were assumed as a simple linear system, some characteristic patterns of experimental EMG were not seen in the simulated muscle activity of the previous studies. The biological muscle is known to have dynamic properties in which its elasticity and viscosity depend on activation level. The motor control system is supposed to consider the viscoelasticity of the muscles when generating motor command signals. In this study, we present a computational motor control model that can control a musculoskeletal system with nonlinear dynamics. We applied the model to step-tracking wrist movements actuated by five muscles with dynamic viscoelastic properties. To solve the motor redundancy, we designed the control model to generate motor commands that maximize end-point accuracy under signal-dependent noise, while minimizing the squared sum of them. Here, we demonstrate that the muscle activity simulated by our model exhibits spatiotemporal features of experimentally observed muscle activity of human and nonhuman primates. In addition, we show that the movement trajectories resulting from the simulated muscle activity resemble experimentally observed trajectories. These results suggest that, by utilizing inherent viscoelastic properties of the muscles, the neural system may optimize muscle activity to improve motor performance.
Figures


Similar articles
-
Optimal control of redundant muscles in step-tracking wrist movements.J Neurophysiol. 2005 Dec;94(6):4244-55. doi: 10.1152/jn.00404.2005. Epub 2005 Aug 3. J Neurophysiol. 2005. PMID: 16079196
-
A computational model of muscle recruitment for wrist movements.J Neurophysiol. 2002 Dec;88(6):3348-58. doi: 10.1152/jn.00621.2002. J Neurophysiol. 2002. PMID: 12466451
-
Viscoelastic properties of the wrist motor servo in man.Ann Biomed Eng. 1984;12(6):599-620. doi: 10.1007/BF02371452. Ann Biomed Eng. 1984. PMID: 6534226
-
Incorporating the length-dependent passive-force generating muscle properties of the extrinsic finger muscles into a wrist and finger biomechanical musculoskeletal model.J Biomech. 2017 Aug 16;61:250-257. doi: 10.1016/j.jbiomech.2017.06.026. Epub 2017 Jun 21. J Biomech. 2017. PMID: 28774467 Free PMC article.
-
How does the brain solve muscle redundancy? Filling the gap between optimization and muscle synergy hypotheses.Neurosci Res. 2016 Mar;104:80-7. doi: 10.1016/j.neures.2015.12.008. Epub 2015 Dec 24. Neurosci Res. 2016. PMID: 26724372 Review.
Cited by
-
Quantitative evaluation of age-related decline in control of preprogramed movement.PLoS One. 2017 Nov 29;12(11):e0188657. doi: 10.1371/journal.pone.0188657. eCollection 2017. PLoS One. 2017. PMID: 29186168 Free PMC article.
-
Muscles Reduce Neuronal Information Load: Quantification of Control Effort in Biological vs. Robotic Pointing and Walking.Front Robot AI. 2020 Jun 24;7:77. doi: 10.3389/frobt.2020.00077. eCollection 2020. Front Robot AI. 2020. PMID: 33501244 Free PMC article.
-
Analysis of Control Characteristics between Dominant and Non-Dominant Hands by Transient Responses of Circular Tracking Movements in 3D Virtual Reality Space.Sensors (Basel). 2020 Jun 19;20(12):3477. doi: 10.3390/s20123477. Sensors (Basel). 2020. PMID: 32575627 Free PMC article.
-
Morphological Computation Increases From Lower- to Higher-Level of Biological Motor Control Hierarchy.Front Robot AI. 2020 Oct 21;7:511265. doi: 10.3389/frobt.2020.511265. eCollection 2020. Front Robot AI. 2020. PMID: 33501299 Free PMC article.
-
Muscle Synergy and Musculoskeletal Model-Based Continuous Multi-Dimensional Estimation of Wrist and Hand Motions.J Healthc Eng. 2020 Jan 28;2020:5451219. doi: 10.1155/2020/5451219. eCollection 2020. J Healthc Eng. 2020. PMID: 32399165 Free PMC article.
References
-
- Bard C, Turrell Y, Fleury M, Teasdale N, Lamarre Y, Martin O. Deafferentation and pointing with visual double-step perturbations. Exp Brain Res 125: 410–416, 1999 - PubMed
-
- Barto AG. Adaptive critics and the basal ganglia. In: Models of Information Processing in the Basal Ganglia, edited by Houk CJ, Davis JL, Beiser DG. Cambridge: MIT Press, 1995, p. 215–211
-
- Ben-Itzhak S, Karniel A. Minimum acceleration criterion with constraints implies bang-bang control as an underlying principle for optimal trajectories of arm reaching movements. Neural Comput 20: 779–812, 2008 - PubMed
-
- Buchanan TS, Shreeve DA. An evaluation of optimization techniques for the prediction of muscle activation patterns during isometric tasks. J Biomech Eng 118: 565–574, 1996 - PubMed
Publication types
MeSH terms
LinkOut - more resources
Full Text Sources
Other Literature Sources