. 2013 Apr;109(7):1928-39.
doi: 10.1152/jn.00688.2012. Epub 2013 Jan 16.

Performance monitoring by presupplementary and supplementary motor area during an arm movement countermanding task

Affiliations

Performance monitoring by presupplementary and supplementary motor area during an arm movement countermanding task

Katherine W Scangos et al. J Neurophysiol. 2013 Apr.

Abstract

A key component of executive control and decision making is the ability to use the consequences of chosen actions to update and inform the process of future action selection. Evaluative signals, which monitor the outcomes of actions, are critical for this ability. Signals related to the evaluation of actions have been identified in eye movement-related areas of the medial frontal cortex. Here we examined whether such evaluative signals are also present in areas of the medial frontal cortex related to arm movements. To answer this question, we recorded from cells in the supplementary motor area (SMA) and pre-SMA, while monkeys performed an arm movement version of the countermanding paradigm. SMA and pre-SMA have been implicated in the higher-order control of movement selection and execution, although their precise role within the skeletomotor control circuit is unclear. We found evaluative signals that encode information about the expected outcome of the reward, the actual outcome, and the mismatch between actual and intended outcome. These findings suggest that signals that monitor and evaluate movement outcomes are represented throughout the medial frontal cortex, playing a general role across effector systems. These evaluation signals supervise the relationship between intentional motor behavior and reward expectation and could be used to adaptively shape future goal-directed behavior.


Figures

Fig. 1.
Fig. 1.
The sequence of events in the arm countermanding task. The trial begins when the cursor is positioned inside the center box. After a delay, the target box appears to one side of the screen, and the center box disappears, instructing the monkey to move the cursor into the target box. On stop signal trials, the center box reappears after the stop signal delay (SSD), signaling that the monkey should cancel the planned movement.
Fig. 2.
Fig. 2.
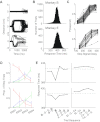
The behavioral data across recording sessions. A: handlebar traces for monkey B during one recording showing the handlebar position on canceled trials (top), no-stop signal trials (middle), and noncanceled trials (bottom). The response time distributions (B) and the inhibition functions (C) across all recording sessions for monkey B (top) and monkey E (bottom) are shown. D: the mean proportion of each type of stop trial by SSD showing canceled trials in red, corrected trials in blue, and noncanceled trials in green for each monkey. E: the effects of trial history across recording sessions. Left column shows response times for no-stop signal trials one, two, or three trials away from noncanceled trials for monkey B (top) and monkey E (bottom). Right column shows response times for no-stop signal trials one, two, or three trials away from canceled trials. The type of trials to which the response time corresponds is shown in bold (G: no-stop signal; E: noncanceled; Ca: canceled). The dotted line indicates the average response time on no-stop signal trials.
Fig. 3.
Fig. 3.
Localization of recording sites. A: a model of the brain for monkey B constructed from MRI slices showing the pre-supplementary motor area (SMA) region highlighted in blue and the SMA region highlighted in green. Major sulci are outlined in yellow. The black box indicates the location of the recording chamber, and the yellow grid indicates the recording sites. CS, central sulcus; AR, arcuate sulcus; PR, principal sulcus. B: model of the brain showing chamber location for monkey E. C: a magnified version of the recording grid shown in A and B for monkey B (left) and monkey E (right). The horizontal black line indicates the pre-SMA/SMA border. The colored circles indicate the position of the evaluative neurons (error cells: red, reward cells: green, reward expectation cells: blue, surprise cells: pink). The circle size indicates the number of neurons (large: >4 cells, medium: 3–4 cells, small: 1–2 cells). Penetrations that yielded no evaluative neurons are indicated by gray dots. Each box is 0.5 mm × 0.5 mm. D: combined evaluative cell activity across monkeys is shown, together with movement-related activity (black dots).
Fig. 4.
Fig. 4.
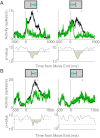
Error-related activity. A: spike density function for an error cell showing a response following both movements to the right (first column) and movements to the left (second column). Error trial activity is shown in green. Activity on no-stop signal trials is shown in black throughout the figure, while activity on noncanceled trials is shown in green. For all figures, the black box above each plot indicates the direction of movement toward the target. Results of t-tests performed on movement-related activity compared with baseline activity in 60-ms intervals are shown below each spike density function. Dotted line indicates P = 0.05 boundary. B: an example of unidirectional error cell activity showing an error response only for movements to the left. C: spike density function showing a transient burst of activity directly following the end of the movement. D: spike density function for an error cell showing tonic activity following an error. For both C and D, activity for movements to the right and left targets are combined. All plots are aligned on the time of movement end.
Fig. 5.
Fig. 5.
Surprise-related activity. A: spike density function for a surprise cell comparing activity on noncanceled trials (green) and no-stop signal trials (black). Activity is aligned on the time of movement end, and movements to the right and left are combined. B: activity for this same cell aligned on receipt of reward for expected reward trials (black) and unexpected reward (magenta).
Fig. 6.
Fig. 6.
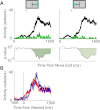
Reward expectation cells. A: spike density functions for a reward expectation cell with a short burst of activity showing activity on no-stop signal trials in black and noncanceled trials in green. Activity is aligned on the time of movement end. Activity for movements to the right and left are combined. B: spike density functions for a reward expectation cell with sustained activity until reward delivery. C: spike density functions for a reward expectation cell showing a burst of activity before reward, and a second during the reward. D: reward expectation activity for the cell in A, on no-stop signal trials (black) and canceled trials (red). Activity is aligned on time the reward was received.
Fig. 7.
Fig. 7.
Direction-dependency of reward expectation cells. A: spike density functions for a bidirectional reward expectation cell showing activity on no-stop signal trials in black and noncanceled trials in green. Activity is aligned on the time of movement end. The arrow indicates the time of reward delivery. B: spike density functions for a reward expectation cell with unidirectional activity.
Fig. 8.
Fig. 8.
Reward cells. A: spike density function for a reward cell showing a response following the receipt of reward (black arrow) for both movements to the right (first column) and left (second column). Activity for no-stop signal trials (black) is compared with activity on noncanceled trials (green). Activity is aligned on the time of movement end. B: activity of the same cell as in A across rewarded trial types aligned on time reward was received. No-stop signal trial activity is shown in black, canceled trial activity is shown in red, and corrected trial activity is shown in blue. Activity for movements to the right and left are combined.
Fig. 9.
Fig. 9.
Reward cell responses to expected and unexpected reinforcement. A: spike density functions for trials for which expected reward was given (black) vs. when unexpected reward was given (gray), showing a cell that responds similarly to both types of reward. Activity is aligned on the delivery of reward. B: a cell that prefers expected reward. C: a cell that prefers unexpected reward.
Fig. 10.
Fig. 10.
Population activity. A: population activity for error cells showing activity on no-stop signal trials in black for rightward movements and gray for leftward movements, and noncanceled trials in dark green for rightward movements and light green for leftward movements. Activity is aligned on the time of movement end. B: population activity for reward expectation cells. C: population activity for reward cells. Arrow indicates average time reward was received.

Similar articles

Cited by

References

    1. Akkal D, Bioulac B, Audin J, Burbaud P. Comparison of neuronal activity in the rostral supplementary and cingulate motor areas during a task with cognitive and motor demands. Eur J Neurosci 15: 887–904, 2002 - PubMed
    1. Alexander WH, Brown JW. Medial prefrontal cortex as an action-outcome predictor. Nat Neurosci 14: 1338–1344, 2011 - PMC - PubMed
    1. Aron AR, Poldrack RA. Cortical and subcortical contributions to Stop signal response inhibition: role of the subthalamic nucleus. J Neurosci 26: 2424–2433, 2006 - PMC - PubMed
    1. Belova MA, Paton JJ, Morrison SE, Salzman CD. Expectation modulates neural responses to pleasant and aversive stimuli in primate amygdala. Neuron 55: 970–984, 2007 - PMC - PubMed
    1. Bermudez MA, Schultz W. Reward magnitude coding in primate amygdala neurons. J Neurophysiol 104: 3424–3432, 2010 - PMC - PubMed

Publication types

LinkOut - more resources