. 2013 Feb 1;12(3):473-9.
doi: 10.4161/cc.23369. Epub 2013 Jan 16.

Immunosurveillance against tetraploidization-induced colon tumorigenesis

Affiliations

Immunosurveillance against tetraploidization-induced colon tumorigenesis

Alice Boilève et al. Cell Cycle. .

Abstract

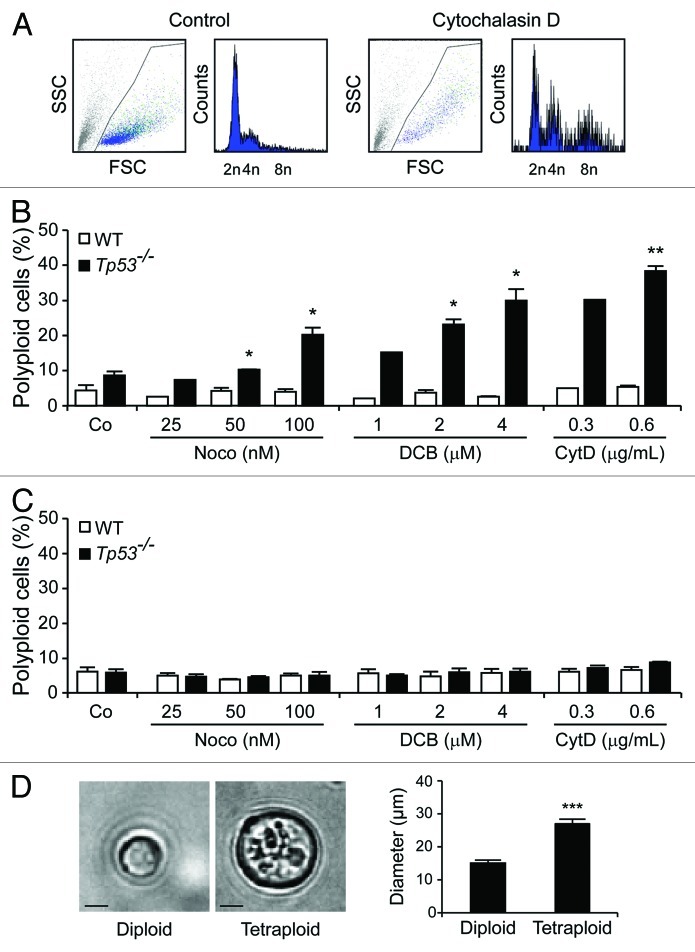
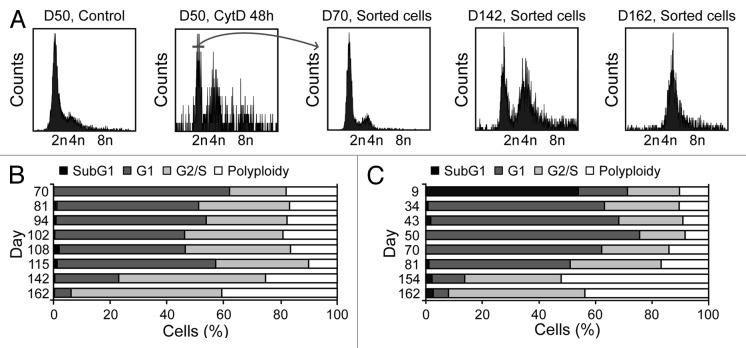
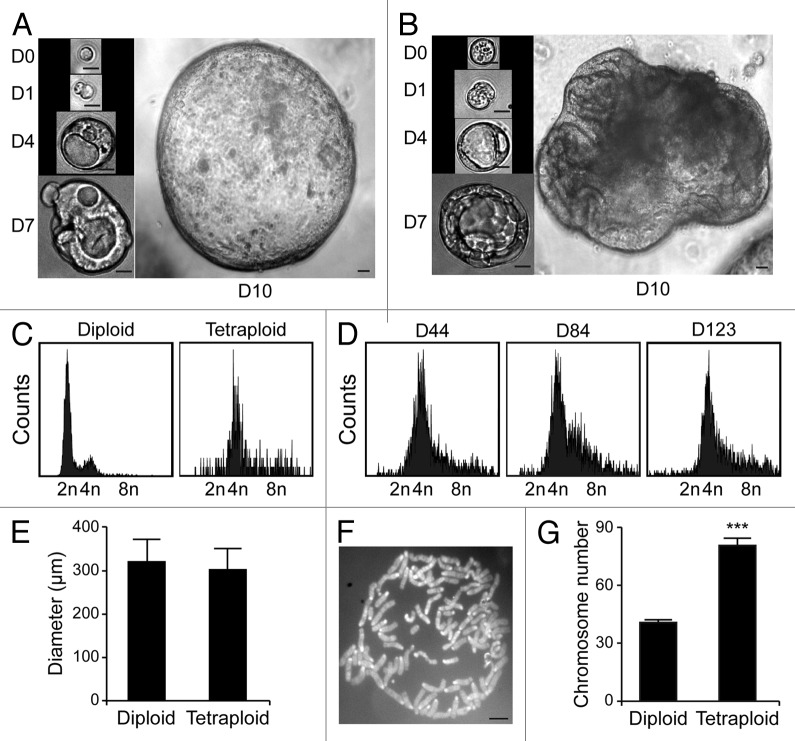
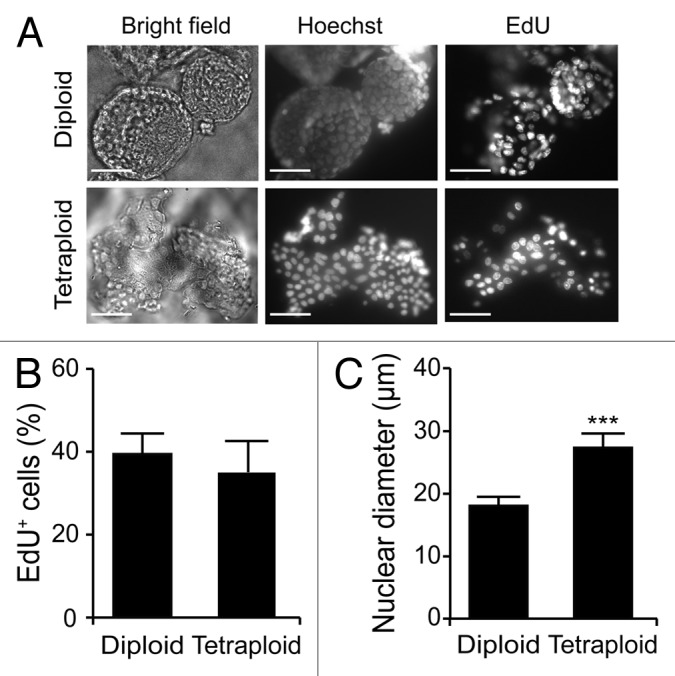
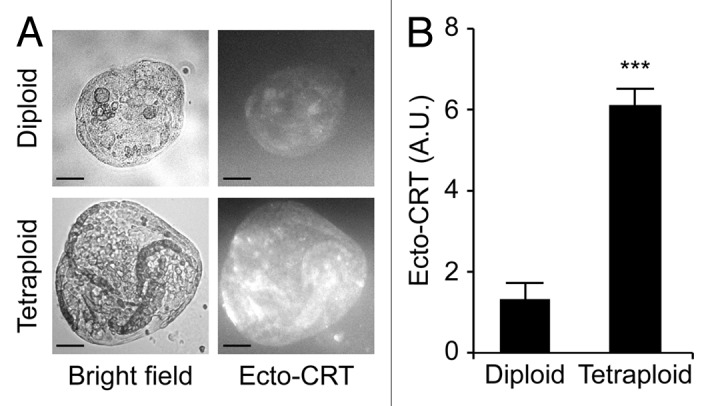
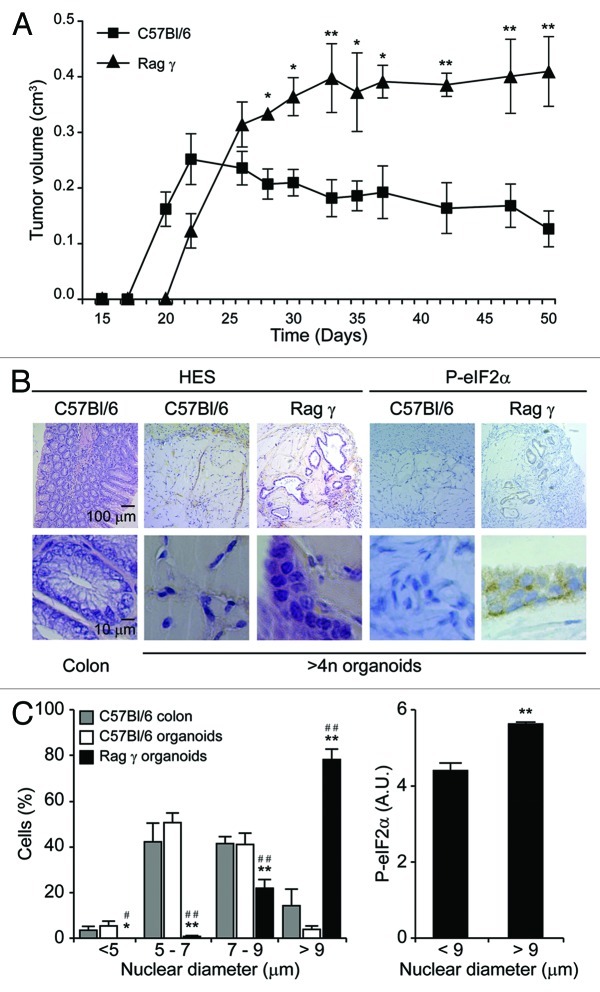
Circumstantial evidence suggests that colon carcinogenesis can ensue the transient tetraploidization of (pre-)malignant cells. In line with this notion, the tumor suppressors APC and TP53, both of which are frequently inactivated in colon cancer, inhibit tetraploidization in vitro and in vivo. Here, we show that-contrarily to their wild-type counterparts- Tp53 (-/-) colonocytes are susceptible to drug-induced or spontaneous tetraploidization in vitro. Colon organoids generated from tetraploid Tp53 (-/-) cells exhibit a close-to-normal morphology as compared to their diploid Tp53 (-/-) counterparts, yet the colonocytes constituting these organoids are characterized by an increased cell size and an elevated expression of the immunostimulatory protein calreticulin on the cell surface. The subcutaneous injection of tetraploid Tp53 (-/-) colon organoids led to the generation of proliferating tumors in immunodeficient, but not immunocompetent, mice. Thus, tetraploid Tp53 (-/-) colonocytes fail to survive in immunocompetent mice and develop neoplastic lesions in immunocompromised settings only. These results suggest that tetraploidy is particularly oncogenic in the context of deficient immunosurveillance.

Keywords: apoptosis; cell cycle; cytochalasin D; mitotic catastrophe; nocodazole; p53.


Figures

None
Figure 1. The absence of Tp53 facilitates the drug-induced tetraploidization of colonocytes. (A) DNA content analysis of cells obtained from Tp53−/− colon organoids that have been left untreated or treated with 0.6 μg/mL cytochalasin D for 48 h. (B and C) Percentage of polyploid cells (DNA content > 4n, means ± SEM, n = 1–3) developing in wild-type (WT) and Tp53−/− colon (B) or small intestine organoids (C) upon exposure to the indicated concentrations of nocodazole (Noco), dihydrocytochalasin B (DCB) and cytochalasin D (CytD). *p < 0.05, **p < 0.01, as compared to equally treated WT organoids. (D) Morphological aspects of freshly sorted diploid and tetraploid cells from Tp53−/− colon organoids, as determined by phase contrast microscopy. Representative microphotographs (scale bar = 10 μm) and quantitative data (means ± SEM, n = 10) are shown. ***p < 0.001.
None
Figure 2. Spontaneous generation of tetraploid cells from diploid Tp53−/− colon organoids. (A–C) DNA content of cells obtained from Tp53−/− colon organoids at various time points after isolation (day 0, D0). At D50, 2n cells were sorted upon transient exposure (48 h) to 0.6 μg/mL cytochalasin D (CytD), and ploidy was followed over time. Representative profiles and the sorting gate are indicated in panel (A). The DNA content of cells isolated from Tp53−/− diploid colon organoids as sorted on D50 upon CytD exposure is illustrated in (B). (C) depicts the DNA content of cells isolated from untreated Tp53−/− colon organoids over time.
None
Figure 3. Tetraploid Tp53−/− colon organoids are viable and genetically stable. (A and B) Growth of organoids originating from a freshly sorted (D0) diploid (A) or tetraploid (B) Tp53−/− cell (scale bar = 20 μm). (C) DNA content of cells obtained from diploid or tetraploid Tp53−/− clonal colon organoids 18 d after sorting. (D) DNA content of cells from a tetraploid Tp53−/− clonal colon organoid at the indicated time point after cloning. (E) Mean diameter of diploid or tetraploid Tp53−/− colon organoids 10 d after sorting (mean ± SEM, n = 15). (F) Representative chromosomal spread of a tetraploid cell (number of chromosomes = 86, scale bar = 5 μm). (G) Number of chromosomes per cell in diploid and tetraploid Tp53−/− colon organoids (means ± SEM, n = 15, ***p < 0.001).
None
Figure 4. Proliferative rate of diploid and tetraploid organoids. (A–C) Diploid and tetraploid Tp53−/− colon organoids were cultured in the presence of the thymidine analog 5-ethynyl-2'-deoxyuridine (EdU) for 1 h and then processed for the fluorescence microscopy-assisted detection of EdU+ cells. Hoechst 33342 was employed for nuclear counterstaining. (A) reports representative images (scale bar = 100 μm), while in (B and C) quantitative data on the percentage of EdU+ cells and on nuclear diameter are illustrated (means ± SEM, n = 15, ***p < 0.001).
None
Figure 5. Increased calreticulin exposure on tetraploid Tp53−/− colon organoids. (A) Representative immunofluorescence microphotographs of diploid and tetraploid Tp53−/− colon organoids stained to visualize surface-exposed calreticulin (ecto-CRT, scale bar = 100 μm). (B) Quantification of ecto-CRT-dependent fluorescence of diploid and tetraploid Tp53−/− colon organoids (means ± SEM, n = 20, ***p < 0.001).
None
Figure 6. In vivo growth of tetraploid Tp53−/− colon organoids in immunocompetent and immunodeficient mice. (A) Growth of spontaneously tetraploid Tp53−/− colon organoids inoculated s.c. in immunocompetent (C57Bl/6) and immunodeficient (Rag γ) mice on day 0 (means ± SEM, n = 5, *p < 0.05, **p < 0.01). (B and C) Tumors were recovered at the end of the experiment shown in (A) and subjected to immunohistochemistry for the visualization of phosphorylated eukaryotic initiation factor 2α (P-eIF2α) or hematoxilin and eosin (HES) staining. Normal colons obtained from C57Bl/6 mice served as controls. (B) illustrates representative histologies of tumors generated by Tp53−/− colon organoids in C57Bl/6 and Rag γ mice. In (C), quantitative results on nuclear diameter and eIF2α phosphorylation levels are provided (means ± SEM, n = 100 cells from no less than five different tumors. Left panel: *,#p < 0.05; **,##p < 0.01, as compared to normal colonocytes and tumor cells recovered from C57Bl/6, respectively. Right panel: **p < 0.01).

Comment in

References

    1. Duelli D, Lazebnik Y. Cell-to-cell fusion as a link between viruses and cancer. Nat Rev Cancer. 2007;7:968–76. doi: 10.1038/nrc2272. - DOI - PubMed
    1. Fujiwara T, Bandi M, Nitta M, Ivanova EV, Bronson RT, Pellman D. Cytokinesis failure generating tetraploids promotes tumorigenesis in p53-null cells. Nature. 2005;437:1043–7. doi: 10.1038/nature04217. - DOI - PubMed
    1. Ganem NJ, Storchova Z, Pellman D. Tetraploidy, aneuploidy and cancer. Curr Opin Genet Dev. 2007;17:157–62. doi: 10.1016/j.gde.2007.02.011. - DOI - PubMed
    1. Davoli T, Denchi EL, de Lange T. Persistent telomere damage induces bypass of mitosis and tetraploidy. Cell. 2010;141:81–93. doi: 10.1016/j.cell.2010.01.031. - DOI - PMC - PubMed
    1. Vitale I, Galluzzi L, Senovilla L, Criollo A, Jemaa M, Castedo M, et al. Illicit survival of cancer cells during polyploidization and depolyploidization. Cell Death Differ. 2011;18:1403–13. doi: 10.1038/cdd.2010.145. - DOI - PMC - PubMed

Publication types

MeSH terms