. 2013 Jan 16:14:34.
doi: 10.1186/1471-2164-14-34.

Developmentally regulated expression and complex processing of barley pri-microRNAs

Affiliations

Developmentally regulated expression and complex processing of barley pri-microRNAs

Katarzyna Kruszka et al. BMC Genomics. .

Abstract

Background: MicroRNAs (miRNAs) regulate gene expression via mRNA cleavage or translation inhibition. In spite of barley being a cereal of great economic importance, very little data is available concerning its miRNA biogenesis. There are 69 barley miRNA and 67 pre-miRNA sequences available in the miRBase (release 19). However, no barley pri-miRNA and MIR gene structures have been shown experimentally. In the present paper, we examine the biogenesis of selected barley miRNAs and the developmental regulation of their pri-miRNA processing to learn more about miRNA maturation in barely.

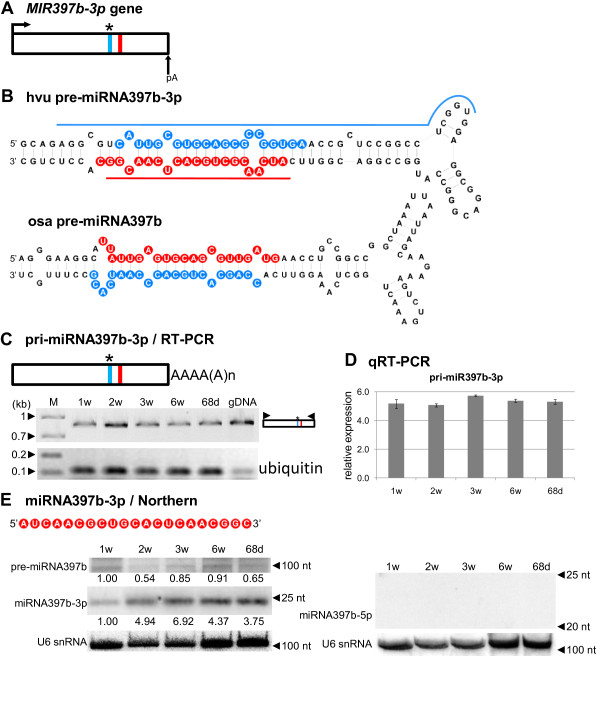
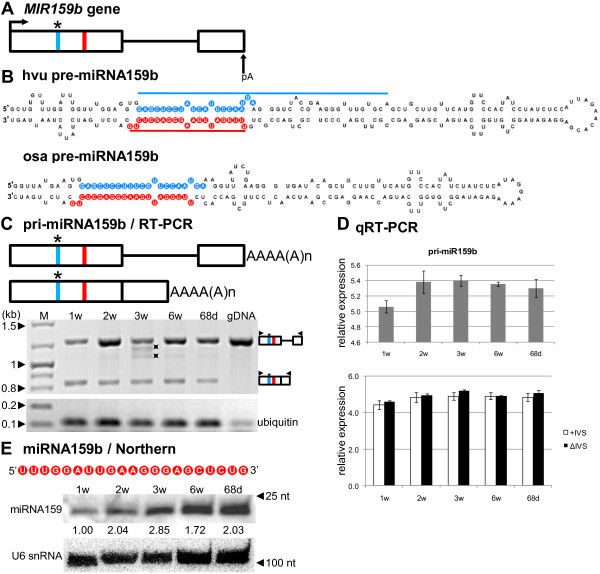
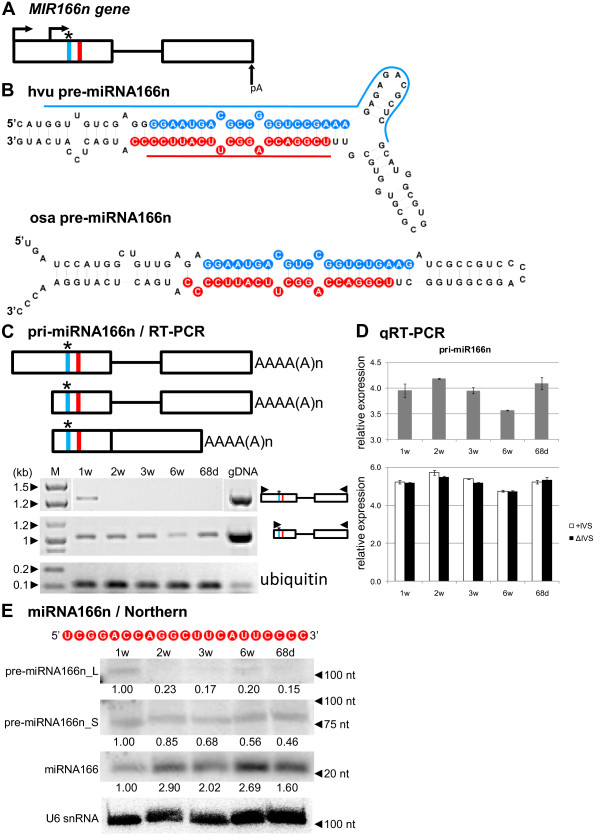
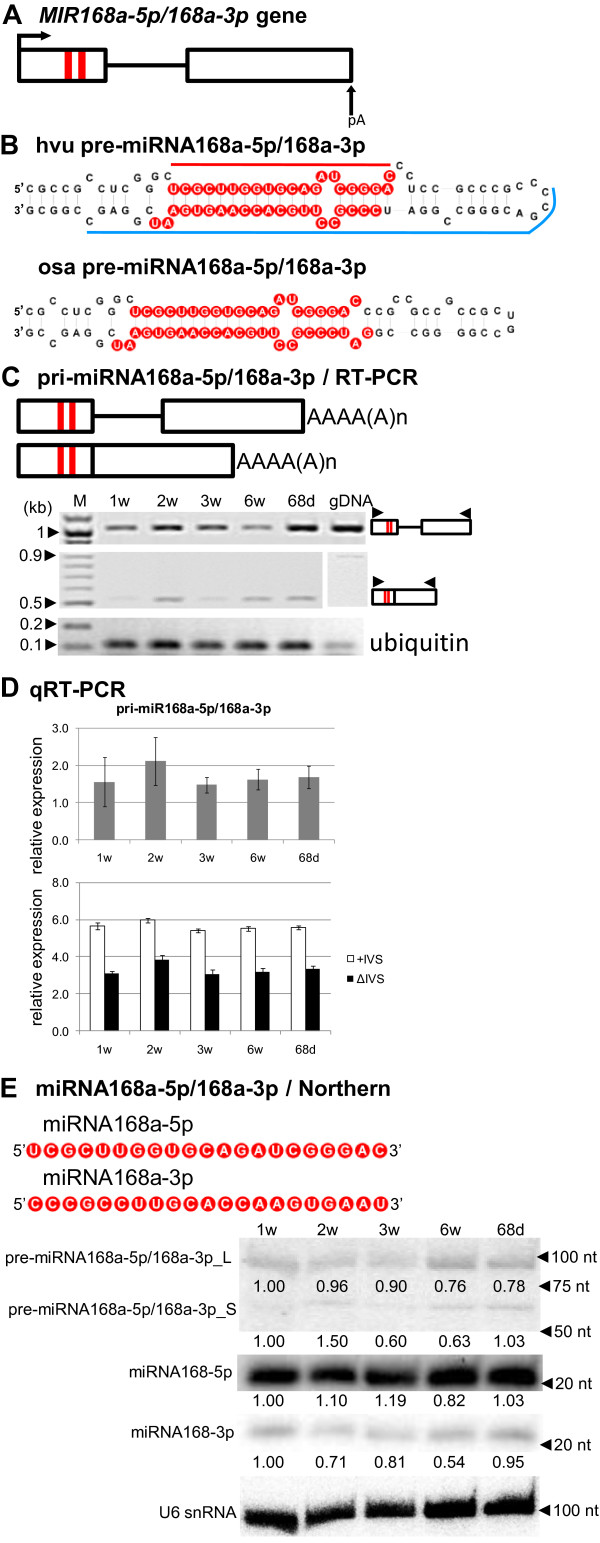
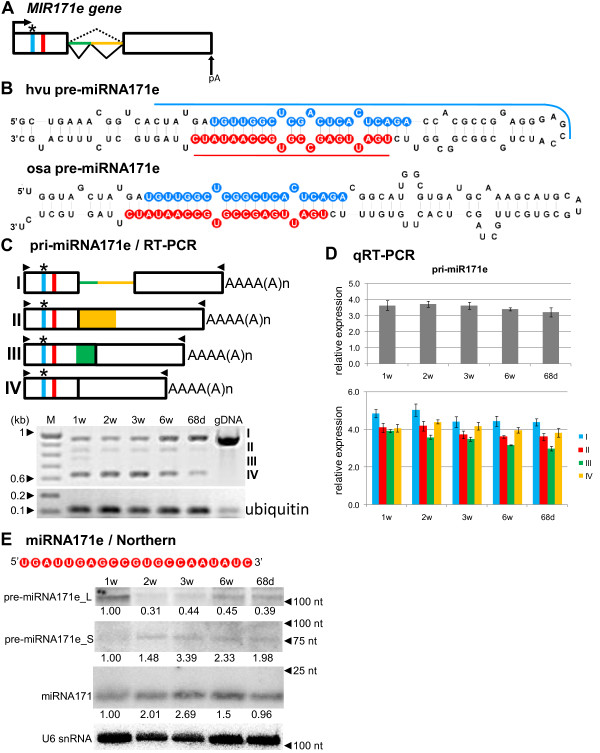
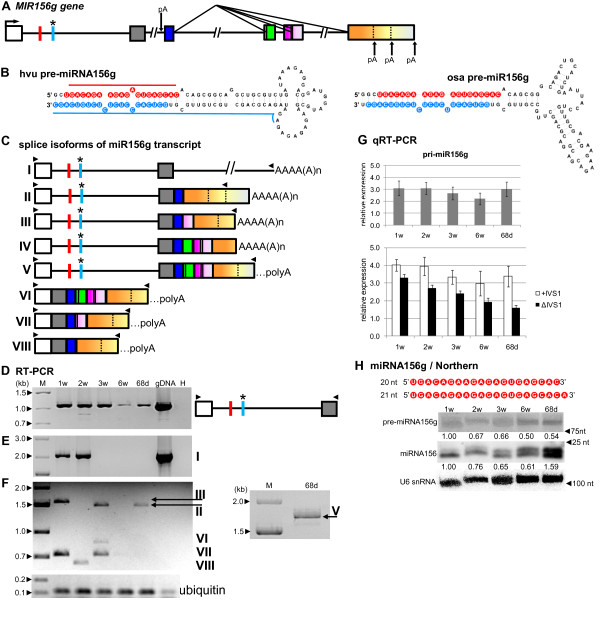
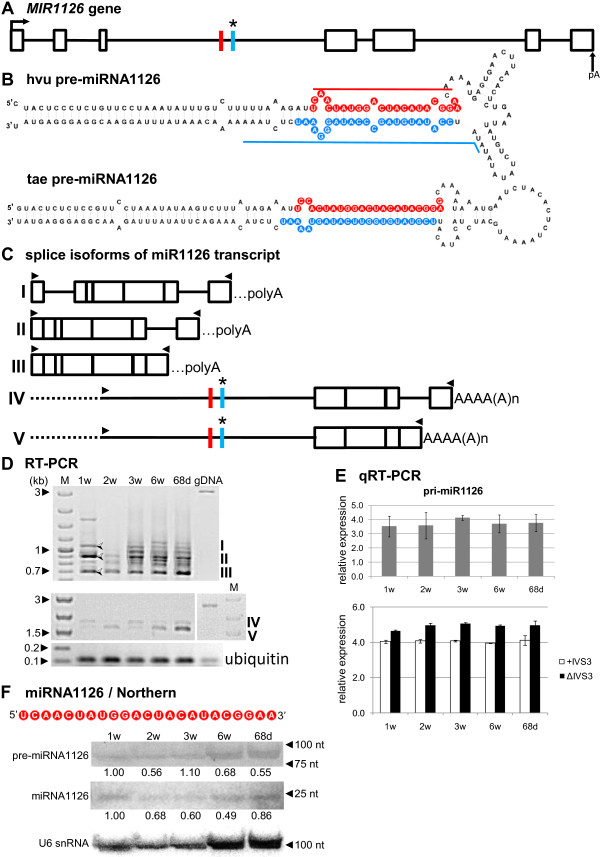
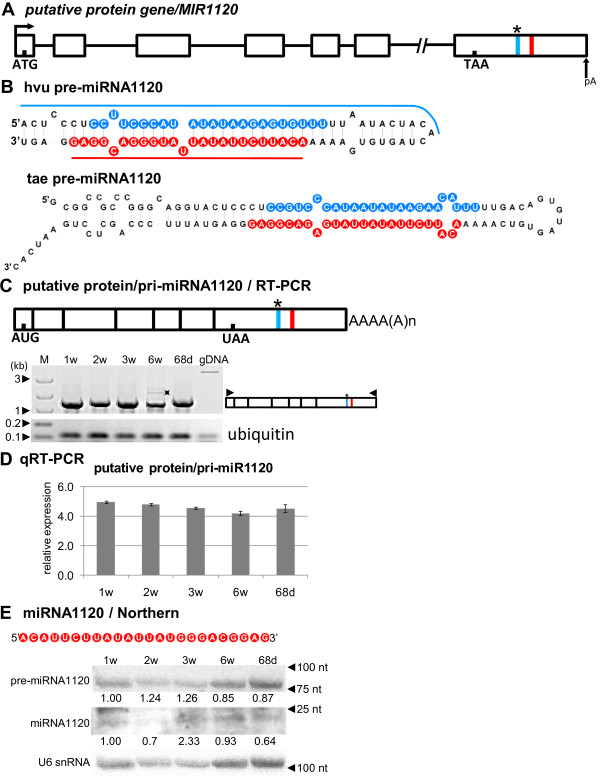
Results: To investigate the organization of barley microRNA genes, nine microRNAs - 156g, 159b, 166n, 168a-5p/168a-3p, 171e, 397b-3p, 1120, and 1126 - were selected. Two of the studied miRNAs originate from one MIR168a-5p/168a-3p gene. The presence of all miRNAs was confirmed using a Northern blot approach. The miRNAs are encoded by genes with diverse organizations, representing mostly independent transcription units with or without introns. The intron-containing miRNA transcripts undergo complex splicing events to generate various spliced isoforms. We identified miRNAs that were encoded within introns of the noncoding genes MIR156g and MIR1126. Interestingly, the intron that encodes miR156g is spliced less efficiently than the intron encoding miR1126 from their specific precursors. miR397b-3p was detected in barley as a most probable functional miRNA, in contrast to rice where it has been identified as a complementary partner miRNA*. In the case of miR168a-5p/168a-3p, we found the generation of stable, mature molecules from both pre-miRNA arms, confirming evolutionary conservation of the stability of both species, as shown in rice and maize. We suggest that miR1120, located within the 3' UTR of a protein-coding gene and described as a functional miRNA in wheat, may represent a siRNA generated from a mariner-like transposable element.

Conclusions: Seven of the eight barley miRNA genes characterized in this study contain introns with their respective transcripts undergoing developmentally specific processing events prior to the dicing out of pre-miRNA species from their pri-miRNA precursors. The observed tendency to maintain the intron encoding miR156g within the transcript, and preferences in splicing the miR1126-harboring intron, may suggest the existence of specific regulation of the levels of intron-derived miRNAs in barley.


Figures

Figure 1
Figure 1
Schematic representation of the MIR397b-3p gene and its precursors. Detection of pri-, pre- and mature miR397b-3p. (A) MIR397b-3p gene structure; left arrow indicates putative transcription start site; arrow marked as pA depicts precursor polyadenylation site. (B) pre-miRNA397b-3p hairpin structure (ΔG=−70.8 kcal/mol) and its rice orthologue (ΔG=−51.2 kcal/mol); the blue line indicates the region of the pre-miRNA from which the hybridization probe for precursor detection was designed, while the red line highlights the probe for detection of the mature miRNA. (C) Structure of pri-miRNA397b-3p (upper panel); RT-PCR analysis of its expression in five barley developmental stages (lower panel); primer positions are marked by black triangles on the pri-miRNA graph. (D) Real-time PCR measurements of pri-miRNA397b-3p expression level; bars on a chart represent standard deviation. Values are shown as the mean ± SD (n=3) from three independent experiments. (E) Nucleotide sequence of the mature miRNA397b-3p molecule; detection of pre-miRNA (left upper panel), mature miR397b-3p (left middle panel), and miR397b-5p (right panel) using Northern hybridization. U6 was used as a loading control. The level of pre-miRNA and miRNA in 1-week-old plants was arbitrarily assumed to be ‘1’, and the levels of pre-miRNA and miRNA were quantified relative to this at all other developmental stages. The miRNA is marked in red, the miRNA* in blue; 1w: one-week-old seedlings, 2w: two-week-old seedlings, 3w: three-week-old plants, 6w: six-week-old plants, 68d: 68-day-old plants, gDNA: genomic DNA; M - GeneRuler 100 bp Plus or 1kb Plus DNA Ladders.
Figure 2
Figure 2
Schematic representation of the MIR159b gene and its precursors. Detection of pri- and mature miR159b. (A) MIR159b gene structure. (B) pre-miRNA159b hairpin structure (ΔG=−95 kcal/mol) and its rice orthologue (ΔG=−79.3 kcal/mol); blue and red lines indicate hybridization regions as described in Figure  1 (C) pri-miRNA159b structures (upper panel) and RT-PCR analysis of their expression in five barley developmental stages studied (lower panel). (D) Real-time PCR measurements of total pri-miRNA159b expression level (upper graph) and its spliced (ΔIVS) and unspliced variants (+IVS) (lower graph); bars on the charts represent standard deviation. Values are shown as the mean ±SD (n=3) from three independent experiments. (E) Nucleotide sequence of the mature miR159b molecule, and detection of mature miR159b using Northern hybridization. U6 was used as a loading control. The levels of pre-miRNAs and miRNA were calculated as described in Figure  1. Colors, abbreviations, and symbols as in Figure  1; asterisks next to bands on agarose gel mark nonspecific products.
Figure 3
Figure 3
Schematic representation of the MIR166n gene and its precursors. Detection of pri-, pre- and mature miR166n. (A) MIR166n gene structure. (B) pre-miRNA166n hairpin structure (ΔG=−61 kcal/mol) and its rice orthologue (ΔG=−52.3 kcal/mol); blue and red lines indicate hybridization regions as described in Figure  1. (C) pri-miRNA166n structures (upper panel); RT-PCR analysis of their expression in five barley developmental stages studied (lower panel). (D) Real-time PCR measurements of total pri-miRNA166n expression level (upper graph) and its spliced (ΔIVS) and unspliced variants (+IVS) (lower graph); bars on the charts represent standard deviation. Values are shown as the mean ±SD (n=3) from three independent experiments. (E) Nucleotide sequence of the mature miR166n molecule, and detection of pre-miRNA166n long (L) and short (S) intermediates, and mature miR166n using Northern hybridization. U6 was used as a loading control. The levels of pre-miRNAs and miRNA were calculated as described in Figure  1. Colors, abbreviations, and symbols as in Figure  1.
Figure 4
Figure 4
Schematic representation of the MIR168a-5p/168-3p gene and its precursors. Detection of pri-, pre-, and mature miR168-5p and miR168a-3p. (A) MIR168a-5p/168-3p gene structure. (B) pre-miRNA168a-5p/168-3p hairpin structure (ΔG=−60.7 kcal/mol) and its rice orthologue (ΔG=−52.2 kcal/mol); blue and red lines indicate hybridization regions as described in Figure  1. (C) pri-miRNA168a-5p/168-3p structures (upper panel) and RT-PCR analysis of their expression in five barley developmental stages (lower panel). (D) Real-time PCR measurements of pri-miRNA miRNA168a-5p/168-3p expression levels (upper graph) and its spliced (ΔIVS) and unspliced variants (+IVS) (lower graph); bars on the charts represent standard deviation. Values are shown as the mean ±SD (n=3) from three independent experiments. (E) Nucleotide sequences of the mature miR168a-5p and miR168a-3p molecules, and Northern detection of pre-miRNA168a-5p/168-3p long (L) and short (S) intermediates, mature miR168-5p and miR168a-3p. U6 was used as a loading control. The levels of pre-miRNAs and miRNA were calculated as described in Figure  1. Colors, abbreviations, and symbols as in Figure  1; asterisk next to band on agarose gel marks nonspecific product.
Figure 5
Figure 5
Schematic representation of the MIR171e gene and its precursors. Detection of pri-, pre- and mature miR171e. (A) MIR171e gene structure. (B) pre-miRNA171e hairpin structure (ΔG=−59.1 kcal/mol) and its rice orthologue (ΔG=−58.9 kcal/mol); blue and red lines indicate hybridization regions as described in Figure  1. (C) pri-miRNA171e structures (upper panel), green and yellow colors show alternatively retained transcript fragments as a consequence of alternative splicing events; RT-PCR detection of pri-miRNA171e expression in five barley developmental stages (lower panel). (D) Real-time PCR measurements of total pri-miRNA171e expression levels (upper graph) and its splice variants (I–IV) (lower graph); bars on the charts represent standard deviation. Values are shown as the mean ± SD (n=3) from three independent experiments. (E) Nucleotide sequence of the mature miR171e molecule, detection of pre-miRNA171e long (L) and short (S) intermediates, and mature miR171e using Northern hybridization. U6 was used as a loading control. The levels of pre-miRNAs and miRNA were calculated as described in Figure  1. Colors, abbreviations, and symbols as in Figure  1.
Figure 6
Figure 6
Schematic representation of the MIR156g gene and its precursors. Detection of pri-, pre- and mature miR156g. (A) MIR156g gene structure; thin black vertical bars within exons show additional splice sites identified during pri-miRNA156g analyses; dotted-vertical lines within the last exon together with pA symbols denote polyadenylation sites. (B) pre-miRNA156g hairpin structure (ΔG=−65.85 kcal/mol) and its rice orthologue (ΔG=−61.2 kcal/mol); blue and red lines indicate hybridization regions as described in Figure  1. (C) Structures of splice isoforms (I–VIII) of the miR156g transcript; …polyA indicates a putative polyA site in splice isoforms as the determination of an accurate polyA site for PCR products is not possible. (D) RT-PCR analysis of first intron retention throughout barley plant life stages. (E–F) pri-miRNA156g RT-PCR expression analysis in five barley developmental stages. Arrows on agarose gel indicate splice isoforms II, III and V. (G) Real-time PCR measurements of total pri-miRNA156g expression levels (upper graph) and pri-miR156g fragments carrying the first intron (+IVS1) and after the first intron splicing (ΔIVS1) (lower graph); bars on the charts represent standard deviation. Values are shown as the mean ±SD (n=3) from three independent experiments. (H) Nucleotide sequence of the mature miR156g molecule, and detection of pre-miRNA and mature miR156g using Northern hybridization. U6 was used as a loading control. The levels of pre-miRNAs and miRNA were calculated as described in Figure  1. Colors, abbreviations, and symbols as in Figure  1. Additional colors depict alternatively spliced exons in the pri-miRNA.
Figure 7
Figure 7
Schematic representation of the MIR1126 gene and its precursors. Detection of pri-, pre- and mature miR1126. (A) MIR1126 gene structure. (B) pre-miRNA1126 hairpin structure (ΔG=−78.4 kcal/mol) and its wheat orthologue (ΔG=−73.27 kcal/mol); blue and red lines indicate hybridization regions as described in Figure  1. (C) Structures of splice isoforms (I–V) of the miR1126 transcript; dashed lines represents unamplified 5 fragments of the noncoding RNA isoforms IV and V; …polyA indicates a putative polyA site in splice isoforms as the determination of an accurate polyA site for PCR products is not possible. (D) RT-PCR expression analysis of splice isoforms (I–V) of the miR1126 transcript in all barley developmental stages studied. Half-open arrows on agarose gel indicate specific, identified products. (E) Real-time PCR measurements of total pri-miRNA1126 expression levels (upper graph) and pri-miR1126 fragments carrying the third intron (+IVS3) and after the third intron splicing (ΔIVS3) (lower graph); bars on the charts represent standard deviation. Values are shown as the mean ±SD (n=3) from three independent experiments. (F) Nucleotide sequence of the mature miR1126 molecule, and detection of pre-miRNA and mature miR1126 using Northern hybridization. U6 was used as a loading control. The levels of pre-miRNAs and miRNA were calculated as described in Figure  1. Colors, abbreviations, and symbols as in Figure  1.
Figure 8
Figure 8
Schematic representation of the MIR1120 gene and its precursor. Detection of pri-, pre- and mature miR1120. (A) MIR1120 gene structure; black squares in the gene and pri-miRNA1120 schemes show position of the ORF. (B) pre-miRNA1120 hairpin structure (ΔG=−42.3 kcal/mol) and its wheat orthologue (ΔG=−63.5 kcal/mol); blue and red lines indicate hybridization regions as described in Figure  1. (C) pri-miRNA1120 structure and RT-PCR expression analysis in the five barley developmental stages studied. (D) Real-time PCR measurements of total pri-miRNA1120 expression levels; bars on a chart represent standard deviation. Values are shown as the mean ± SD (n=3) from three independent experiments. (E) Nucleotide sequence of the mature miR1120 molecule, and detection of pre-miRNA and mature miR1120 using Northern hybridization. U6 was used as a loading control. The level of pre-miRNAs and miRNA was calculated as described in Figure  1. Colors, abbreviations, and symbols as in Figure  1. Asterisk on agarose gel indicates unspecific product.

Similar articles

Cited by

References

    1. Lee RC, Feinbaum RL, Ambros V. The C. elegans heterochronic gene lin-4 encodes small RNAs with antisense complementarity to lin-14. Cell. 1993;75:843–854. doi: 10.1016/0092-8674(93)90529-Y. - DOI - PubMed
    1. Llave C, Kasschau KD, Rector MA, Carringon JC. Endogenous and silencing-associated small RNAs in plants. Plant Cell. 2002;14:1605–1619. doi: 10.1105/tpc.003210. - DOI - PMC - PubMed
    1. Reinhart BJ, Weinstein EG, Rhoades MW, Bartel B, Bartel DP. MicroRNAs in plants. Genes Dev. 2002;16:1616–1626. doi: 10.1101/gad.1004402. - DOI - PMC - PubMed
    1. Jones-Rhoades MW, Bartel DP. Computational identification of plant microRNAs and their targets, including a stress-induced miRNA. Mol Cell. 2004;14:787–799. doi: 10.1016/j.molcel.2004.05.027. - DOI - PubMed
    1. Nozawa M, Miura S, Nei M. Origins and evolution of microRNA genes in plant species. Genome Biol Evol. 2012;4:230–239. doi: 10.1093/gbe/evs002. - DOI - PMC - PubMed

Publication types