Meta-Analysis
. 2013 Jan 16:14:4.
doi: 10.1186/1471-2164-14-4.

Comprehensive meta-analysis of Signal Transducers and Activators of Transcription (STAT) genomic binding patterns discerns cell-specific cis-regulatory modules

Affiliations
Meta-Analysis

Comprehensive meta-analysis of Signal Transducers and Activators of Transcription (STAT) genomic binding patterns discerns cell-specific cis-regulatory modules

Keunsoo Kang et al. BMC Genomics. .

Abstract

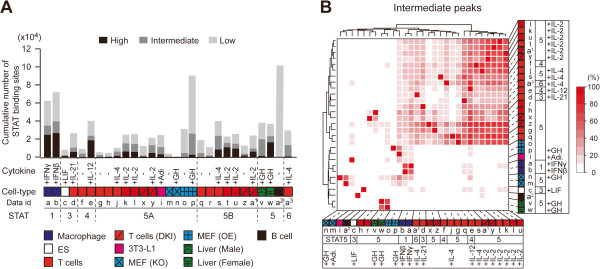
Background: Cytokine-activated transcription factors from the STAT (Signal Transducers and Activators of Transcription) family control common and context-specific genetic programs. It is not clear to what extent cell-specific features determine the binding capacity of seven STAT members and to what degree they share genetic targets. Molecular insight into the biology of STATs was gained from a meta-analysis of 29 available ChIP-seq data sets covering genome-wide occupancy of STATs 1, 3, 4, 5A, 5B and 6 in several cell types.

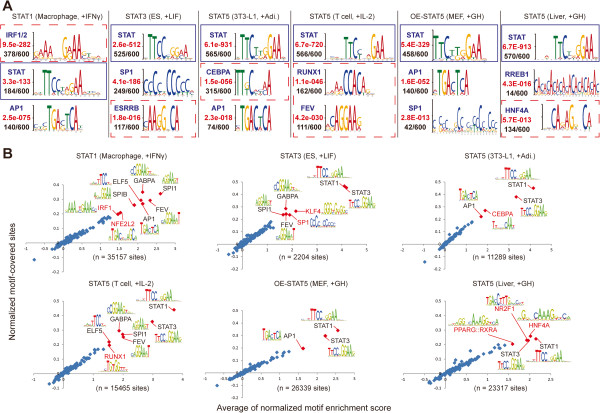
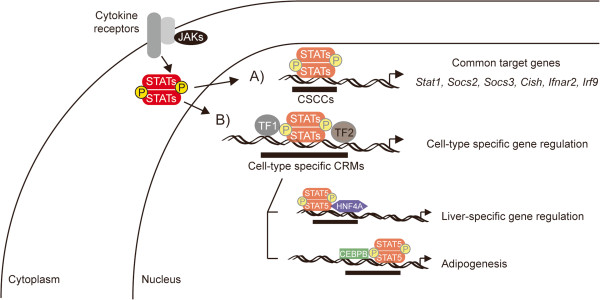
Results: We determined that the genomic binding capacity of STATs is primarily defined by the cell type and to a lesser extent by individual family members. For example, the overlap of shared binding sites between STATs 3 and 5 in T cells is greater than that between STAT5 in T cells and non-T cells. Even for the top 1,000 highly enriched STAT binding sites, ~15% of STAT5 binding sites in mouse female liver are shared by other STATs in different cell types while in T cells ~90% of STAT5 binding sites are co-occupied by STAT3, STAT4 and STAT6. In addition, we identified 116 cis-regulatory modules (CRM), which are recognized by all STAT members across cell types defining a common JAK-STAT signature. Lastly, in liver STAT5 binding significantly coincides with binding of the cell-specific transcription factors HNF4A, FOXA1 and FOXA2 and is associated with cell-type specific gene transcription.

Conclusions: Our results suggest that genomic binding of STATs is primarily determined by the cell type and further specificity is achieved in part by juxtaposed binding of cell-specific transcription factors.


Figures

Figure 1
Figure 1
Genome-wide STAT binding sites in different cell-types. (A) The number of STAT binding sites identified in various cell types is shown as a bar graph ranging from few hundreds to one hundred thousand. STAT binding sites in each sample were categorized into three confidence classes (high, intermediate and low) based on the number of detections by three peak-calling algorithms, MACS, HOMER and Qeseq. Detailed information (data ids) about ChIP-seq data sets used in this study can be found in Additional file 2, and the analysis pipeline is described in Additional file 1. (B) Heat map shows the unsupervised clustering of 29 samples according to genome-wide STAT binding sites, using a 500-bp window. The percentage of overlapping sites between two samples (x-axis over y-axis) was calculated and used to draw the heat map. OE, Stat5−/− MEFs overexpressing STAT5A; DKI, STAT5 mutant that prevents the formation of tetramers; KO, STAT5A knock-out; MEF, mouse embryonic fibroblast; ES, embryonic stem cells; 3T3-L1, pre-adipocyte cells; GH, growth hormone; IL, interleukin; Adi., adipogenic inducers; IFNγ, interferon-gamma; IFNβ, interferon-beta; LIF, Leukemia inhibitory factor.
Figure 2
Figure 2
Shared and distinct sites of occupation. Hierarchical clustering (average linkage algorithm) was performed with normalized ChIP-seq tags (tags per 10 million), which are located within +/− 1.5 kb flanking regions of the top 1000 STAT peak centers (determined by height of peaks in each condition). GAS motifs were identified within +/− 75 bp flanking regions of the top sites using the MOODS algorithm (p value < 0.01) [26]. Rows represent the top 1000 STAT binding sites in the given cell type (top label) and red vertical lines in tracks indicate the binding of STAT under specific conditions (bottom labels). (A) STAT1 peak centered in macrophages with IFNγ stimulation. (B) STAT3 peak centered in ES cells with LIF stimulation. (C) STAT5 peak centered in 3T3-L1 cells with adipogenic inducers. (D) STAT5 peak centered in T cells with IL-2 stimulation. (E) STAT5 peak centered in STAT5A overexpressing MEF with growth hormone. (F) STAT5 peak centered in female liver with growth hormone.
Figure 3
Figure 3
Characterization of common STAT binding sites. (A) Sequence conservation of shared STAT binding regions was calculated and averaged using PhastCons score. The x-axis indicates the number of overlaps by any of the STAT binding sites. Two random sets were generated (same number of regions – high / intermediate sets) for comparison. Pearson’s correlation coefficient r = 0.95 (high), r = 0.69 (intermediate), r = 0.04 (random1) and r = 0.53 (random2). (B) Distributions of STAT-associated CRMs and all STAT binding sites were estimated. The ‘others’ category includes 5- and 3-UTRs. (C) Statistically significant pathways associated with the genes near CRCCs were inferred using the GREAT tool with the following default settings; Basal plus extension – proximal: 5 kb upstream and 1kb downstream / distal: up to 1000 kb [28]. P-value is the Bonferroni corrected binomial P-value. (D) STATs 1, 3, 4, 5 and 6 can bind to the same sites in similar or different cell contexts. Six loci encoding Stat1, Socs2, Socs3, Cish, Ifnar2 and Irf9 are shown. Red vertical bars overlapping peaks indicate the binding regions of STATs 1, 3, 4, 5 and 6 shared between several cell types, while blue vertical bars represent the sites with unique context-dependent STAT binding. The bottom panel depicts positions of peak summits and sequence conservation as well as GAS motifs (TTCnnnGAA, perfect match) at the STAT binding regions. The total number of tags in ChIPed samples was normalized to the corresponding input using the wignorm program [24] and the y-axis scale was adjusted according to this normalized value using auto-scale function of the UCSC genome browser. Red asterisks denote peak centers.
Figure 4
Figure 4
Cell specificity of transcription factor binding motifs associated with STATs. (A) Distinct sets of specific TFBSs were identified in six representative cell types (Figure 2) within +/− 75 bp of the STAT binding peak centers using the MEME-ChIP de novo motif identification program [35]. Top three motifs are shown. The statistical significance of the motifs was estimated using E-value (red) and motif occurrence (black) as described previously [35]. The blue and red dashed boxes indicate the identified GAS motifs and cell-type specific TF binding motifs, respectively. (B) All motif occurrences on the intermediate-confidence STAT binding sites (+/− 75 bp of the peak center) were calculated using the MOODS algorithm with 130 position-frequency matrices available on the JASPAR website (p value <  0.001). The x-axis and y-axis indicate the mean average of normalized motif enrichment scores and motif-covered sites, respectively. Each dot represents a single TFBS and red dots show significantly associated co-TFs (normalized proportion > 0.2 and average of normalized motif enrichment score > 1.5). Red letters indicate TFBSs unique to the given cell-type.
Figure 5
Figure 5
Cell-specific combinations of STAT5 binding with other transcription factors in mouse liver and 3T3-L1 cells. (A) Average fold change graphs of nine TF ChIP-seq data sets were superimposed on STAT binding sites of six representative cell-types (Figure 2). The fold change was calculated using the wignorm program which estimates fold change between treatment (ChIPed) value to local bias (control, either IgG or input DNA) [24]. Non-significant graphs were colored grey (bottom). The following data sets were downloaded from the GEO website and processed; GSE17067 – p300, E2F4, CEBPA, FOXA1 and FOXA2 in liver and p300, E2F4 and CEBPA in 3 T3-L1 cells; GSE22078 – HNF4A in liver; GSE27826 – CEBPB, CEBPD and GR in 3 T3-L1 cells. (B) Expression level (RPKM, reads per kilobase of transcript per million mapped reads) of genes in each tissue was measured using the Cufflinks program [45] with an available RNA-seq data set (GSE29278) [46]. The number of genes located near given STAT-associated CRMs (−10 kb ~ TSS ~ +10 kb) is shown (left panel). These genes were defined as STAT-associated. P-value was empirically calculated by the Monte Carlo simulation [47] with 10000 iterations. The same number of tested genes was randomly selected. Bar graph and red rhombus represent expression levels of STAT-associated genes and the P-values in the given cell type, respectively. Asterisk, P-value < 0.1.
Figure 6
Figure 6
Model defining STAT-mediated common and cell-type specific gene regulation. STATs regulate gene sets upon binding to cognate GAS sites located in STAT-controlled CRMs (SCCs). A) Common Global STAT targets. 116 common STAT controlled CRMs (CSCCs) have been identified. These CSCCs bind any STAT member in every cell type tested. B) STAT controlled cell-specific CRMs. STAT binding coincides with cell-specific transcription factor binding as exemplified for liver and adipocytes. STAT5 binding in liver tissue and adipocytes coincides with genes that are also recognized by HNF4A and CEBPB, respectively.

Similar articles

Cited by

References

    1. Arbouzova NI, Zeidler MP. JAK/STAT signalling in Drosophila: insights into conserved regulatory and cellular functions. Development. 2006;133:2605–2616. doi: 10.1242/dev.02411. - DOI - PubMed
    1. Levy DE, Darnell JE. Stats: transcriptional control and biological impact. Nat Rev Mol Cell Biol. 2002;3:651–662. - PubMed
    1. Hennighausen L, Robinson GW. Interpretation of cytokine signaling through the transcription factors STAT5A and STAT5B. Genes Dev. 2008;22:711–721. doi: 10.1101/gad.1643908. - DOI - PMC - PubMed
    1. Malin S, McManus S, Cobaleda C, Novatchkova M, Delogu A, Bouillet P, Strasser A, Busslinger M. Role of STAT5 in controlling cell survival and immunoglobulin gene recombination during pro-B cell development. Nat Immunol. 2010;11:171–179. - PMC - PubMed
    1. Ho L, Miller EL, Ronan JL, Ho WQ, Jothi R, Crabtree GR. esBAF facilitates pluripotency by conditioning the genome for LIF/STAT3 signalling and by regulating polycomb function. Nat Cell Biol. 2011;13:903–913. doi: 10.1038/ncb2285. - DOI - PMC - PubMed

Publication types

Substances