Clinical Trial
. 2013 Jan 16:10:10.
doi: 10.1186/1742-2094-10-10.

BAFF/APRIL system in pediatric OMS: relation to severity, neuroinflammation, and immunotherapy

Affiliations
Clinical Trial

BAFF/APRIL system in pediatric OMS: relation to severity, neuroinflammation, and immunotherapy

Michael R Pranzatelli et al. J Neuroinflammation. .

Abstract

Background: B-cell dysregulation has been implicated but not fully characterized in pediatric opsoclonus-myoclonus syndrome (OMS), a neuroblastoma-associated neuroinflammatory disorder.

Objective: To assess the role of B-cell activating factor (BAFF) and a proliferation-inducing ligand (APRIL), two critical B cell-modulating cytokines, as potential biomarkers of disease activity and treatment biomarkers in OMS.

Methods: Soluble BAFF and APRIL were measured in cerebrospinal fluid (CSF) and serum by ELISA in 433 children (296 OMS, 109 controls, 28 other inflammatory neurological disorders (OIND)). BAFF-R receptors on circulating CD19+ B cells were measured by flow cytometry. A blinded scorer rated motor severity on the OMS Evaluation Scale. Immunotherapies were evaluated cross-sectionally and longitudinally.

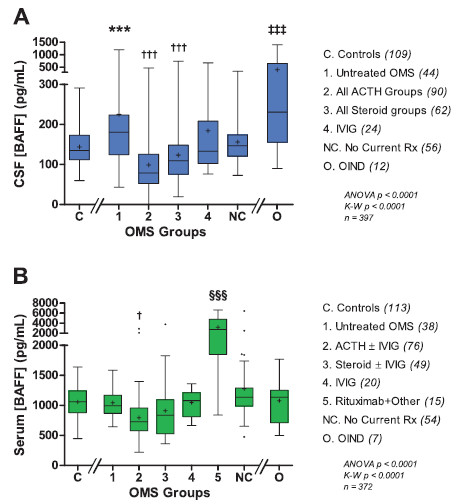
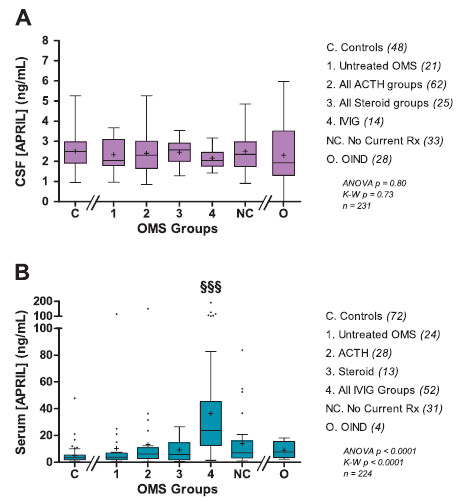
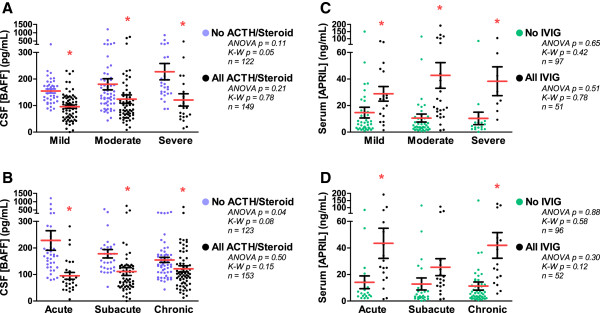
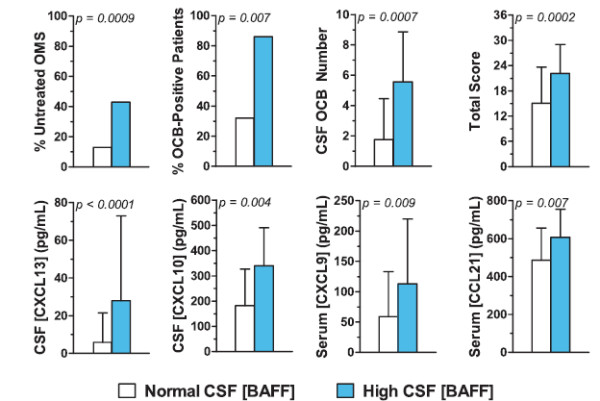
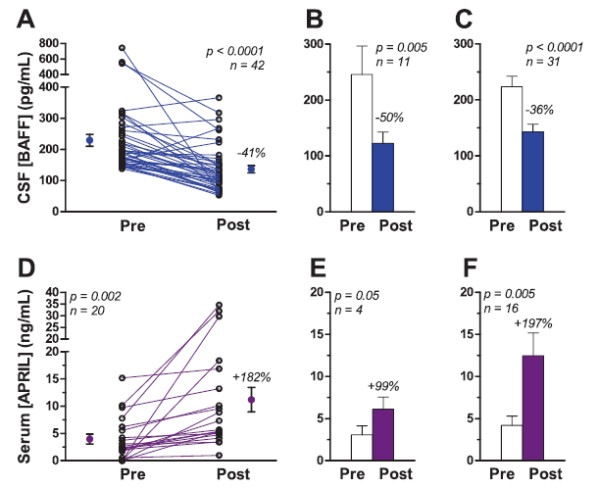
Results: The mean CSF BAFF concentration, which was elevated in untreated OMS and OIND, correlated with OMS severity category (P = 0.006), and reduction by adrenocorticotropic hormone or corticotropin (ACTH) (-61%) or corticosteroids (-38%) was seen at each level of severity. In contrast, CSF APRIL was normal in OMS and OIND and unaffected by immunotherapy. When the entire OMS dataset was dichotomized into 'high' versus 'normal' CSF BAFF concentration, the phenotype of the high group included greater motor severity and number of CSF oligoclonal bands, and a higher concentration of inflammatory chemokines CXCL13 and CXCL10 in CSF and CXCL9 and CCL21 in serum. Serum APRIL was 6.7-fold higher in the intravenous immunoglobulins (IVIg) group, whereas serum BAFF was 2.6-fold higher in the rituximab group. The frequency of B cell BAFF-R expression was similar in untreated and treated OMS. Longitudinal studies of CSF BAFF revealed a significant decline in ACTH-treated patients (with or without rituximab) (P < 0.0001). Longitudinal studies of serum APRIL showed a 2.9-fold increase after 1 to 2 g/kg IVIg monotherapy (P = 0.0003).

Conclusions: Striking distinctions in BAFF/APRIL signaling were found. OMS displayed heterogeneity in CSF BAFF expression, which met many but not all criteria as a potential biomarker of disease activity. We speculate that CSF BAFF may have more utility in a biomarker panel than as a stand-alone biomarker, and that the selective upregulation of both serum APRIL by IVIg and BAFF by rituximab, as well as downregulation of CSF BAFF by ACTH/steroids, may have utility as treatment biomarkers.


Figures

Figure 1
Figure 1
Cross-sectional BAFF concentrations. (A) CSF BAFF. Box and whisker graphs depict the mean as a plus sign, the median as a line within the box, interquartile ranges as the upper and lower box lines, and the range as Tukey error bars. Primary statistical comparisons were of means for untreated OMS versus controls (*) and treated versus untreated OMS (†). Statistical significance level is indicated by the number of symbols: * 0.05 > P ≥0.01, *** P ≤0.0001. The pre-bundled treatment groups were ACTH (n = 37), steroids (n = 22), IVIG (n = 24), ACTH + IVIg (n = 39), steroids + IVIg (n = 27), ACTH + other (rituximab, chemotherapy, or steroid sparers) (n = 14), and steroids + other (n = 13). None of the three ACTH groups differed from each other in BAFF concentration, so they were bundled into ‘All ACTH Groups’. Steroid groups were bundled the same way. OIND was significantly different than all other groups (‡). The mean ACTH dose in the combined ACTH groups was 28 ± 22 IU/m2/day (alternate day doses averaged to provide a daily dose equivalent). The mean steroid dose was 1.3 ± 1.3 mg/kg/day. (B) Serum BAFF. The ACTH monotherapy group and the ACTH + IVIg group, which were not significantly different in BAFF concentrations, were bundled into group 2; steroids were handled likewise in group 3. The ‘Rituximab + Other’ group included rituximab, IVIg, and either steroids or ACTH.
Figure 2
Figure 2
Cross-sectional APRIL concentrations. (A) CSF APRIL, expressed as ng/mL (1000 × pg/mL). The pre-bundled treatment groups were ACTH (n = 33), steroids (n = 11), IVIg (n = 14), ACTH + IVIg (n = 29), steroids + IVIg (n = 14). (B) Serum APRIL, expressed as ng/mL. The three IVIg groups (IVIg, ACTH + IVIg, steroids + IVIg) did not differ significantly from each other in serum APRIL concentration, so they were combined into ‘All IVIg groups’. Compared to controls, the serum APRIL concentration was higher by 6.7-fold in the IVIg monotherapy group (32.6 ± 34 ng/mL), by 8.2-fold in the ACTH + IVIg group (39.9 ± 45 ng/mL), and by 6.9-fold in the steroid + other group (33.3 ± 26 ng/mL). IVIg was infused monthly, and most evaluations were scheduled just before the next IVIg was due.
Figure 3
Figure 3
CSF BAFF and serum APRIL concentration versus OMS severity and duration category. (A) Dot plot comparison of BAFF versus OMS severity in all ACTH/steroid groups versus all other OMS groups. Asterisk denotes P < 0.05 by two-tailed t tests within categories. Severity categories were pre-defined based on total score as mild (0–12), moderate (13–24), or severe (25–36). Between-category comparisons were made by ANOVA and Kruskal-Wallis tests. (B) Comparison of BAFF versus OMS duration in all ACTH/steroid groups versus all other OMS groups. OMS duration was pre-defined as acute (0 to 3 months), subacute (>3 months to 1 year), or chronic (>1 year). (C) Serum APRIL concentrations versus OMS severity in all IVIg groups versus all non-IVIg groups. (D) Serum APRIL versus OMS duration in all IVIg groups versus all non-IVIg groups.
Figure 4
Figure 4
Dichotomization of CSF BAFF concentration into ‘high’ and ‘normal’ groups for phenotyping. Percentages were compared by Fisher’s exact tests and means by t tests. The high and normal groups did not differ significantly in gender ratio, patient age, or OMS duration (data not shown).
Figure 5
Figure 5
Longitudinal effects of immunotherapy on CSF BAFF and serum APRIL. (A) CSF BAFF pre- and post-treatment with ACTH-based combination immunotherapy. Group means with SEM and percent reduction are shown to either side of the line plot. (B) ACTH-based immunotherapy without rituximab. Comparisons were made by paired t tests. (C) ACTH-based immunotherapy with rituximab. Pre-treatment means in Figures B and C did not differ significantly; neither did post-treatment means. (D) Pre- and post-IVIg treatment serum APRIL. (E) Data from 1 g/kg IVIg dose. (F) Data from 2 g/kg IVIg dose. No significant differences were found between pre-treatment means or between post-treatment means in Figures E and F.

References

    1. Tate ED, Pranzatelli MR, Verhulst SJ, Markwell SJ, Franz DN, Graf WD, Joseph SA, Khakoo YN, Lo WD, Mitchell WG, Sivaswamy L. Active comparator-controlled, rater-blinded study of corticotropin-based immunotherapies for opsoclonus-myoclonus syndrome. J Child Neurol. 2012;27:875–884. doi: 10.1177/0883073811428816. - DOI - PubMed
    1. Pranzatelli MR, Travelstead AL, Tate ED, Allison TJ, Verhulst SJ. CSF B-cell expansion in opsoclonus-myoclonus syndrome: a biomarker of disease activity. Mov Disord. 2004;19:770–777. doi: 10.1002/mds.20125. - DOI - PubMed
    1. Pranzatelli MR, Tate ED, McGee NR, Travelstead AL, Ransohoff RM, Ness JM, Colliver JA. Key role of CXCL13/CXCR5 axis for cerebrospinal fluid B cell recruitment in pediatric OMS. J Neuroimmunol. 2012;243:81–88. doi: 10.1016/j.jneuroim.2011.12.014. - DOI - PubMed
    1. Pranzatelli MR, Tate ED, Hoefgen ER, Verhulst SJ. Interferon-inducible protein 10 (CXCL10) is increased in the cerebrospinal fluid of children with opsoclonus-myoclonus syndrome. Ann Neurol. 2007;Suppl 11:S112–S113.
    1. Pranzatelli MR, Slev PR, Tate ED, Travelstead AD, Colliver JA, Joseph SA. Cerebrospinal fluid oligoclonal bands in childhood opsoclonus-myoclonus. Pediatr Neurol. 2011;45:27–33. doi: 10.1016/j.pediatrneurol.2011.02.012. - DOI - PubMed

Publication types

MeSH terms

Substances