

Multivariable analysis of host amino acids in plasma and liver during infection of malaria parasite Plasmodium yoelii
- PMID: 23324562
- PMCID: PMC3551679
- DOI: 10.1186/1475-2875-12-19
Multivariable analysis of host amino acids in plasma and liver during infection of malaria parasite Plasmodium yoelii
Abstract
Background: Malaria is the most significant human parasitic disease, and yet understanding of the energy metabolism of the principle pathogen, Plasmodium falciparum, remains to be fully elucidated. Amino acids were shown to be essential nutritional requirements since early times and much of the current knowledge of Plasmodium energy metabolism is based on early biochemical work, performed using basic analytical techniques, carried out almost exclusively on human plasma with considerable inter-individual variability.
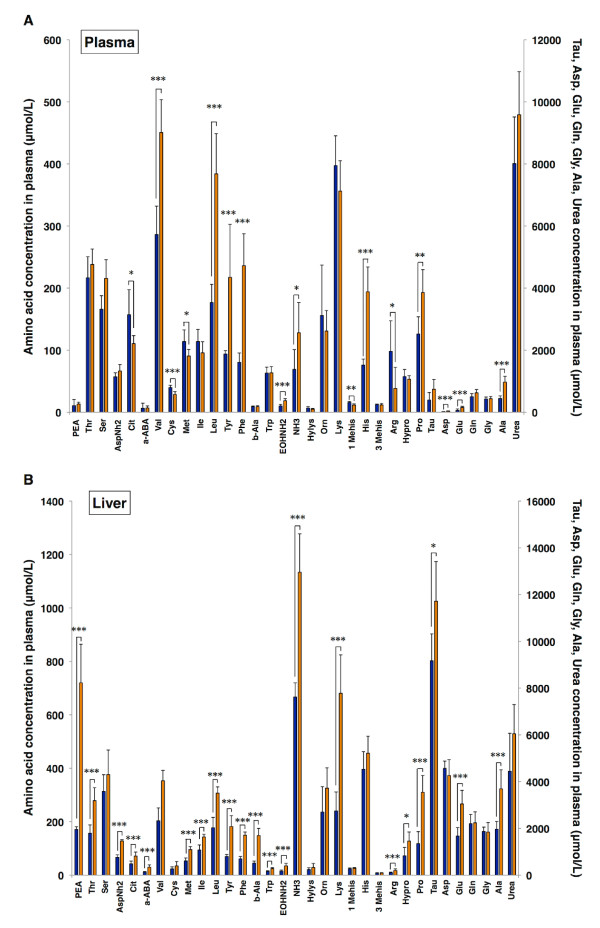
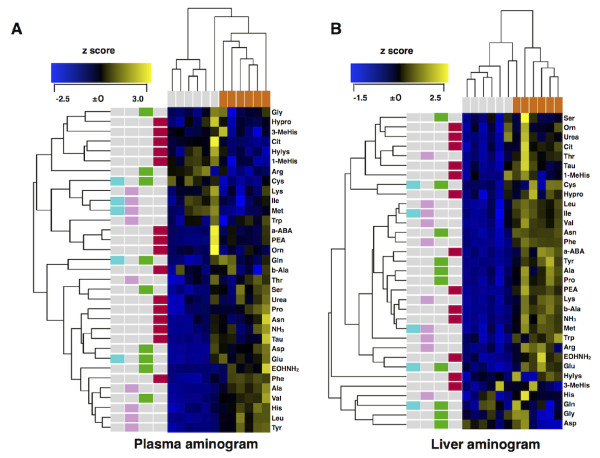
Methods: In order to further characterize the fate of amino acid metabolism in malaria parasite, multivariate analysis using statistical modelling of amino acid concentrations (aminogram) of plasma and liver were determined in host infected with rodent malaria parasite, Plasmodium yoelii.
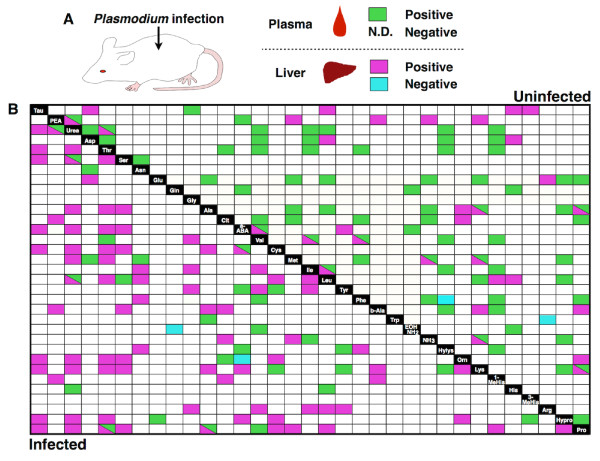
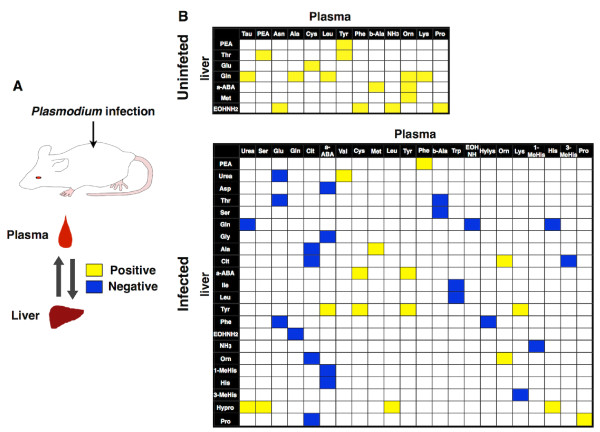
Results and conclusion: Comprehensive and statistical aminogram analysis revealed that P. yoelii infection caused drastic change of plasma and liver aminogram, and altered intra- and inter-correlation of amino acid concentration in plasma and liver. These findings of the interactions between amino acids and Plasmodium infection may provide insight to reveal the interaction between nutrients and parasites.
Figures
Similar articles
-
Comparative histopathology of mice infected with the 17XL and 17XNL strains of Plasmodium yoelii.J Parasitol. 2012 Apr;98(2):310-5. doi: 10.1645/GE-2825.1. Epub 2011 Oct 21. J Parasitol. 2012. PMID: 22017443
-
Outcome of primary lethal and nonlethal Plasmodium yoelii malaria infection in BALB/c and IFN-γ receptor-deficient mice following chloroquine treatment.Parasitol Res. 2013 Feb;112(2):773-80. doi: 10.1007/s00436-012-3197-y. Epub 2012 Nov 21. Parasitol Res. 2013. PMID: 23180129
-
A highly infectious Plasmodium yoelii parasite, bearing Plasmodium falciparum circumsporozoite protein.Malar J. 2016 Apr 12;15:201. doi: 10.1186/s12936-016-1248-z. Malar J. 2016. PMID: 27068454 Free PMC article.
-
In vitro development of infectious liver stages of P. yoelii and P. berghei malaria in human cell lines.Exp Parasitol. 1994 Nov;79(3):362-73. doi: 10.1006/expr.1994.1098. Exp Parasitol. 1994. PMID: 7957756
-
Isolation of invasive Plasmodium yoelii merozoites with a long half-life to evaluate invasion dynamics and potential invasion inhibitors.Mol Biochem Parasitol. 2015 Nov;204(1):26-33. doi: 10.1016/j.molbiopara.2015.12.003. Epub 2015 Dec 9. Mol Biochem Parasitol. 2015. PMID: 26684675
Cited by
-
Tissue/Biofluid Specific Molecular Cartography of Leishmania donovani Infected BALB/c Mice: Deciphering Systemic Reprogramming.Front Cell Infect Microbiol. 2021 Jul 29;11:694470. doi: 10.3389/fcimb.2021.694470. eCollection 2021. Front Cell Infect Microbiol. 2021. PMID: 34395309 Free PMC article.
-
Amino Acids As Mediators of Metabolic Cross Talk between Host and Pathogen.Front Immunol. 2018 Feb 27;9:319. doi: 10.3389/fimmu.2018.00319. eCollection 2018. Front Immunol. 2018. PMID: 29535717 Free PMC article. Review.
-
Investigation of Proteus vulgaris and Elizabethkingia meningoseptica invasion on muscle oxidative stress and autophagy in Chinese soft-shelled turtle (Pelodiscus sinensis).Sci Rep. 2021 Feb 11;11(1):3657. doi: 10.1038/s41598-021-83388-6. Sci Rep. 2021. PMID: 33574492 Free PMC article.
References
-
- Yeo TW, Lampah DA, Gitawati R, Tjitra E, Kenangalem E, McNeil YR, Darcy CJ, Granger DL, Weinberg JB, Lopansri BK, Price RN, Duffull SB, Celermajer DS, Anstey NM. Impaired nitric oxide bioavailability and L-arginine reversible endothelial dysfunction in adults with falciparum malaria. J Exp Med. 2007;204:2693–2704. doi: 10.1084/jem.20070819. - DOI - PMC - PubMed
Publication types
MeSH terms
Substances
LinkOut - more resources
Full Text Sources
Other Literature Sources
Medical
