. 2013 May;9(5):1019-31.
doi: 10.4161/hv.23518. Epub 2013 Jan 16.

Fel d 1-airway inflammation prevention and treatment by co-immunization vaccine via induction of CD4+CD25-Foxp3+ Treg cells

Affiliations

Fel d 1-airway inflammation prevention and treatment by co-immunization vaccine via induction of CD4+CD25-Foxp3+ Treg cells

Yechun Pei et al. Hum Vaccin Immunother. 2013 May.

Abstract

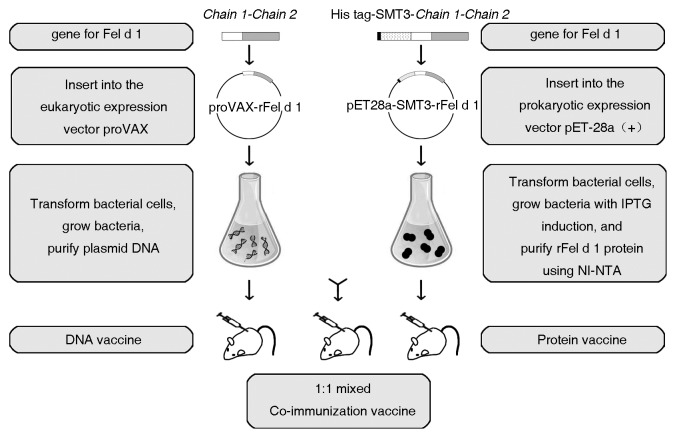
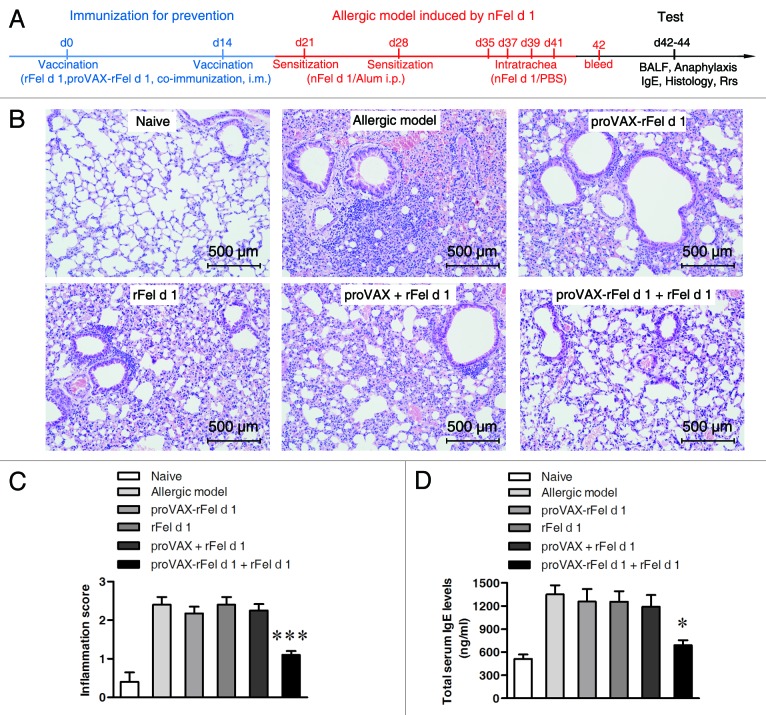
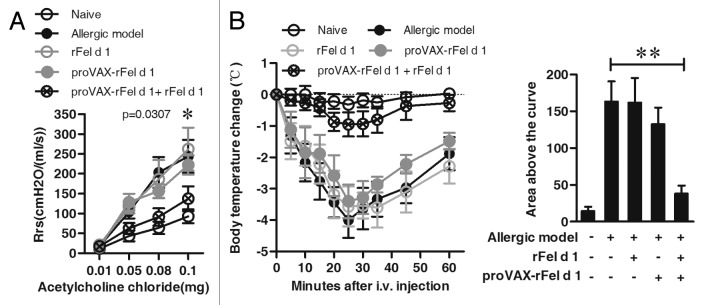
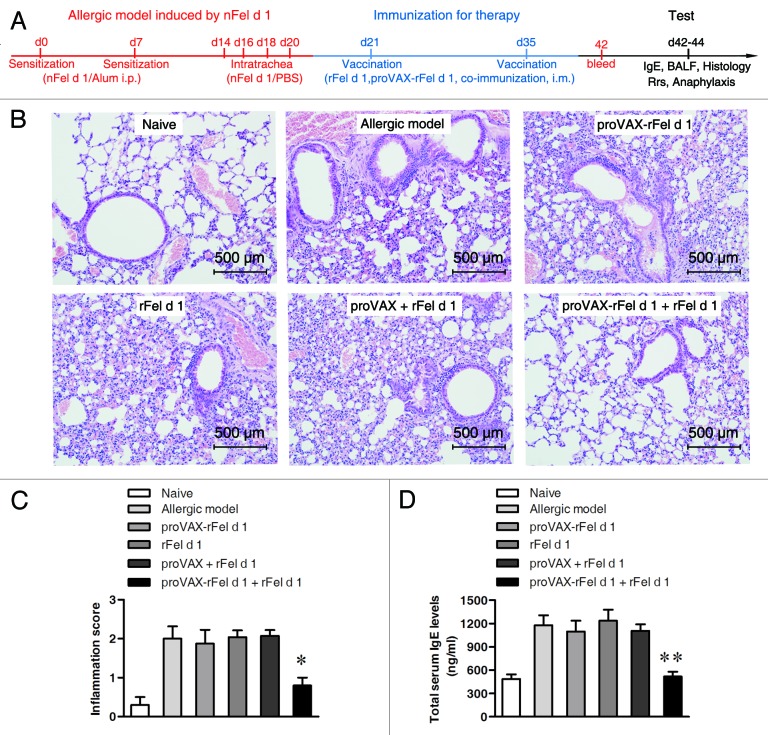
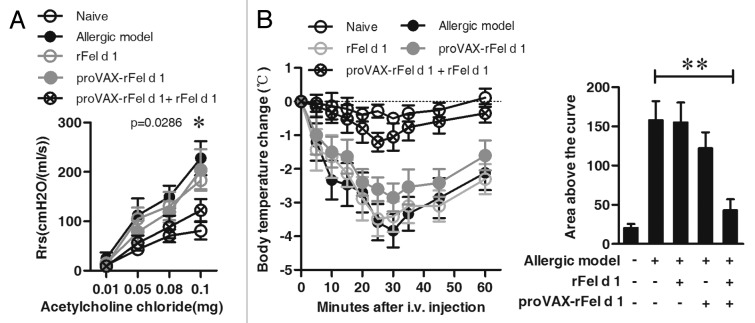
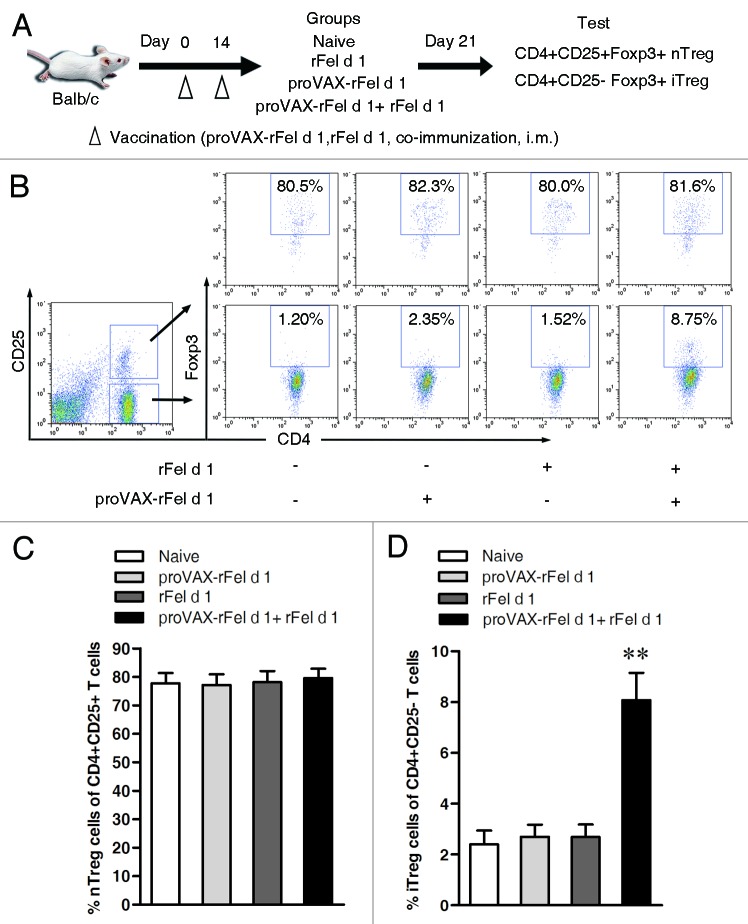
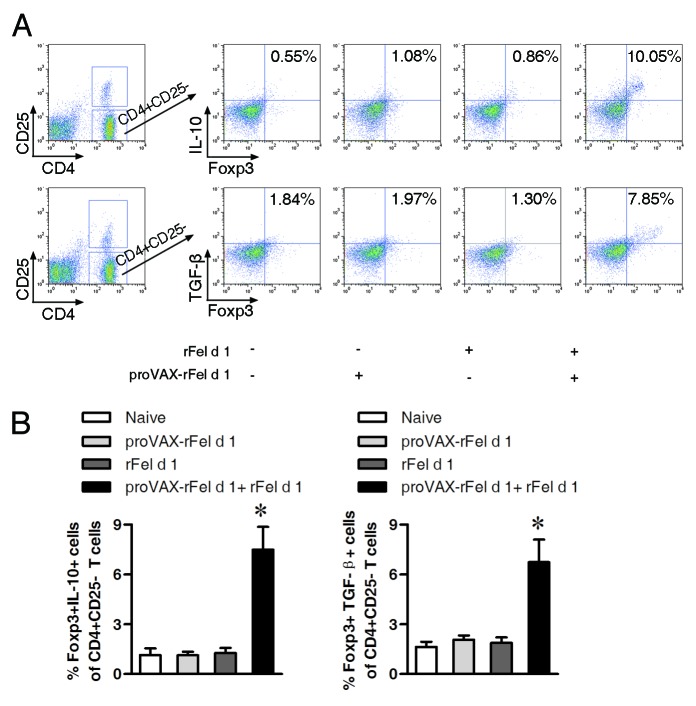
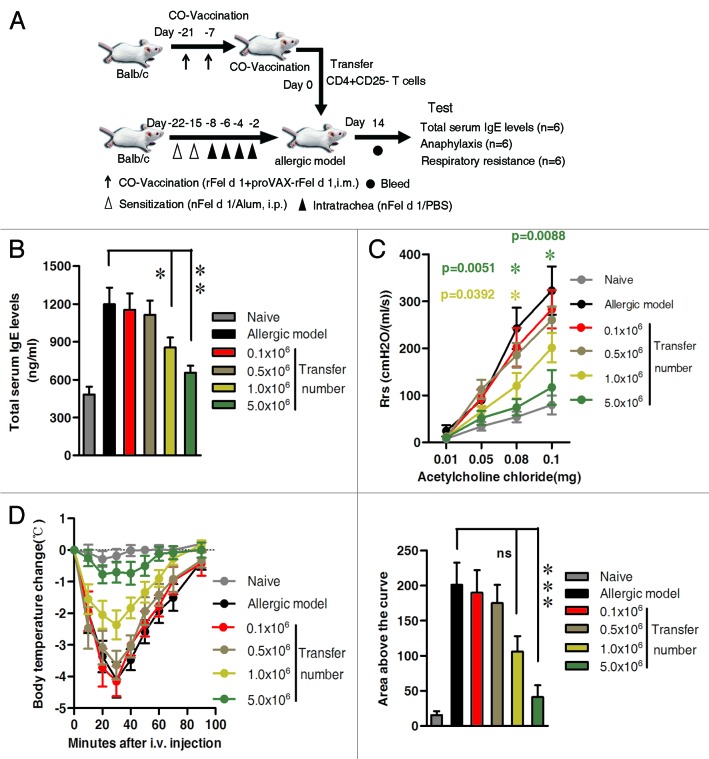
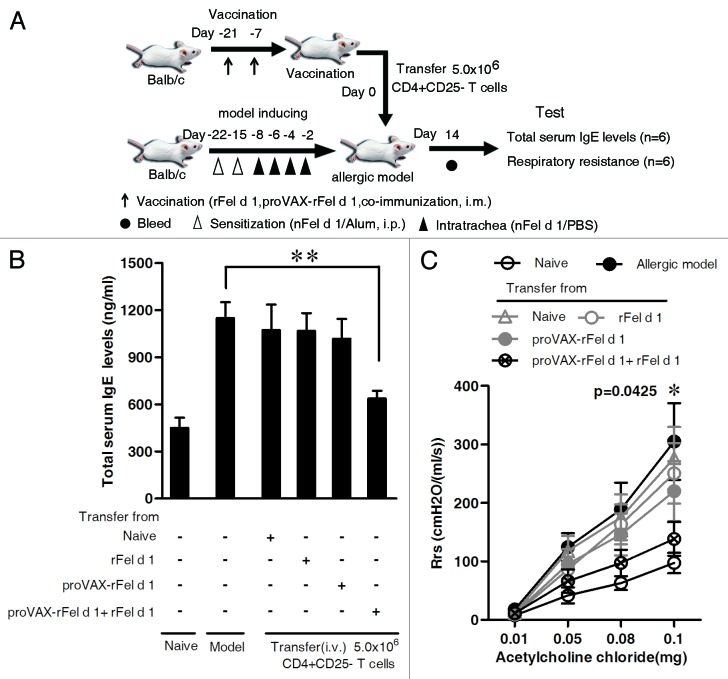
Pet allergens are major causes for asthma and allergic rhinitis. Fel d 1 protein, a key pet allergen from domestic cat, can sensitize host and trigger asthma attack. In this study, we report that co-immunization with recombinant Fel d 1 protein (rFel d 1) plus plasmid DNA that contains Fe1 d 1 gene was effective in preventing and treating the natural Fel d 1 (nFel d 1) induced allergic airway inflammation in mice. A population of T regulatory cells (iTreg) exhibiting a CD4+CD25-Foxp3+ phenotype and expressing IL-10 and TGF-β was induced by this co-immunization strategy. Furthermore, after adoptive transfers of the iTreg cells, mice that were pre-sensitized and challenged with nFel d 1 exhibited less signs of allergic inflammation, AHR and a reduced allergic immune response. These data indicate that co-immunization with DNA and protein mixture vaccine may be an effective treatment for cat allergy.

Keywords: Fel d 1; T regulatory cell; airway inflammation; co-immunization; vaccine.


Figures

None
Figure 1. Schematic diagram of vaccine preparation. Vectors proVAX-rFel d 1 and pET28a-SMT3-rFel d 1 expressing rFel d 1 antigen were constructed as described in Materials and Methods. Vector proVAX-rFel d 1 was transformed in bacterial cells and plasmid DNA was purified and incorporated into a DNA vaccine. rFel d 1 was expressed in E.coli with IPTG induction, purified and used as a protein vaccine. Plasmid DNA was mixed 1:1 with the purified rFel d 1 to make co-immunization vaccine.
None
Figure 2. Lung inflammation and total serum IgE levels in mice inmmunized with different vaccines. (A) Schematic outline of the experiment. (B) Histological examination of lung tissues by H&E staining (n = 5). Magnification, × 200. (C) Lung inflammation was defined as the peribronchial inflammation score (n = 5). Values are expressed as mean ± SEM *** p < 0.001; significantly different from the allergic group. (D) Serum of individual mouse was collected after intratrachea with nFel d 1 (d42). Total serum IgE levels were measured using double-antibody sandwich ELISA technique (n = 6). * p < 0.05.
None
Figure 3. Prevention of AHR and acute systemic anaphylaxis by co-immunization strategy. (A) AHR was measured by the RC system in mice in response to the intra-jugular administration of acetylcholine chloride at various doses on the x-axis and expressed as Rrs on the y-axis. The allergic model was induced by nFel d 1 without vaccination (n = 6). (B) After vaccination and follow-up sensitization, 6 mice of each group were challenged i.v. with rFel d 1 and body temperature was measured at regular intervals. Changes in body temperature in degrees Celsius ± SD are shown on the left panel and mean area above the curves ± SD on the right panel (n = 6). Data shown are representative of three independent experiments with the same number of mice per group. A: * p < 0.05; B: ** p < 0.001.
None
Figure 4. Therapeutic relief of nFel d 1-induced allergic symptoms in mice by co-immunization. (A) Schematic outline of the experiment. (B) Histological examination of lung tissues (n = 5) by H&E staining (d43). Magnification, × 200. (C) Lung inflammation was defined as the peribronchial inflammation score (n = 5). Values are expressed as mean ± SEM * p < 0.05; significantly different from the control group. (D) Serum of individual mouse was collected after vaccination (d42). Total serum IgE levels were measured using double-antibody sandwich ELISA technique (n = 6) and shown as mean total serum IgE levels ± SD, ** p < 0.005.
None
Figure 5. Reduction of AHR and inhibition of anaphylactic reaction by DNA/Protein co-vaccination. (A) AHR was measured by the RC system in mice in response to the intra-jugular administration of acetylcholine chloride at various doses on the x-axis and expressed as Rrs on the y-axis. The nFel d 1-induced allergic model without vaccination were regarded as positive control (n = 6). (B) Eight days after the second vaccination, 6 mice in each group were challenged i.v. with rFel d 1 and body temperature was measured at regular intervals. Changes in body temperature in degrees Celsius ± SD (n = 6) are shown on the left panel and mean area above the curves ± SD (n = 6) on the right panel. Data shown are representative of three independent experiments with the same number of mice per group. (A): * p < 0.05; (B): ** p < 0.001.
None
Figure 6. Induction of CD4+CD25-Foxp3+ T regulatory cells in BALB/c mice by co-immunization with DNA and protein mixture (1:1) vaccine. (A) Schematic outline of the experiment. (B) Seven days after the second immunization, single splenocyte suspensions were prepared from mouse spleen and analyzed by flow cytometry. Percentages of CD4+CD25+Foxp3+ nTreg cells were analyzed by gating on the CD4+CD25+ T cells, and percentages of CD4+CD25-Foxp3+ iTreg cells were analyzed by gating on the CD4+CD25- T cells during FACS analysis. Naïve mice without vaccination were regarded as negative control. (C) Statistical analysis of percentages of nTreg cells (Left, n = 6) and iTreg cells (Right, n = 6). Compared with naïve group, mice treated with co-immunization strategy can induce CD4+CD25-Foxp3+ iTreg cells. Numbers in the outlined areas indicate percentage of cells. Data shown are representative of three independent experiments with the same number of mice per group. ** p < 0.005.
None
Figure 7. Increase in percentages of Foxp3+IL-10+ and Foxp3+TGF-β+ cells among CD4+CD25- cells in co-immunized mice. Seven days after the second immunization, single splenocyte suspensions were prepared and analyzed by flow cytometry. (A) Percentages of Foxp3+IL-10+ (upper) and Foxp3+TGF-β+ cells (lower) among CD4+CD25- cells. Percentages of double positive cells were shown. (B) Statistical analysis of percentages of Foxp3+IL-10+ cells and Foxp3+TGF-β+ cells in CD4+CD25- T cells (n = 3). Compared with other groups, percentages of double positive cells among CD4+CD25- T cells in the co-immunization group increased significantly (p < 0.05). Numbers in the outlined areas indicate percentage of cells. Data shown are representative of three independent experiments with the same number of mice per group. * p < 0.05.
None
Figure 8. Descrease in total serum IgE levels, reduction of AHR and inhibition of anaphylactic reaction by adoptively transfer CD4+CD25- T cells from co-immunized mice. CD4+CD25- T cells from co-immunized mice were isolated, purified and adoptively transferred intravenously to nFel d 1-induced allergic mice as described in Materials and Methods. Four different transfer groups received the following four doses of cells: 0.1 × 10⁶, 0.5 × 10⁶, 1.0 × 10⁶ and 5.0 × 10⁶. The nFel d 1-induced allergic airway inflammation mice without adoptive transfer served as a positive control. Naïve BALB/c mice without sensitization and transfer served as a negative control. (A) Schematic outline of the experiment. (B) 14 d after CD4+CD25- T cells transfer, serum of individual asthmatic mouse was collected. Mean total serum IgE levels ± SD are shown (n = 6). For 1.0 × 10⁶ recipient group vs. model group, p < 0.05; for 5.0 × 10⁶ recipient group vs. model group, p < 0.005. (C) AHR was measured by the RC system in mice in response to the intra-jugular administration of acetylcholine chloride at various doses on the x-axis and expressed as Rrs on the y-axis (n = 6). (D) 15 d after adoptive transfer, 6 mice in each group were challenged i.v. with rFel d 1 and body temperature was measured at regular intervals. Changes in body temperature in degrees Celsius ± SD (n = 6) are shown on the left panel and mean area above the curves ± SD (n = 6) on the right panel. Individual areas above the curves were determined and compared by one-way ANOVA using Bonferroni’s post test. Data shown are representative of three independent experiments with six mice per group. (B and C) * p < 0.05; ** p < 0.005; D: *** p < 0.0001; ns, no significant difference.
None
Figure 9. Effect of adoptive transfer of CD4+CD25- T cells from co-immunized mice on total serum IgE levels and AHR. CD4+CD25- T cells from different vaccine groups were isolated, purified and adoptively transferred intravenously to nFel d 1-induced allergic airway inflammation mice as described in Materials and Methods. Adoptively transferred CD4+CD25- T cells were 5.0 × 10⁶ cells per mouse. Four different transfer groups were set up [i.e., CD4+CD25- T cells were derived from naïve mice, BALB/c mice vaccinated with rFel d 1 alone, proVAX-rFel d 1 alone or proVAX-rFel d 1 and rFel d 1 mixture (1:1), respectively]. The nFel d 1-induced allergic mice without adoptive transfer served as positive control and the naïve BALB/c mice without sensitization and transfer served as blank control. (A) Schematic outline of the experiment. (B) Fourteen days after CD4+CD25- T cells transfer, serum of individual mouse was collected. Mean total serum IgE levels ± SD are shown (n = 6). (C) AHR was measured by the RC system in mice in response to the intra-jugular administration of acetylcholine chloride at various doses on the x-axis and expressed as Rrs on the y-axis (n = 6). Data shown are representative of two independent experiments with six mice per group. * p < 0.05; ** p < 0.005.

Similar articles

Cited by

References

    1. Georas SN, Guo J, De Fanis U, Casolaro V. T-helper cell type-2 regulation in allergic disease. Eur Respir J. 2005;26:1119–37. doi: 10.1183/09031936.05.00006005. - DOI - PubMed
    1. Morgenstern JP, Griffith IJ, Brauer AW, Rogers BL, Bond JF, Chapman MD, et al. Amino acid sequence of Fel dI, the major allergen of the domestic cat: protein sequence analysis and cDNA cloning. Proc Natl Acad Sci U S A. 1991;88:9690–4. doi: 10.1073/pnas.88.21.9690. - DOI - PMC - PubMed
    1. Mata P, Charpin D, Charpin C, Lucciani P, Vervloet D. Fel d I allergen: skin and or saliva? Ann Allergy. 1992;69:321–2. - PubMed
    1. van Ree R, van Leeuwen WA, Bulder I, Bond J, Aalberse RC. Purified natural and recombinant Fel d 1 and cat albumin in in vitro diagnostics for cat allergy. J Allergy Clin Immunol. 1999;104:1223–30. doi: 10.1016/S0091-6749(99)70017-5. - DOI - PubMed
    1. Ohman JL, Jr., Lowell FC, Bloch KJ. Allergens of mammalian origin. III. Properties of a major feline allergen. J Immunol. 1974;113:1668–77. - PubMed

MeSH terms