. 2013 Jan 16:14:28.
doi: 10.1186/1471-2164-14-28.

An R2R3 MYB transcription factor determines red petal colour in an Actinidia (kiwifruit) hybrid population

Affiliations

An R2R3 MYB transcription factor determines red petal colour in an Actinidia (kiwifruit) hybrid population

Lena G Fraser et al. BMC Genomics. .

Abstract

Background: Red colour in kiwifruit results from the presence of anthocyanin pigments. Their expression, however, is complex, and varies among genotypes, species, tissues and environments. An understanding of the biosynthesis, physiology and genetics of the anthocyanins involved, and the control of their expression in different tissues, is required. A complex, the MBW complex, consisting of R2R3-MYB and bHLH transcription factors together with a WD-repeat protein, activates anthocyanin 3-O-galactosyltransferase (F3GT1) to produce anthocyanins. We examined the expression and genetic control of anthocyanins in flowers of Actinidia hybrid families segregating for red and white petal colour.

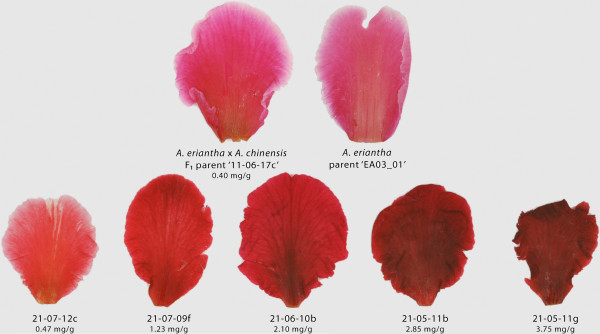
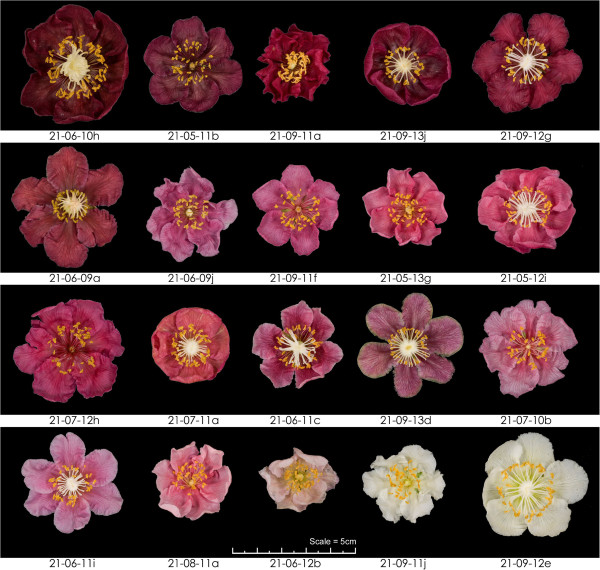
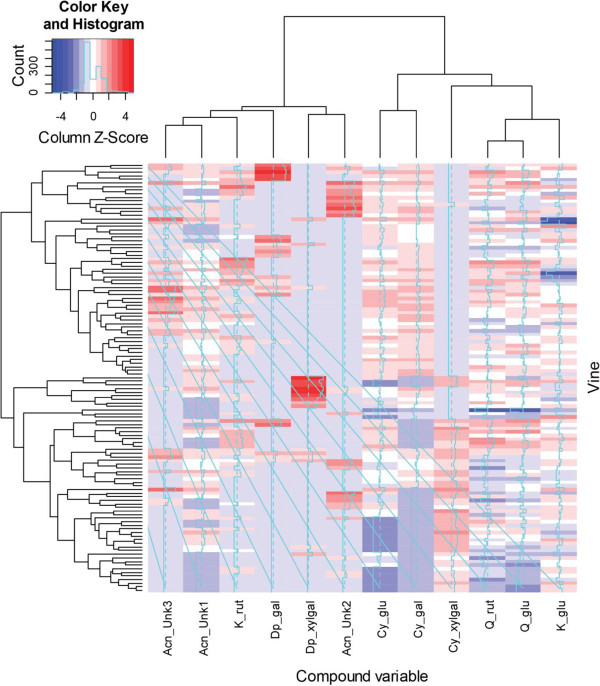
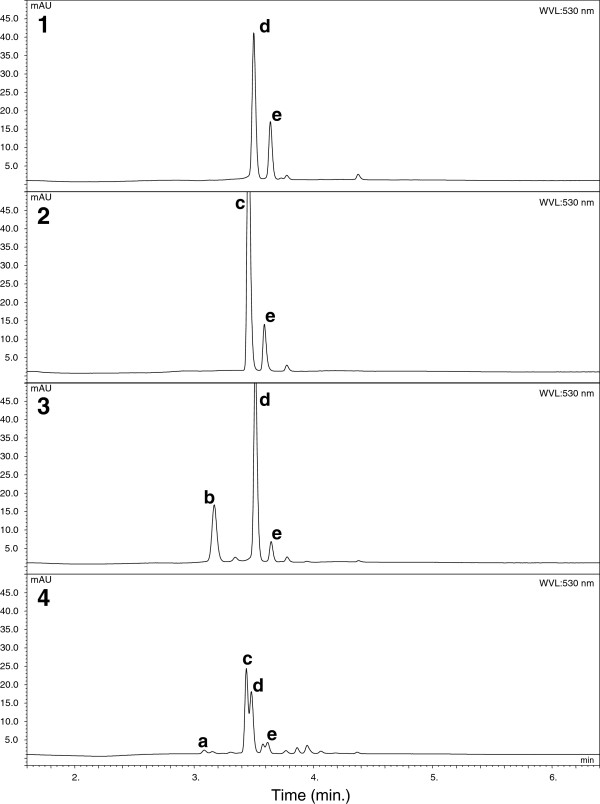
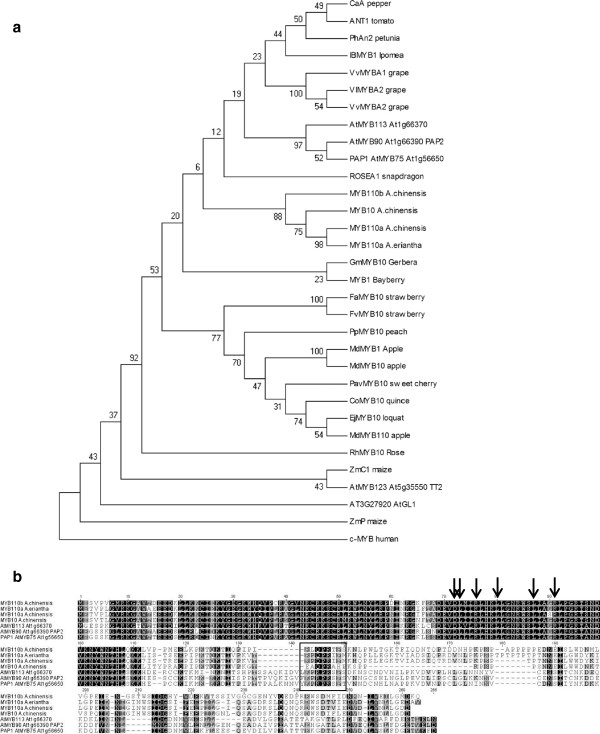
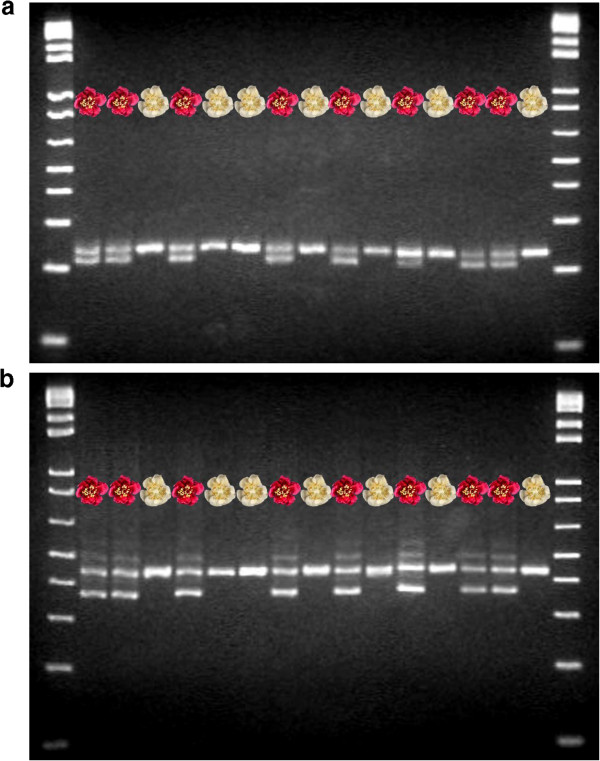
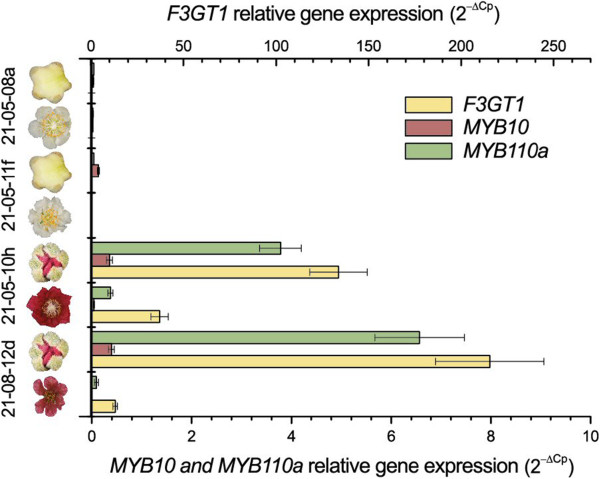
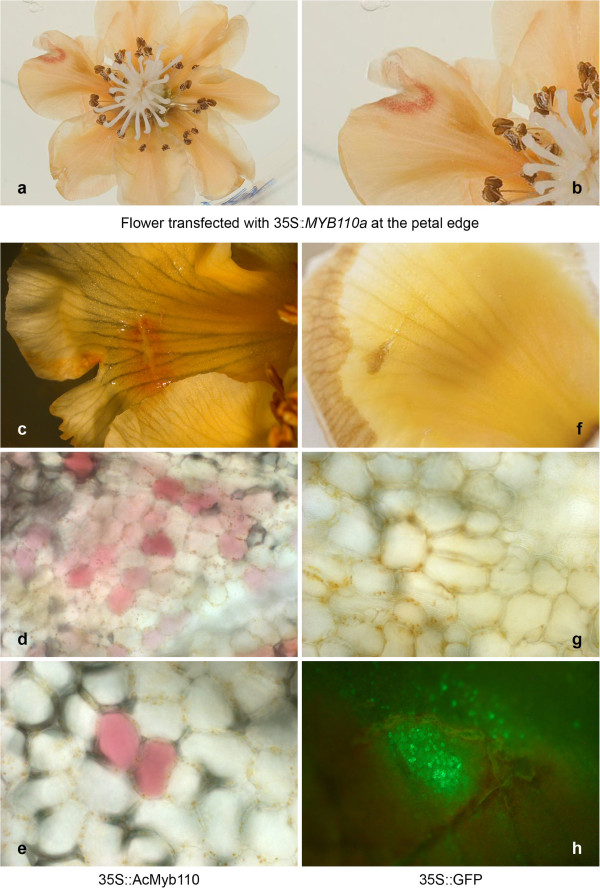
Results: Four inter-related backcross families between Actinidia chinensis Planch. var. chinensis and Actinidia eriantha Benth. were identified that segregated 1:1 for red or white petal colour. Flower pigments consisted of five known anthocyanins (two delphinidin-based and three cyanidin-based) and three unknowns. Intensity and hue differed in red petals from pale pink to deep magenta, and while intensity of colour increased with total concentration of anthocyanin, no association was found between any particular anthocyanin data and hue. Real time qPCR demonstrated that an R2R3 MYB, MYB110a, was expressed at significant levels in red-petalled progeny, but not in individuals with white petals.A microsatellite marker was developed that identified alleles that segregated with red petal colour, but not with ovary, stamen filament, or fruit flesh colour in these families. The marker mapped to chromosome 10 in Actinidia.The white petal phenotype was complemented by syringing Agrobacterium tumefaciens carrying Actinidia 35S::MYB110a into the petal tissue. Red pigments developed in white petals both with, and without, co-transformation with Actinidia bHLH partners. MYB110a was shown to directly activate Actinidia F3GT1 in transient assays.

Conclusions: The transcription factor, MYB110a, regulates anthocyanin production in petals in this hybrid population, but not in other flower tissues or mature fruit. The identification of delphinidin-based anthocyanins in these flowers provides candidates for colour enhancement in novel fruits.


Figures

Figure 1
Figure 1
Range of colour intensities in the petals of progeny compared with parents. The progeny of all four Actinidia families making up the experimental population showed a range of intensities in anthocyanin expression in their petals. While some red petal genotypes had flower petals that were paler than their F1 hybrid parent, or A. eriantha, many had much darker red petals. There was a constancy of petal colour within vines. The concentrations of colour compounds were recorded as mg.g-1 fresh weight of petal tissue. Each progeny genotype was identified by its field position with orchard block number, row number and bay position giving a unique identifier. Parental genotypes may be identified by their field position as described, or their accession number in the germplasm resource.
Figure 2
Figure 2
Colour intensity and hue variation of petals among progeny genotypes.Actinidia progeny segregating for red and white petal colour within all four families showed significant variation among genotypes in both colour intensity and hue of the flower petals. The red flowers ranged from a pale pink to a deep magenta. The unique genotype identity of field position is shown below a typical flower of each.
Figure 3
Figure 3
Analysis of anthocyanin and flavonol data. Heatmap of concentrations of 12 pigment compounds measured on 138 vines of the hybrid F2 backcross families between (Actinidia eriantha x A. chinensis var. chinensis) and A. chinensis var. chinensis. The data displayed on a colour scale are the normalised (Z scores) log2 values of the raw data. The dendrograms corresponding to rows (i.e., vines) and columns (i.e., compound variables) have been constructed by hierarchical clustering. The compounds measured were the anthocyanins delphinidin 3-O-(xylosyl)galactoside, delphinidin 3-O-galactoside, cyanidin 3-O-(xylosyl)galactoside, cyanidin 3-O-galactoside, cyanidin 3-O-glucoside and three unidentified anthocyanins, and the flavonols quercetin-rutinoside, quercetin-glucoside, kaemferol-glucoside and kaemferol-rutinoside.
Figure 4
Figure 4
Anthocyanin profiles of red petals of genotypes segregating for this phenotype. Analysis of anthocyanins in red Actinidia petals by Ultra High Performance Liquid Chromatography (UHPLC)(WVL 530 nm) identified four patterns that commonly occurred. Traces 1 to 4 show the anthocyanins present, and their concentrations, in the sample as: a - delphinidin 3-O-(xylosyl)galactoside; b - delphinidin 3-O-galactoside; c – cyanidin 3-O-(xylosyl)galactoside; d - cyanidin 3-O-galactoside; e – cyanidin 3-O-glucoside. Trace 1 is dominated by cyanidin 3-O-galactoside/cyanidin 3-O-glucoside. Cyanidin 3-O-(xylosyl)galactoside is the most plentiful anthocyanin present in trace 2, while trace 3 shows a significant concentration of delphinidin 3-O-galactoside together with cyanidin 3-O-galactoside/cyanidin 3-O-glucoside. Trace 4 shows a pattern of multiple anthocyanins with delphinidin 3-O-(xylosyl)galactoside, delphinidin 3-O-galactoside, cyanidin 3-O-(xylosyl)galactoside, cyanidin 3-O-galactoside and cyanidin 3-O-glucoside all present.
Figure 5
Figure 5
Phylogeny of A. chinensis and A. eriantha MYB genes evaluated from protein sequence. (a). Phylogeny of MYB proteins implicated in anthocyanin regulation in various genera, and the positions assumed by the MYB10 and MYB110 of Actinidia chinensis var. chinensis and A. eriantha. Phylogenetic and molecular evolutionary analysis was conducted using MEGA version 4.0.2 [38] (using minimum evolution phylogeny test and 1000 bootstrap replicates). GenBank numbers; RhMYB10 (ABX79949), ZmP (AF292540), ZmC1 (Y15219), IbMYB1 (AB576767), GmMYB10 (ACM62751), ROSEA1 (DQ275529), MYB1 bayberry (GQ340767), VvMYBA2 (ABL14065), VlMYBA2 (BAC07540), VvMYBA1 (AB242302), ANT1 (AY348870), PhAn2 (EF423868), CaA (AJ608992), FvMYB10 (ABX79948), FaMYB10 (ABX79947), PpMYB10 (ABX79945), PavMYB10 (ABX71493), MdMYB110 (EB710109), EjMYB10 (ABX71484), CoMYB10 (ABX71483), MdMYB10 (ACQ45201), MdMYB1 (DQ886414) and c-MYB (AAB49039). (b). Protein sequence data from which phylogenetic relationships of MYB genes were evaluated. Sequences were aligned using Clustal W (opening = 15, extension-0.3) in Vector NTI9.0. Arrows indicate the amino acid signature motif ([DE]Lx2[RK]x3Lx6Lx3R) in the R2R3 domain, which allows interaction with a bHLH partner, and the box shows the C-terminus motif typical of anthocyanin-related regulators.
Figure 6
Figure 6
Gel electrophoresis banding patterns identify red-petal progeny. Progeny of four interspecific hybrid families between (Actinidia chinensis var. chinensis x Actinidia eriantha) x Actinidia chinensis var. chinensis had either red or white-petalled flowers. Gel electrophoresis of the PCR products amplified with primers to the MYB110 genes showed that the genotypes could be distinguished on the basis of their banding patterns. With MYB110a, (primer pair Ke923) genotypes with red petal colour all had two clear bands, while genotypes with white petal colour had a single band (Figure 6 a). Primer pair Ke701, specific to MYB110b, also segregated with red petal colour (Figure 6 b). In this instance the red petal phenotype had three bands while the white petal genotype had one band. Both gels were run through a 2.75% agarose gel with a 1Kb + size ladder.
Figure 7
Figure 7
qPCR – Relative expression of F3GT1, MYB10 and MYB110a in petals. Gene expression analysis of MYB10 (primer set Ke922), MYB110a (primer set Ke923) and F3GT1 (Flavonoid 3-O-galactosyltransferase) in petals of white and red flowers of an interspecific Actinidia hybrid (A. chinensis var. chinensis x A. eriantha) x A. chinensis var. chinensis at two stages of flower development: calyx split and open flower. Error bars are SE for four technical replicates of each genotype.
Figure 8
Figure 8
Trans-activation of the F3GT1 and AtDFR promoters by MYB110a and AtMYB75 in a dual luciferase transient assay. Leaves of Nicotiana benthamiana were infiltrated with F3GT1 promoter-LUC or AtDFR promoter-LUC fusions on their own or co-infiltrated with 35S::MYB110a, 35S::AtMYB75 or with 35S::AtTT8. Luminescence of LUC and REN was measured 3 d later and expressed as a ratio of LUC to REN. Data are presented as means (± SE) of four biological replicates of each transgene combination.
Figure 9
Figure 9
Complementation of the white petal phenotype in a transient assay by over-expression of MYB110a. White flowers of a progeny genotype (21-05-09e) of the F2 backcross (Actinidia chinensis var. chinensis x Actinidia eriantha) x Actinidia chinensis var. chinensis hybrid population were syringed at a cut surface and kept on agar for four days. A flower was transfected with 35S::MYB110a at the petal edge. In the surrounding area of the infiltration, over-expression of MYB110a complemented the white phenotype and restored the ability to synthesise anthocyanin in petals. The white flowers followed their natural senescence pathway and coloured to light apricot during the four-day experiment. Microscopy showed that within the area of infiltration single cells within the petal transfected with 35S::MYB110a were highly pigmented (magnification x10 upper, and x40 lower panel), and the pigment was contained within the cells (Figure 9 c, 9 d, 9 e). When the petal was transfected with 35S::GFP as control, the cells did not show any anthocyanin accumulation, light (upper) and fluorescence (lower) microscopy showed only GFP expression in the area of infiltration (Figure 9 f, 9 g, 9 h).

Similar articles

Cited by

References

    1. Gould K, Lister C. In: Flavonoids: Chemistry, Biochemistry, and Applications. Andersen OM, Markham K, editor. Boca Raton, Florida: CRC Press; 2006. Flavonoid functions in plants; pp. 397–411.
    1. Grotewold E. The genetics and biochemistry of floral pigments. Annu Rev Plant Biol. 2006;57:761–780. doi: 10.1146/annurev.arplant.57.032905.105248. - DOI - PubMed
    1. de Pascual-Teresa S, Sanchez-Ballesta MT. Anthocyanins: from plant to health. Phytochem Rev. 2008;7:281–299. doi: 10.1007/s11101-007-9074-0. - DOI
    1. Kay CD. Aspects of anthocyanin absorption, metabolism and pharmacokinetics in humans. Nutr Res Rev. 2006;19:137–146. doi: 10.1079/NRR2005116. - DOI - PubMed
    1. Stevenson DE, Hurst RD. Polyphenolic phytochemicals - just antioxidants or much more? Cell Mol Life Sci. 2007;64:2900–2916. doi: 10.1007/s00018-007-7237-1. - DOI - PMC - PubMed

Publication types

MeSH terms

Substances

LinkOut - more resources