. 2013 Jan 16;33(3):936-49.
doi: 10.1523/JNEUROSCI.2749-12.2013.

Two novel DEG/ENaC channel subunits expressed in glia are needed for nose-touch sensitivity in Caenorhabditis elegans

Affiliations

Two novel DEG/ENaC channel subunits expressed in glia are needed for nose-touch sensitivity in Caenorhabditis elegans

Lu Han et al. J Neurosci. .

Abstract

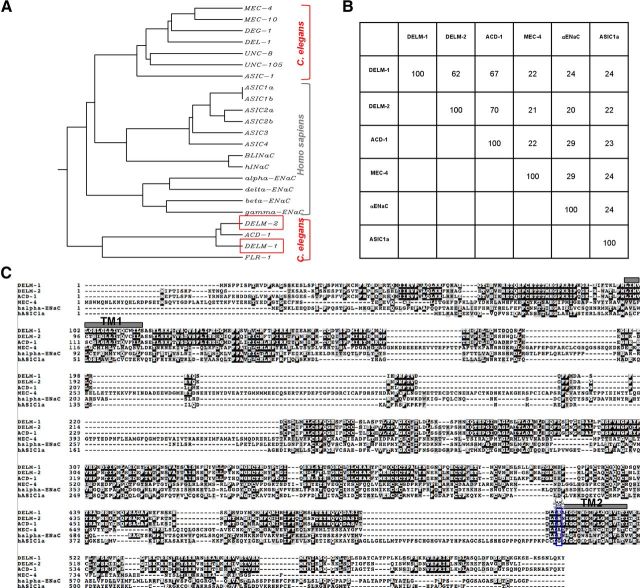
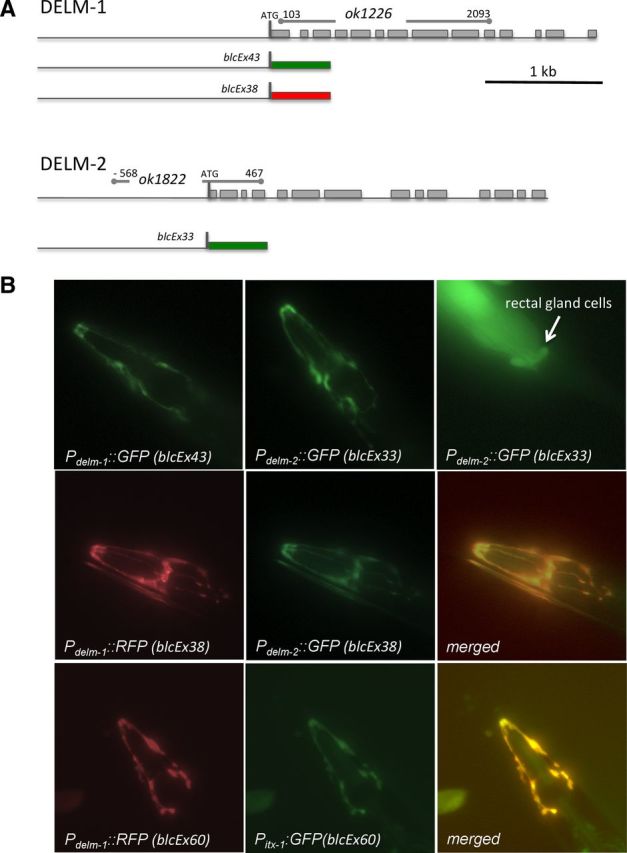
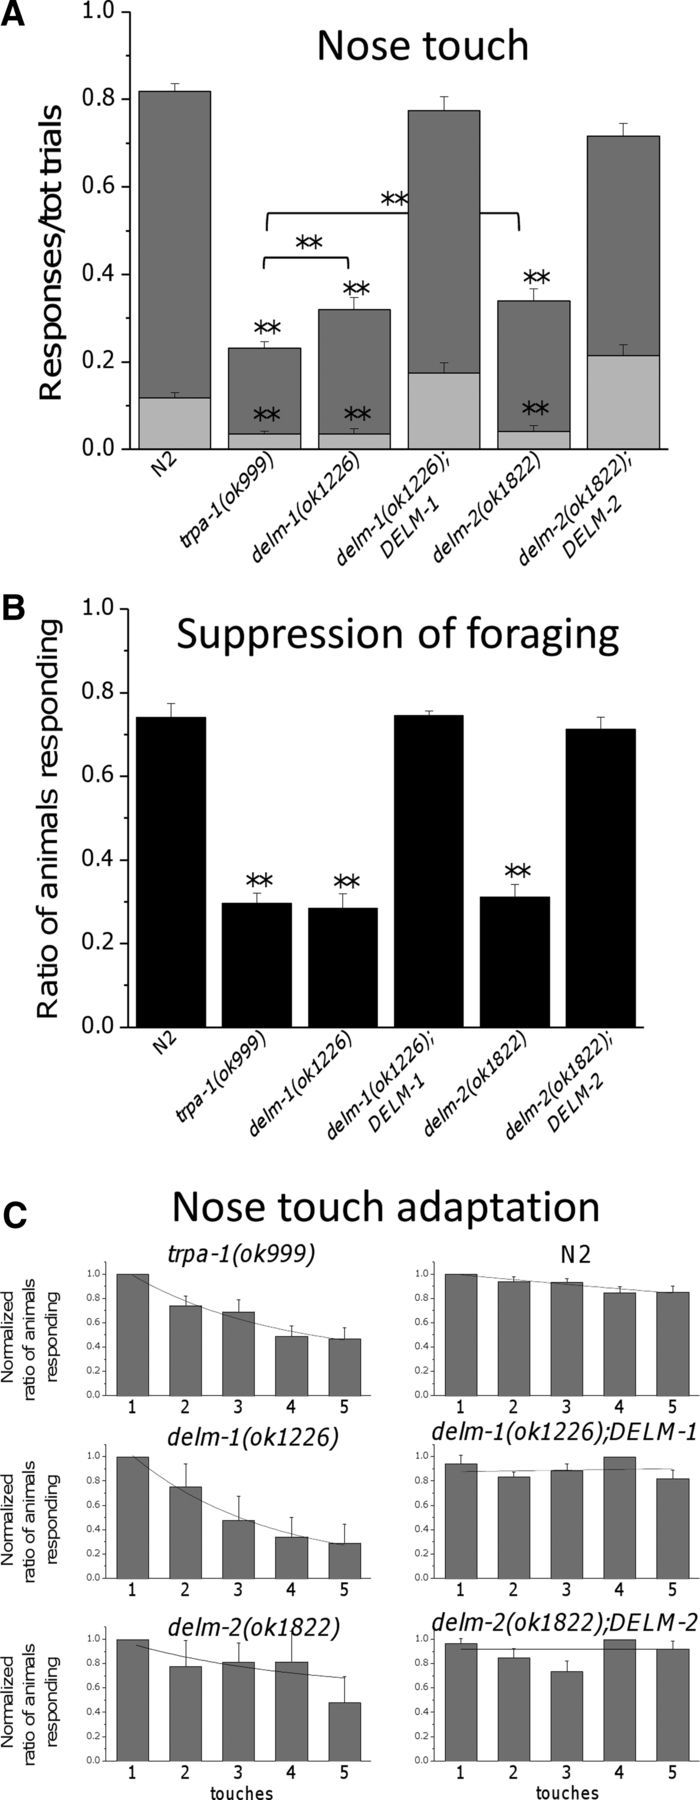
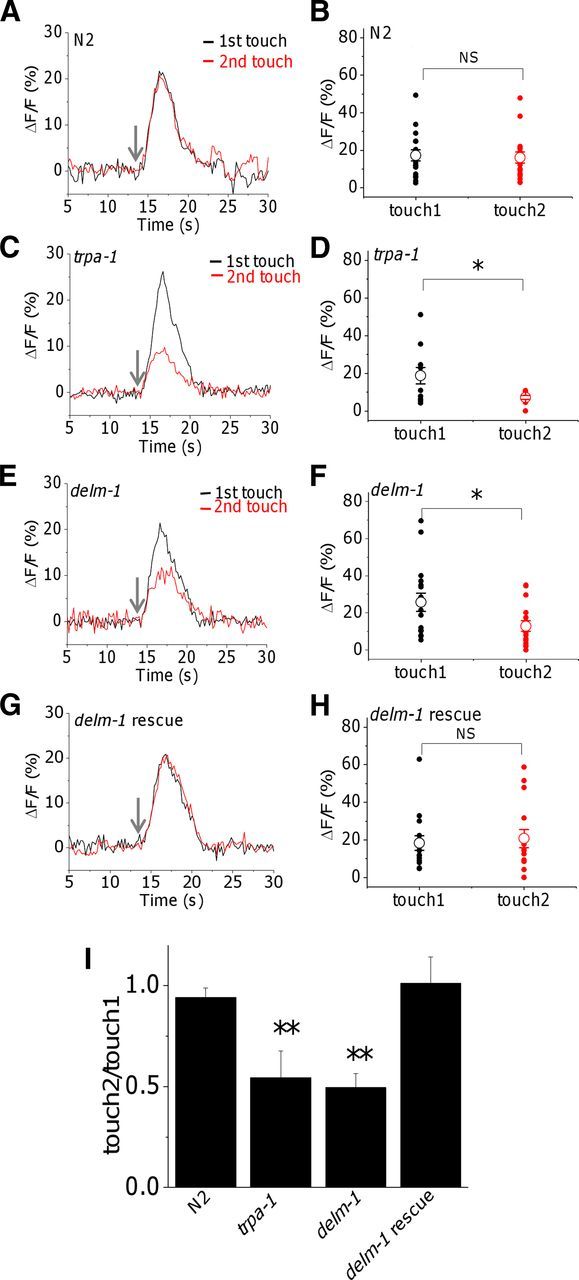
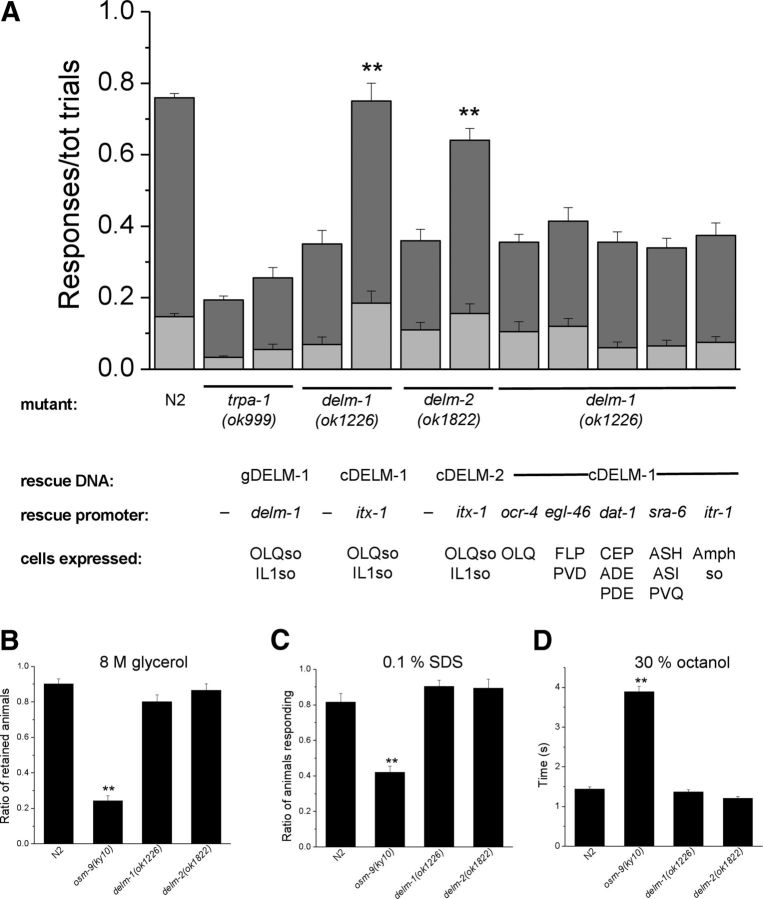
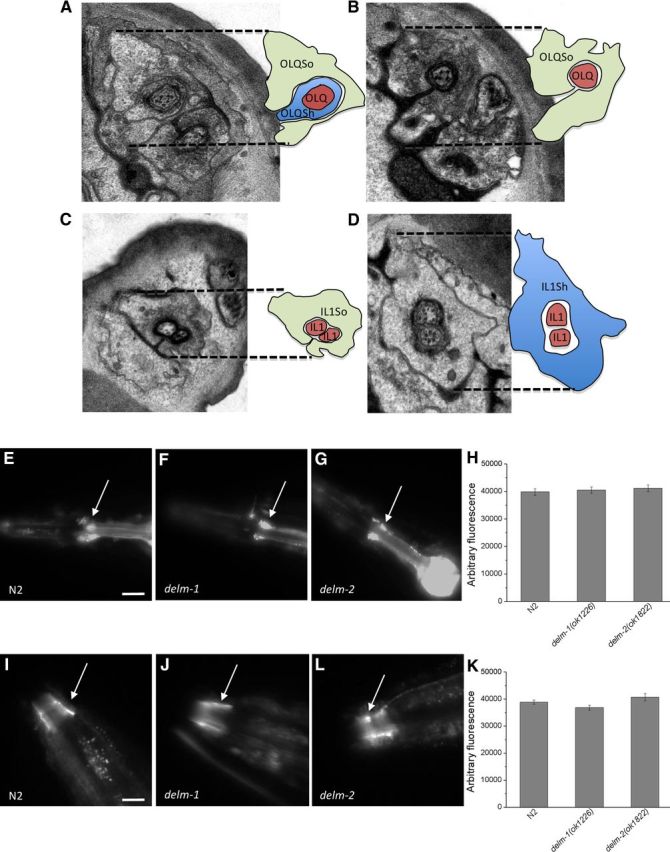
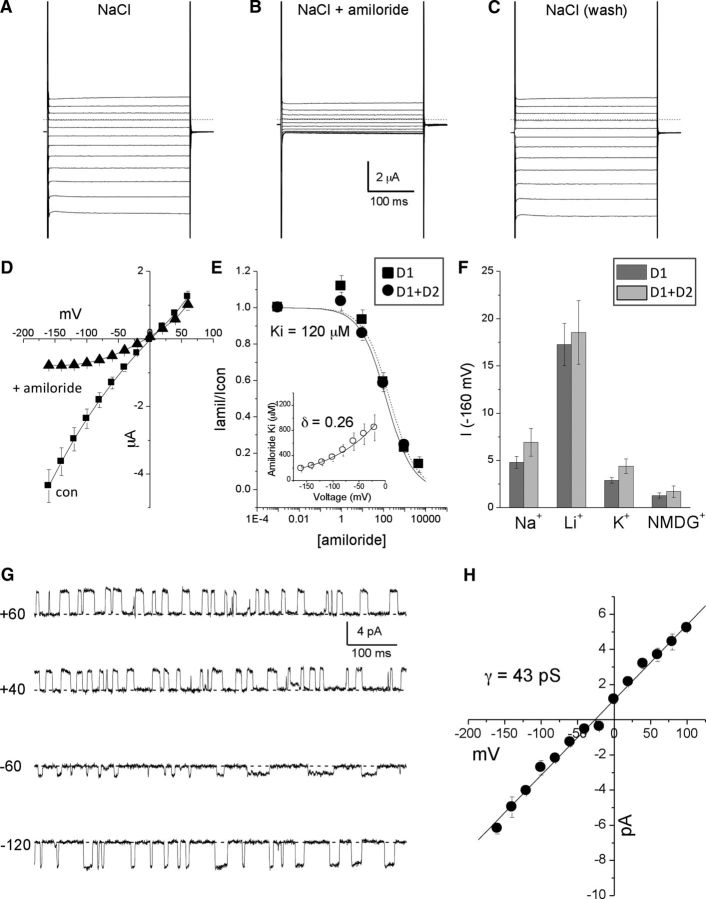
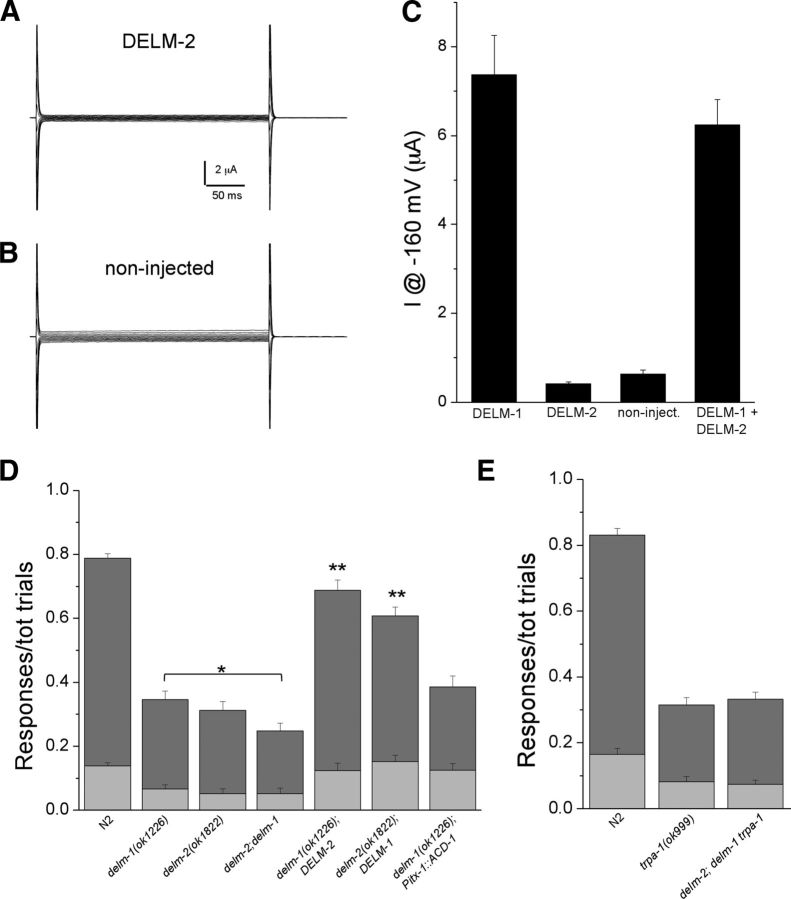
Neuronal DEG/ENaC (degenerin and epithelial Na(+) channel) Na(+) channels have been implicated in touch sensation. For example, MEC-4 is expressed in touch neurons in Caenorhabditis elegans and mediates gentle-touch response. Similarly, homologous mammalian ASIC2 and ASIC3 are expressed in sensory neurons and produce touch phenotypes when knocked out in mice. Here, we show that novel DEG/ENaC subunits DELM-1 and DELM-2 (degenerin-like channel mechanosensory linked-1 and degenerin-like channel mechanosensory linked-2) are expressed in glia associated with touch neurons in C. elegans and that their knock-out causes defects in mechanosensory behaviors related to nose touch and foraging, which are mediated by OLQ and IL1 sensory neurons. Cell-specific rescue supports that DELM-1 and DELM-2 are required cell-autonomously in glia to orchestrate mechanosensory behaviors. Electron microscopy reveals that in delm-1 knock-outs, OLQ and IL1 sensory neurons and associated glia are structurally normal. Furthermore, we show that knock-out of DELM-1 and DELM-2 does not disrupt the expression or cellular localization of TRPA-1, a TRP channel needed in OLQ and IL1 neurons for touch behaviors. Rather, rescue of the delm-1 nose-touch-insensitive phenotype by expression of a K(+) channel in socket glia and of a cationic channel in OLQ neurons suggests that DELM channels set basal neuronal excitability. Together, our data show that DELM-1 and DELM-2 are expressed in glia associated with touch neurons where they are not needed for neuronal structural integrity or cellular distribution of neuronal sensory channels, but rather for their function.


Figures

Figure 1.
Figure 1.
The C. elegans DEG/ENaC channels DELM-1 and DELM-2 share similarity with glial channel ACD-1. A, Dendrogram showing similarity between known C. elegans and human DEG/ENaC channel subunits. B, Percentage of identity between DELM-1, DELM-2 and C. elegans ACD-1 and MEC-4, and human α ENaC and ASIC1a. C, DELM-1 and DELM-2 protein sequences and alignment with ACD-1, MEC-4, α ENaC, and ASIC1a. Identical and similar amino acids are in black and gray backgrounds respectively. Gray boxes TM1 and TM2 indicate the transmembrane domains. The blue box and skull indicate the residue that, when mutated to a bulky amino acid, induces hyperactivation of some of the neuronal DEG/ENaCs (Driscoll and Chalfie, 1991; Champigny et al., 1998; Darboux et al., 1998; García-Añoveros et al., 1998; Brown et al., 2007).
Figure 2.
Figure 2.
DELM-1 and DELM-2 expression patterns. A, Schematic representation of DELM-1 and DELM-2 gene structures, of the location of the deleted region in the knock-outs, and of the fluorescent protein constructs used. Lines and boxes indicate predicted untranslated and translated regions respectively. Green and red boxes designate GFP and RFP respectively. B, Fluorescent micrographs of transgenic C. elegans expressing GFP and RFP under the control of delm-1, delm-2, and itx-1 promoters as indicated. In the second and third rows on the far right, two merged images show overlapping of GFP and RFP signals supporting the idea that DELM-1 and DELM-2 are expressed in OLQ and IL1 glial socket cells (Haklai-Topper et al., 2011). Except for weak fluorescent signal in rectal gland cells associated with expression of Pdelm-2::GFP (upper far right), we could not detect expression of the fluorescent proteins under the control of delm-1 or delm-2 promoter in any other cell type.
Figure 3.
Figure 3.
Knock-out of DELM-1 and DELM-2 reduces C. elegans nose-touch sensitivity and foraging suppression. A, Ratios of reversals (dark-gray bars) and head withdrawals (light-gray bars) in wild type (N2, 0.701 ± 0.016 and 0.117 ± 0.012), delm-1(ok1226) (0.284 ± 0.026 and 0.036 ± 0.010), delm-2(ok1822) (0.298 ± 0.027 and 0.040 ± 0.013), delm-1;DELM-1 (0.600 ± 0.031 and 0.174 ± 0.022) and delm-2;DELM-2 (0.501 ± 0.028 and 0.214 ± 0.024) C. elegans upon nose-touch stimulation. trpa-1(ok999) mutant was used as a control (0.196 ± 0.015 and 0.007). Number of animals assayed was 160, 157, 50, 70, 59, and 69. B, delm-1 and delm-2 mutant C. elegans do not suppress head oscillations associated with foraging when moving backward in response to anterior touch. Ratios of animals responding were as follows: 0.740 ± 0.032 for N2 (wild type), 0.296 ± 0.023 for trpa-1, 0.283 ± 0.034 for delm-1, 0.744 ± 0.011 for delm-1;DELM-1, 0.311 ± 0.029 for delm-2, and 0.711 ± 0.029 for delm-2;DELM-2. Number of assays was 9, 9, 4, 3, 3, and 3, with 30 animals tested in each assay. Data are expressed as means ± SE, **p < 0.01 (ANOVA), statistically significant difference with wild type or between two indicated strains. C, The ratio of animals responding to each of the five consecutive touches (30 s interval) was calculated for each experiment, averaged, and then normalized. Number of assays was 16 for trpa-1(ok999), 5 for delm-1(ok1226), 6 for delm-2(ok1822), 15 for N2 (wild type), 7 for delm-1(ok1226);DELM-1, and 7 for delm-2(ok1822);DELM-2 with 10 animals tested in each assay. Data are means ± SE and are fitted by exponential decay. The ratio of animals that responded to the first touch, before normalization, was as follows: 0.38 ± 0.06 ** for trpa-1(ok999), 0.6 ± 0.08 ** for delm-1(ok1226), 0.51 ± 0.13 ** for delm-2(ok1822), 0.89 ± 0.04 for N2 (wild type), 0.83 ± 0.07 for delm-1(ok1226);DELM-1, and 0.78 ± 0.04 for delm-2(ok1822);DELM-2. Data were fitted by single exponential decay. Tau values were 2.75 for trpa-1(ok999), 2.55 for delm-1(ok1226), 3.13 for delm-2(ok1822), 26.7 for N2 (wild type), and 20.1 for delm-1(ok1226);DELM-1. Fit for delm-2(ok1822);DELM-2 with single exponential was not optimal and yielded unusually large tau values (>25,000). Nevertheless, data are consistent with slower adaptation in this transgenic strain compared with delm-2(ok1822). The average normalized ratio of animals that responded to the fifth touch was 0.468 ± 0.09 ** for trpa-1(ok999), 0.292 ± 0.015 ** for delm-1(ok1226), 0.480 ± 0.21 for delm-2(ok1822), 0.852 ± 0.05 for N2 (wild type) *, 0.823 ± 0.07 for delm-1(ok1226);DELM-1, and 0.921 ± 0.06 for delm-2(ok1822);DELM-2. *p ≤ 0.05; **p ≤ 0.01; by ANOVA. Statistics were by comparison with the first touch.
Figure 4.
Figure 4.
Effect of knock-out of delm-1 on touch-induced calcium transients in OLQ sensory neurons. A, C, E, G, Representative Ca2+ transients evoked in OLQ neurons of wild-type animals and mutants as indicated, following two consecutive touches to the nose (5 min interval). The arrows point to when the touch was delivered. B, D, F, H, Quantification of the Ca2+ transients generated by the first and second touches. Individual values and averages are shown by filled and open symbols respectively. The average fluorescence changes (ΔF/F) were as follows: 17.2 ± 3 for the first touch and 16 ± 3 for the second touch (n = 17), in N2 (wild type); 18.7 ± 4.4 for the first touch and 7.1 ± 1 for the second touch (n = 11), in trpa-1; 25.8 ± 4.9 for the first touch and 12.9 ± 2.9 for the second touch (n = 16), in delm-1; and 18.3 ± 3.8 for the first touch and 20.7 ± 4.8 for the second touch (n = 15), in delm-1 rescue (delm-1;Pitx-1::cDELM-1). Note that there is no statistical difference for calcium transients induced by the first touch between WT and all the mutants. I, Averages of the ratios of calcium transients generated by the second and first touches. *p ≤ 0.05 by t test; NS, not significantly different.
Figure 5.
Figure 5.
DELM-1 and DELM-2 are required cell-autonomously in glia for nose-touch behavior. A, Ratios of reversals (dark gray) and head withdrawals (light gray) in mutants and transgenic strains as indicated. Ratios of reversals and head withdrawals were as follow: N2 (wild-type), 0.617 ± 0.012 and 0.146 ± 0.008; trpa-1, 0.160 ± 0.010 and 0.038 ± 0.005; trpa-1;DELM-1, 0.200 ± 0.029 and 0.056 ± 0.014; delm-1, 0.280 ± 0.039 and 0.070 ± 0.019; delm-1;Pitx-1::cDELM-1, 0.565 ± 0.049 and 0.185 ± 0.033; delm-2, 0.250 ± 0.031 and 0.110 ± 0.021; delm-2;Pitx-1::cDELM-2, 0.485 ± 0.032 and 0.156 ± 0.026; delm-1;Pocr-4::cDELM-1, 0.250 ± 0.022 and 0.105 ± 0.027; delm-1;Pegl-46::cDELM-1, 0.295 ± 0.036 and 0.120 ± 0.022; delm-1;Pdat-1::cDELM-1, 0.295 ± 0.029 and 0.060 ± 0.016; delm-1;Psra-6::cDELM-1, 0.275 ± 0.026 and 0.065 ± 0.016; and delm-1;Pitr-1::cDELM-1, 0.300 ± 0.034 and 0.075 ± 0.016. Number of animals assayed was 299, 259, 50, 40, 70, 40, 40, 40, 40, 40, 40, and 80. B–D, delm-1 and delm-2 mutants are repelled by 8 m glycerol (B, ratios of retained animals was 0.902 ± 0.027 for N2, 0.243 ± 0.028 for osm-9, 0.801 ± 0.037 for delm-1, and 0.864 ± 0.037 for delm-2), by 0.1% SDS (C, ratios of animals responding was 0.816 ± 0.049 for N2, 0.420 ± 0.033 for osm-9, 0.904 ± 0.034 for delm-1, and 0.894 ± 0.051 for delm-2), and by 30% octanol (D, time to response was 1.438 ± 0.057 s for N2, 3.890 ± 0.141 s for osm-9, 1.366 ± 0.057 s for delm-1, and 1.209 ± 0.044 s for delm-2) to the same degree as wild-type animals. osm-9(ky10), which abolishes all ASH-mediated sensory responses (Colbert et al., 1997), serves as a control. Number of assays were 14, 14, 22, and 7 for N2 (wild type), osm-9(ky10), delm-1(ok1226), and delm-2(ok1822) with 20 animals per strain used in each assay for 8 m glycerol, 5 per strain with 20 animals tested in each assay for 0.1% SDS, and 105, 100, 101, and 105 animals tested for 30% octanol. Data are means ± SE. **p < 0.01 (ANOVA).
Figure 6.
Figure 6.
Ultrastructure of OLQ and IL1 neurons and glia, and TRPA-1::GFP expression and localization in delm mutants. A–D, EM images show normal structures of OLQ (A, B) and IL1 (C, D) touch neurons and associated socket glia (So) and sheath glia (Sh) in delm-1 mutants. Each image has a schematic representation on the right. E–G, Fluorescent micrographs of transgenic C. elegans expressing TRPA-1::GFP. A representative image is shown for wild type (N2), delm-1, and delm-2 mutants. Arrows point to OLQ and IL1 neurons. Scale bar, 100 μm. H, Quantification of the GFP signal in TRPA-1::GFP-expressing neurons. Number of animals analyzed was 10, 10, and 9 for N2 (wild type), delm-1, and delm-2 mutants respectively. I, J, Representative photographs of TRPA-1::GFP localization at the cilia of sensory neurons (arrows) in wild type (N2), delm-1, and delm-2 mutants as indicated. Scale bar, 40 μm. K, Quantification of the level of GFP signal at the cilia of sensory neurons. Number of animals analyzed was 16, 13, and 11 for N2 (wild type), delm-1, and delm-2 mutants respectively.
Figure 7.
Figure 7.
Electrophysiological properties of DELM-1 channel expressed in Xenopus oocytes. A, Example of DELM-1 currents elicited by voltage steps from −160 to +60 mV from a holding potential at −30 mV. A physiological NaCl solution was used. B, The same oocyte was perfused with a physiological NaCl solution plus 500 μm amiloride. C, Washout. D, DELM-1 current–voltage relationships in control (squares, n = 8) and the presence of 500 μm amiloride (triangles, n = 8). The relatively low reversal potential of the current reflected the phenomenon of Na+ overload (Goodman et al., 2002; Bianchi et al., 2004; Wang et al., 2008). E, Amiloride dose–response curves for DELM-1 (n = 7, squares) and DELM-1 plus DELM-2 (n = 6, circles). Data are fitted by sigmoid curves. The Kis were 120 and 190 μm for DELM-1 and DELM-1 plus DELM-2 currents, respectively. Insert shows voltage dependence of amiloride blockade for DELM-1. Data were fitted using a Woodhull model (Woodhull, 1973) (δ = 0.26, n = 7). F, Ionic selectivity for DELM-1 (dark gray) and DELM-1 plus DELM-2 currents (light gray). Currents were recorded at −160 mV (n = 6 for DELM-1; n = 5 for DELM-1 plus DELM-2). G, Example of DELM-1 single-channel currents at the indicated voltages. H, DELM-1 single-channel current–voltage relationships (n = 3). Data are means ± SE.
Figure 8.
Figure 8.
DELM-1 and DELM-2 can function independently in vivo. A, B, Examples of currents in a Xenopus oocyte injected with DELM-2 cRNA (A) and in a noninjected oocyte (B). Currents are elicited by voltage steps from −160 to +60 mV in 20 mV increments from a holding potential of −30 mV. C, Currents measured at −160 mV in oocytes expressing DELM-1 (n = 33, 7.36 ± 0.88 μA), DELM-2 (n = 8, 0.41 ± 0.04 μA), in noninjected oocytes (n = 7, 0.62 ± 0.09 μA), and DELM-1 plus DELM-2 (n = 33, 6.23 ± 0.57 μA). D, Ratios of reversals (dark-gray bar) and head withdrawals (light-gray bar) of N2 (wild type, 0.650 ± 0.014 and 0.138 ± 0.010), delm-1 (0.280 ± 0.026 and 0.066 ± 0.013), delm-2 (0.260 ± 0.028 and 0.052 ± 0.016), delm-2;delm-1 double mutants (0.196 ± 0.024 and 0.052 ± 0.016), delm-1 mutants overexpressing DELM-2 (0.564 ± 0.032 and 0.124 ± 0.022), delm-2 mutants overexpressing DELM-1 (0.456 ± 0.027 and 0.152 ± 0.020), and delm-1 mutants expressing ACD-1 in socket cells (0.260 ± 0.035 and 0.125 ± 0.021) upon nose-touch stimulation. Number of animals tested was 240, 60, 50, 50, 50, 50, and 40. E, Same as in D for N2 (0.665 ± 0.02 and 0.165 ± 0.018), trpa-1 (0.232 ± 0.022 and 0.082 ± 0.014) and delm-2;delm-1 trpa-1 (0.257 ± 0.020 and 0.075 ± 0.012) mutants. Number of animals tested was 80 each. Data are means ± SE.
Figure 9.
Figure 9.
Effect of expression of cationic channels in OLQ neurons and K+ channels in socket glia on delm-1 knock-out nose-touch defects. A, Ratios of reversals (dark-gray bar) and head withdrawals (light-gray bar) assayed at 22°C for N2 (wild type, 0.640 ± 0.022 and 0.160 ± 0.017), delm-1 (0.375 ± 0.026 and 0.065 ± 0.016), delm-1 expressing mosquito TRPA1 (AgTRPA1) in OLQ neurons (delm-1(ok1226);Pocr-4::AgTRPA1, 0.430 ± 0.030 and 0.070 ± 0.019), trpa-1 knock-out (0.290 ± 0.025 and 0.045 ± 0.013), and trpa-1 knock-out expressing AgTRPA1 in OLQ neurons (trpa-1(ok999);Pocr-4::AgTRPA1, 0.265 ± 0.029 and 0.065 ± 0.016). n = 80, 40, 40, 40, and 40. B, Same as in A except that behavioral assays were conducted at 28°C. N2 (wild type, 0.600 ± 0.024 and 0.147 ± 0.017), delm-1 (0.325 ± 0.028 and 0.090 ± 0.020), delm-1 expressing mosquito TRPA1 (AgTRPA1) in OLQ neurons (delm-1(ok1226);Pocr-4::AgTRPA1, 0.640 ± 0.026 and 0.100 ± 0.017), trpa-1 knock-out (0.235 ± 0.028 and 0.050 ± 0.013) and trpa-1 knock-out expressing AgTRPA1 in OLQ neurons (trpa-1(ok999);Pocr-4::AgTRPA1, 0.235 ± 0.032 and 0.070 ± 0.018) (n = 80, 40, 40, 40, and 40). C, Example of ionic currents recorded in an oocyte injected with IRK-2 cRNA and perfused with a solution containing 100 mm KCl. Currents were elicited by voltage steps from −160 to + 80 mV in 20 mV increments. The dashed line is the zero current level. IRK-2 currents were obtained by subtracting the BaCl2 resistant current from the control currents. BaCl2 is a blocker of inward rectifier K+ channels and was used at the concentration of 1 mm. D, Average IRK-2 current–voltage relationship shows that this channel conducts outward current (n = 12). E, Ratios of reversals (dark-gray bar) and head withdrawals (light-gray bar) of N2 (wild type), delm-1, delm-1 expressing IRK-2 in socket glia, delm-2;delm-1 double mutant expressing IRK-2 in socket glia, and wild type expressing IRK-2 in socket glia (n = 160, 40, 50, and 30, respectively). F, Same as in E for N2 (wild type), trpa-1 knock-out, and trpa-1 knock-out expressing IRK-2 in socket glia (n = 40 for each). Data are means ± SE. **p < 0.01 (ANOVA); NS, nonsignificant.

Similar articles

Cited by

References

    1. Adams CM, Anderson MG, Motto DG, Price MP, Johnson WA, Welsh MJ. Ripped pocket and pickpocket, novel Drosophila DEG/ENaC subunits expressed in early development and in mechanosensory neurons. J Cell Biol. 1998;140:143–152. - PMC - PubMed
    1. Alkema MJ, Hunter-Ensor M, Ringstad N, Horvitz HR. Tyramine functions independently of octopamine in the Caenorhabditis elegans nervous system. Neuron. 2005;46:247–260. - PubMed
    1. Altun ZF, Hall DH. Nervous system, neuronal support cells. WormAtlas. 2010
    1. Askwith CC, Cheng C, Ikuma M, Benson C, Price MP, Welsh MJ. Neuropeptide FF and FMRFamide potentiate acid-evoked currents from sensory neurons and proton-gated DEG/ENaC channels. Neuron. 2000;26:133–141. - PubMed
    1. Babini E, Paukert M, Geisler HS, Grunder S. Alternative splicing and interaction with di- and polyvalent cations control the dynamic range of acid-sensing ion channel 1 (ASIC1) J Biol Chem. 2002;277:41597–41603. - PubMed

Publication types

MeSH terms

Substances

LinkOut - more resources