. 2013 Jan 16;33(3):1068-87.
doi: 10.1523/JNEUROSCI.3396-12.2013.

Allosteric modulation of an excitatory amino acid transporter: the subtype-selective inhibitor UCPH-101 exerts sustained inhibition of EAAT1 through an intramonomeric site in the trimerization domain

Affiliations

Allosteric modulation of an excitatory amino acid transporter: the subtype-selective inhibitor UCPH-101 exerts sustained inhibition of EAAT1 through an intramonomeric site in the trimerization domain

Bjarke Abrahamsen et al. J Neurosci. .

Abstract

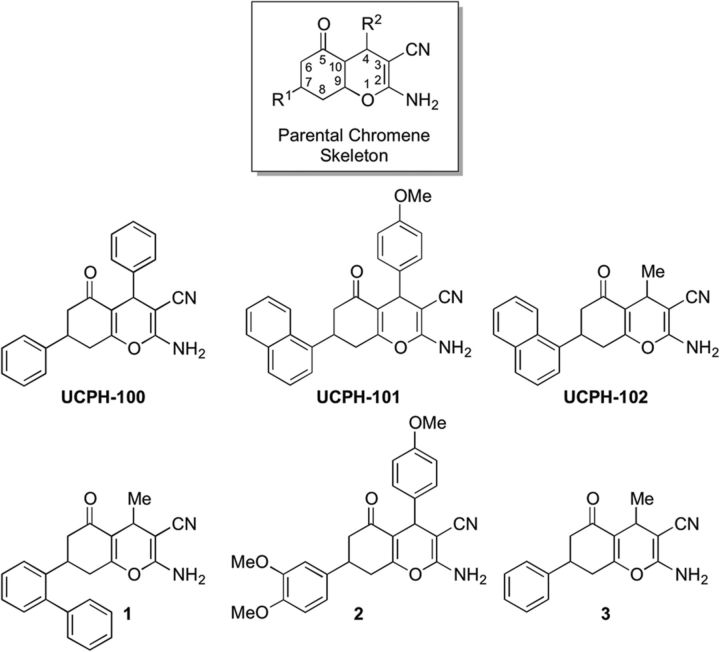
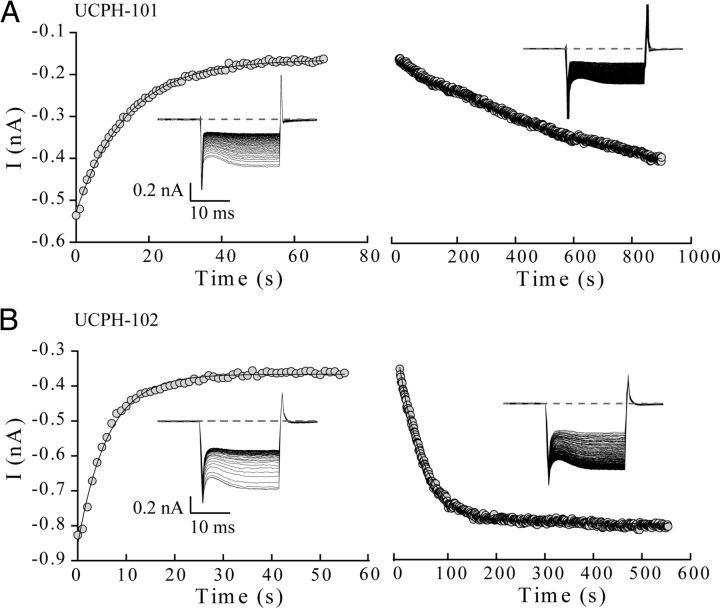
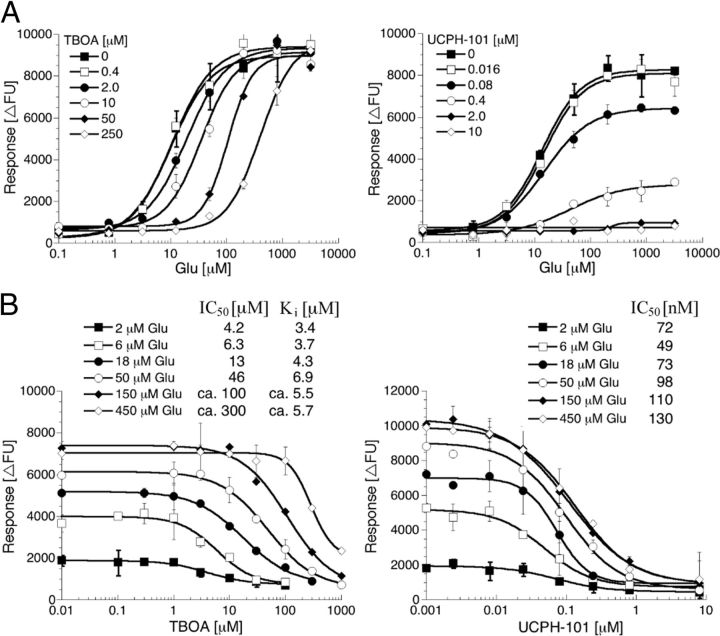
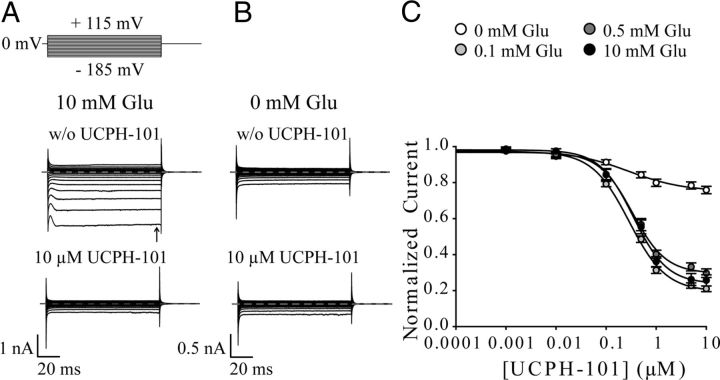
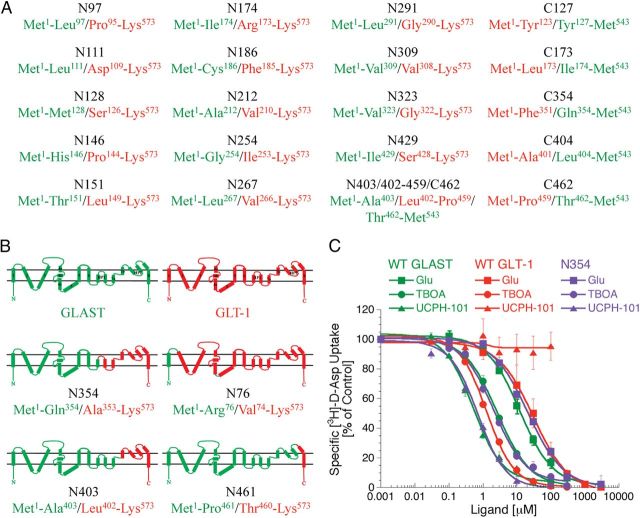
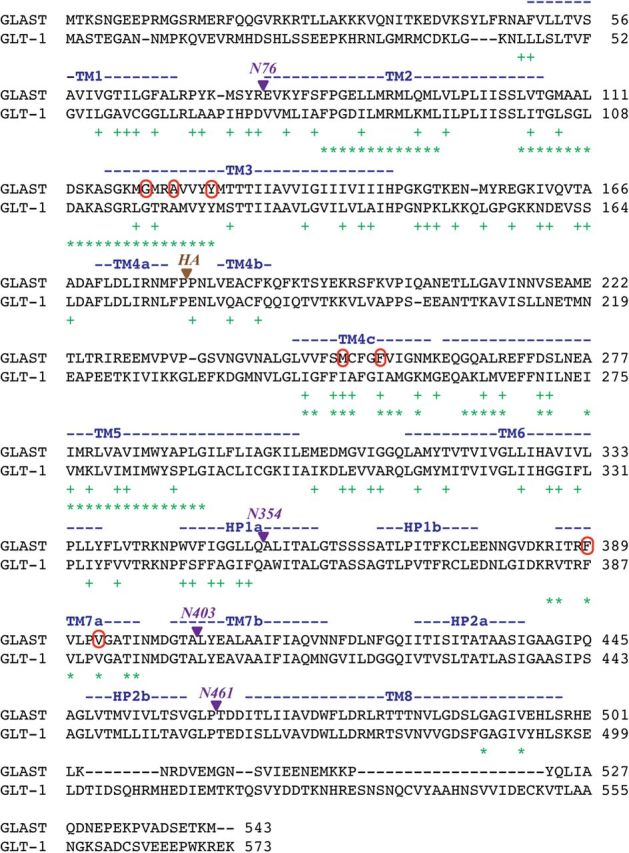
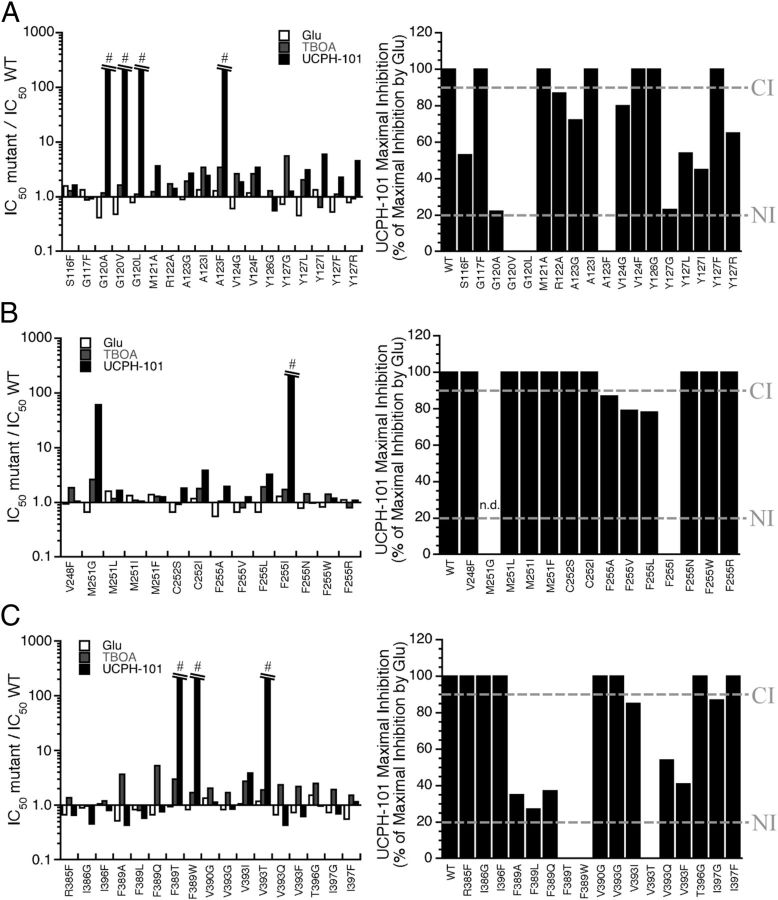
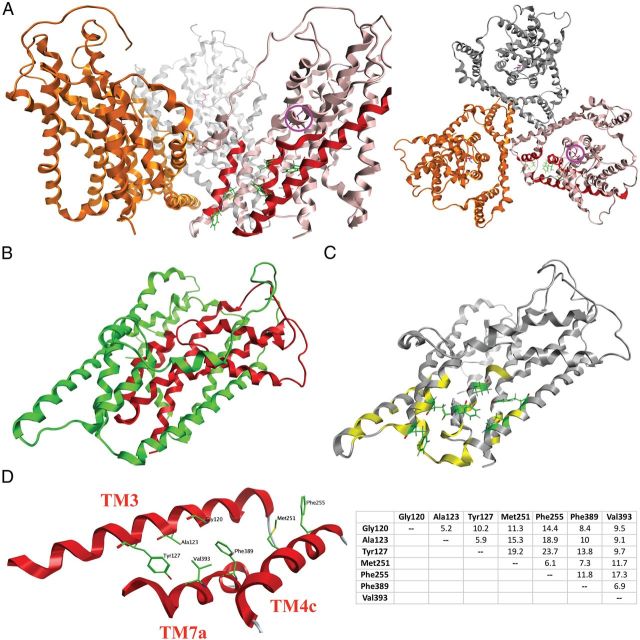
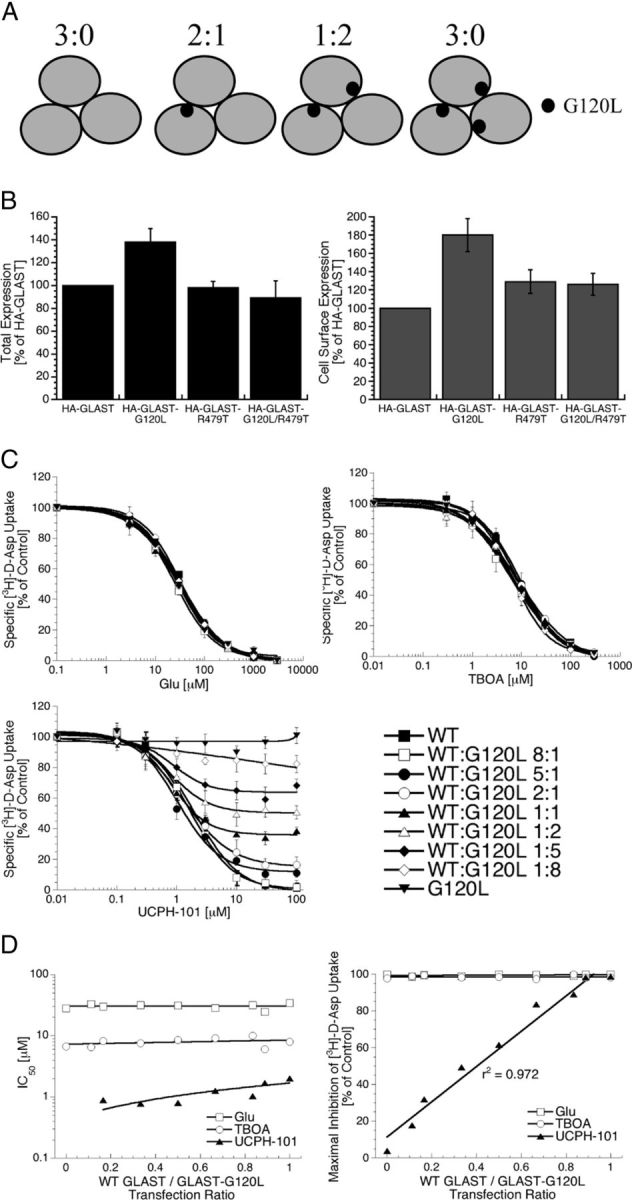
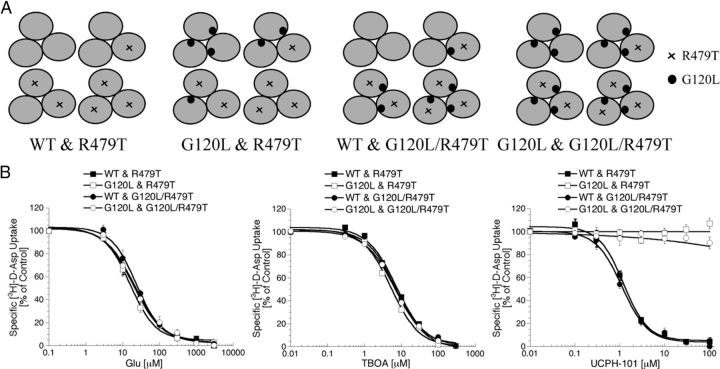
In the present study, the mechanism of action and molecular basis for the activity of the first class of selective inhibitors of the human excitatory amino acid transporter subtype 1 (EAAT1) and its rodent ortholog GLAST are elucidated. The previously reported specificity of UCPH-101 and UCPH-102 for EAAT1 over EAAT2 and EAAT3 is demonstrated to extend to the EAAT4 and EAAT5 subtypes as well. Interestingly, brief exposure to UCPH-101 induces a long-lasting inactive state of EAAT1, whereas the inhibition exerted by closely related analogs is substantially more reversible in nature. In agreement with this, the kinetic properties of UCPH-101 unblocking of the transporter are considerably slower than those of UCPH-102. UCPH-101 exhibits noncompetitive inhibition of EAAT1, and its binding site in GLAST has been delineated in an elaborate mutagenesis study. Substitutions of several residues in TM3, TM4c, and TM7a of GLAST have detrimental effects on the inhibitory potency and/or efficacy of UCPH-101 while not affecting the pharmacological properties of (S)-glutamate or the competitive EAAT inhibitor TBOA significantly. Hence, UCPH-101 is proposed to target a predominantly hydrophobic crevice in the "trimerization domain" of the GLAST monomer, and the inhibitor is demonstrated to inhibit the uptake through the monomer that it binds to exclusively and not to affect substrate translocation through the other monomers in the GLAST trimer. The allosteric mode of UCPH-101 inhibition underlines the functional importance of the trimerization domain of the EAAT and demonstrates the feasibility of modulating transporter function through ligand binding to regions distant from its "transport domain."


Figures

Figure 1.
Figure 1.
Chemical structures of UCPH-101 and the five additional analogs used in this study. The parental chromene skeleton with its R1 and R2 substituents is given for reference.
Figure 2.
Figure 2.
Effects of UCPH-101 and UCPH-102 on whole-cell currents of EAAT1, EAAT4, and EAAT5. A, C, E, Representative whole-cell currents from tsA201 cells expressing EAAT1 (A), EAAT4 (C), and EAAT5 (E) in the absence (top) and presence (bottom) of 10 μm UCPH-101. The compound was added to bath solution containing 140 mm NaNO3 and 0.5 mm Glu, and cells were dialyzed with 115 mm KNO3. Dotted lines represent 0 nA. B, D, F, Current–voltage relationship of EAAT1 (n = 14) (B), EAAT4 (n = 16) (D), and EAAT5 (n = 11) (F) in the absence (formula image
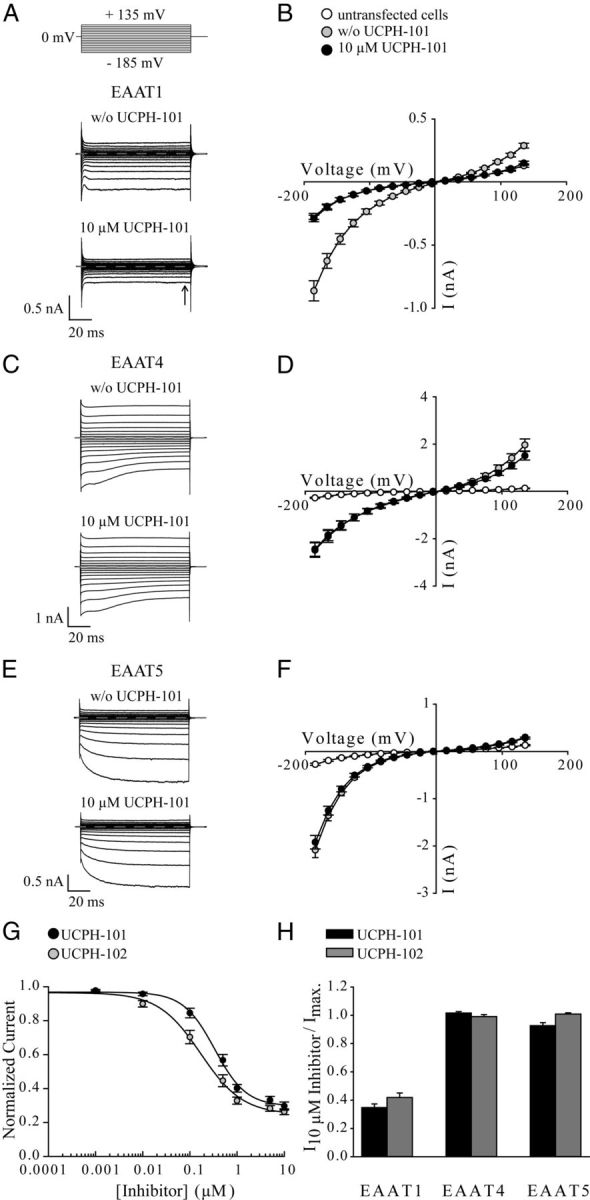
) or presence (●) of 10 μ
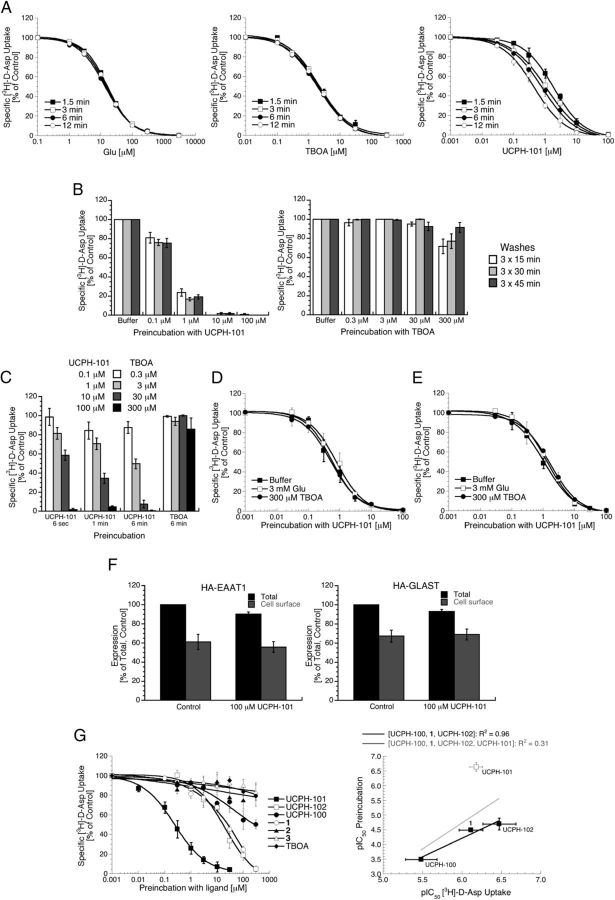
m UCPH-101. Untransfected tsA201 cells perfused with external solution containing 0.5 mm Glu were used as control (○) (n = 9). G, Application of different concentrations of UCPH-101 or UCPH-102 to cells expressing EAAT1 at a voltage step of −185 mV (solutions as in AF). Data were normalized to the current in absence of compounds. Fitting concentration dependences of EAAT1 steady-state currents (arrow in Fig. 2A) with a Hill equation provided dissociation constants of 0.34 ± 0.03 μm (Hill coefficient = 1.3 ± 0.13, n ≥ 9) for UCPH-101 and 0.17 ± 0.02 μm (Hill coefficient = 0.97 ± 0.11, n ≥ 7) for UCPH-102. H, Effect of 10 μm UCPH-101 or 10 μm UCPH-102 on anion currents of EAAT1, EAAT4, and EAAT5 at a voltage step of −185 mV (solutions as in AF). To determine the inhibitory effect of UCPH-101 (black bar) and UCPH-102 (gray bar) on EAAT-mediated anion currents, we divided steady-state currents in the presence of UCPH-101/UCPH-102 by currents in the absence of compounds. Data are given as mean ± SE.
Figure 3.
Figure 3.
UCPH-101 induces a long-lasting inactive state of EAAT1. A, The inhibitory potency of UCPH-101 at EAAT1-HEK293 cells increases with the length of the incubation period in the [3H]-d-Asp uptake assay, whereas those of Glu and TBOA do not. The IC50 (pIC50 ± SEM) values of UCPH-101 using incubation periods of 1.5, 3, 6, and 12 min were 1.9 μm (5.71 ± 0.05), 1.1 μm (5.97 ± 0.07), 0.82 μm (6.09 ± 0.05), and 0.44 μm (6.36 ± 0.04), respectively (n = 4). B, Preincubation of EAAT1 with UCPH-101 induces long-lasting inhibition of transporter function. EAAT1-HEK293 cells were incubated with buffer or buffer supplemented with various concentrations of UCPH-101 or TBOA for 15 min and washed for 3 × 15, 3 × 30, or 3 × 45 min before determination of specific [3H]-d-Asp uptake (n = 4). C, The degree of EAAT1 inhibition induced by preincubation with UCPH-101 increases with the duration of the preincubation. EAAT1-HEK293 cells were incubated with buffer or with buffer supplemented with UCPH-101 or TBOA for various time periods, and washed for 3 × 15 min before determination of specific [3H]-d-Asp uptake (n = 3). D, E, Glu and TBOA do not alleviate the long-lasting effects of UCPH-101 preincubation on EAAT1 function. D, EAAT1-HEK293 cells were incubated for 1 min with buffer (■) or with buffer supplemented with 3 mm Glu (□) or 300 μm TBOA (●), then incubated for 2 min with various concentrations of UCPH-101 in buffer (■) or in buffer supplemented with 3 mm Glu (□) or 300 μm TBOA (●), and then washed for 3 × 15 min before determination of specific [3H]-d-Asp uptake (n = 3). E, EAAT1-HEK293 cells were incubated for 1 min with various concentrations of UCPH-101 in buffer, then incubated for 2 min with buffer (■) or with buffer supplemented with 3 mm Glu (□) or 300 μm TBOA (●), and then washed for 3 × 15 min before determination of specific [3H]-d-Asp uptake (n = 4). F, Preincubation with UCPH-101 does not change the cell surface expression levels of EAAT1 and GLAST. HA-EAAT1- or HA-GLAST-expressing tsA201 cells were incubated with buffer or buffer supplemented with 100 μm UCPH-101 for 15 min, and washed for 3 × 15 min before the ELISA was performed (n = 4). The cell surface expression of neither HA-EAAT1 nor HA-GLAST in buffer- and UCPH-101-pretreated cells differed significantly. Preexposure of cells to the inhibitor resulted in a small but significant decrease in total expression levels (ANOVA: HA-EAAT1: p = 0.048, HA-GLAST: p = 0.049). G, Effects on EAAT1 function of preincubation with UCPH-101 and five analogs. Left, EAAT1-HEK293 cells were preincubated with buffer supplemented with various concentrations of the inhibitors for 15 min, and washed for 3 × 15 min before determination of specific [3H]-d-Asp uptake (n = 4). Right, Relationship between pIC50 values for the UCPH-101, UCPH-102, UCPH-100, and 1 in the [3H]-d-Asp uptake assay and the pIC50 values obtained for the compounds in the preincubation experiment. The R2 values for the fittings of the data for UCPH-100, 1, and UCPH-102 (black line) and the data for UCPH-100, 1, UCPH-102, and UCPH-101 (gray line) are given.
Figure 4.
Figure 4.
Unbinding of UCPH-101 and UCPH-102 from EAAT1 occurs on different time scales. A, B, Left, EAAT1 current-responses to application of 1 μm UCPH-101 (A) or 1 μm UCPH-102 (B) at repetitive voltage steps of −145 mV recorded with a time interval of 1 s between successive steps. Anion current peak amplitudes decayed with time constants of 10.5 ± 1.4 s (n = 11) after application of UCPH-101 and 4.0 ± 1.2 s (n = 6) after application of UCPH-102. Right, Unbinding of UCPH-101 (A) and UCPH-102 (B) from EAAT1 induced by application of inhibitor-free solution to cells expressing the transporter. Peak current amplitudes increased with time constants of 740.4 ± 100 s for UCPH-101 (n = 9) and 55.7 ± 4.8 s for UCPH-102 (n = 6). Currents were fitted with an exponential function. Data are given as mean ± SE. Insets, Representative current recordings.
Figure 5.
Figure 5.
The nature of inhibition exerted by TBOA and UCPH-101 at EAAT1-HEK293 cells in the FLIPR Membrane Potential Blue assay. A, Concentration–response curves for Glu in the absence or the presence of five different concentrations of TBOA or UCPH-101. B, Concentration–inhibition curves for TBOA and UCPH-101 using six different Glu concentrations. Ki values for TBOA were calculated using the Cheng-Prusoff equation [Ki = IC50/(1 + [Glu]/Km)] (Craig, 1993). The figures show data from single representative experiments of a total of 3 or 4 experiments, and data are given as mean ± SD of duplicate determinations.
Figure 6.
Figure 6.
UCPH-101 dependence of EAAT1 in the presence of various Glu concentrations. A, B, EAAT1 whole-cell currents in the presence of 10 mm external Glu (A) or in the absence of external Glu (B) without UCPH-101 (top) or with 10 μm UCPH-101 (bottom). C, UCPH-101 concentration dependence of EAAT1 currents at a voltage step of −185 mV. Data were normalized to the current in absence of external UCPH-101, and mean current amplitudes from different cells were fitted with a Hill equation.
Figure 7.
Figure 7.
The selectivity determinant for UCPH-101 resides within the Met1-Gln354 region of GLAST. A, Selected nonfunctional GLAST/GLT-1 chimeras. GLAST and GLT-1 regions in the chimeras are given in green and red, respectively. The prefixes N and C in the chimera names refer to the presence of GLAST parts in the N- and C-terminal, respectively, and the numbers refer to the first or last GLAST residue at the fusion point of C- and N-chimeras, respectively. B, Topology of WT GLAST and WT GLT-1 and the functional GLAST/GLT-1 chimeras N76, N354, N403, and N461. C, Concentration–inhibition curves for Glu, TBOA, and UCPH-101 at WT GLAST, WT GLT-1, and chimera N354 stably expressed in polyclonal HEK293 cells in the [3H]-d-Asp uptake assay (n = 4).
Figure 8.
Figure 8.
Alignment of amino acid sequences of rat GLAST and GLT-1 (extracted from an alignment of human EAAT1, EAAT2, and EAAT3 and rat GLAST, GLT-1, and EAAC1). The TM1–8 and HP1–HP2 regions are specified above the sequences. Residues in the Phe50-Gln354 segment of GLAST mutated in the preliminary mutagenesis study (+) and residues mutated in mutants stably expressed in polyclonal HEK293 in later stages of the project (*) are indicated below the sequences. The fusion points of GLAST/GLT-1 chimeras N76, N354, N403, and N461 and the site of HA-tag insertion in GLAST are given. The Gly120, Ala123, Tyr127, Met251, Phe255, Phe389, and Val393 residues in GLAST where selected mutations were found to affect UCPH-101 activity are circled.
Figure 9.
Figure 9.
Functional properties of UCPH-101 at GLAST mutants containing mutations of the Gly120, Ala123, Tyr127, Met251, Phe255, Phe389, and Val393 residues. Concentration–inhibition curves for UCPH-101 at WT GLAST and the GLAST mutants stably expressed in polyclonal HEK293 cells in the [3H]-d-Asp uptake assay (n = 3–5).
Figure 10.
Figure 10.
Summary of the effects of mutations of residues in the TM3 (A), TM4c (B), and TM7a (C) α-helices on UCPH-101-mediated inhibition of GLAST function. Right, IC50mutant/IC50WT ratios for Glu, TBOA, and UCPH-101 at the GLAST mutants. #IC50mutant/IC50WT ratio: >200-fold. Left, The maximal inhibition degrees exhibited by UCPH-101 at WT and mutant GLAST mutants (in percentages of the maximal inhibition exerted by Glu at the respective transporters) (n = 3–5). The cutoff points for “Complete Inhibition” (>90% inhibition) and “No Inhibition” (<20% inhibition) defined in Table 2 are given as “CI” and “NI,” respectively. n.d., Not determinable.
Figure 11.
Figure 11.
Homology model of the GLAST monomer. A, The trimeric GLAST complex viewed parallel to the membrane (left) and from the extracellular side of the membrane (right) with the three monomers given in pink, gold, and silver. In the pink monomer, the TM3, TM4c, and TM7a α-helices are highlighted in red, and the seven residues observed to be important for UCPH-101 activity in this study are given as stick representations in green. The localization of the substrate binding site in the pink monomer is indicated by the presence of l-aspartate (in purple, highlighted with a purple circle). B, The chimera N354 monomer. As in Figure 7B, the N354 domains composed of GLAST and GLT-1 regions are given in green and red, respectively. C, The residues in the GLAST monomer subjected to mutagenesis (the specific mutants are given in Table 2). Residues where none of the introduced substitutions affected UCPH-101 activity are given in yellow, whereas the seven residues where selected mutations impaired UCPH-101 potency and/or efficacy are given as stick representations in green. D, The seven residues demonstrated to be important for UCPH-101 activity at GLAST. Left, Detail of the homology model of the GLAST monomer. Spatial orientations of TM3, TM4c, and TM7a and the seven residues. Right, The distances between the seven residues (Cα to Cα distances, in Å).
Figure 12.
Figure 12.
The GLAST inhibition exerted by UCPH-101 is an intramolecular event. A, The possible compositions of trimeric complexes formed in tsA201 cells co-expressing WT GLAST and GLAST-G120L. B, Total and cell surface expression levels of HA-GLAST, HA-GLAST-G120L, HA-GLAST-R497T, and HA-GLAST-G120L/R497T transiently expressed in tsA201 cells in the ELISA (n = 3). C, Concentration–inhibition curves for Glu, TBOA, and UCPH-101 at tsA201 cells transfected with WT GLAST cDNA, GLAST-G120L cDNA, or the two cDNAs in different ratios in the [3H]-d-Asp uptake assay (n = 3). D, Relationships between the transfection ratio of WT GLAST and GLAST-G120L cDNAs and the IC50 value (left) and the maximal inhibition (right) displayed by Glu, TBOA, and UCPH-101 in the [3H]-d-Asp uptake assay. IC50 values of UCPH-101 could not be determined in cells transfected with GLAST-G120L cDNA or cotransfected with WT GLAST and GLAST-G120L in a 1:8 cDNA ratio.
Figure 13.
Figure 13.
The GLAST inhibition exerted by UCPH-101 is an intramolecular event. A, The potential GLAST trimer combinations formed in cell populations transfected with four different pairwise combinations of WT GLAST, GLAST-G120L, GLAST-R479T, and GLAST-G120L/R479T cDNAs. B, Concentration-inhibition curves for Glu, TBOA, and UCPH-101 at tsA201 cells transfected with different combinations of WT GLAST, GLAST-G120L, GLAST-R479T, and GLAST-G120L/R479T cDNAs (1:1 transfection ratios) in the [3H]-d-Asp uptake assay (n = 4).

Similar articles

Cited by

References

    1. Bendahan A, Armon A, Madani N, Kavanaugh MP, Kanner BI. Arginine 447 plays a pivotal role in substrate interactions in a neuronal glutamate transporter. J Biol Chem. 2000;275:37436–37442. - PubMed
    1. Boudker O, Verdon G. Structural perspectives on secondary active transporters. Trends Pharmacol Sci. 2010;31:418–426. - PMC - PubMed
    1. Boudker O, Ryan RM, Yernool D, Shimamoto K, Gouaux E. Coupling substrate and ion binding to extracellular gate of a sodium-dependent aspartate transporter. Nature. 2007;445:387–393. - PubMed
    1. Bunch L, Erichsen MN, Jensen AA. Excitatory amino acid transporters as potential drug targets. Expert Opin Ther Targets. 2009;13:719–731. - PubMed
    1. Conradt M, Stoffel W. Functional analysis of the high affinity, Na+-dependent glutamate transporter GLAST-1 by site-directed mutagenesis. J Biol Chem. 1995;270:25207–25212. - PubMed

Publication types

MeSH terms

Substances