. 2013 Jan 16;33(3):1116-29.
doi: 10.1523/JNEUROSCI.0092-12.2013.

Cortical control of affective networks

Affiliations

Cortical control of affective networks

Sunil Kumar et al. J Neurosci. .

Abstract

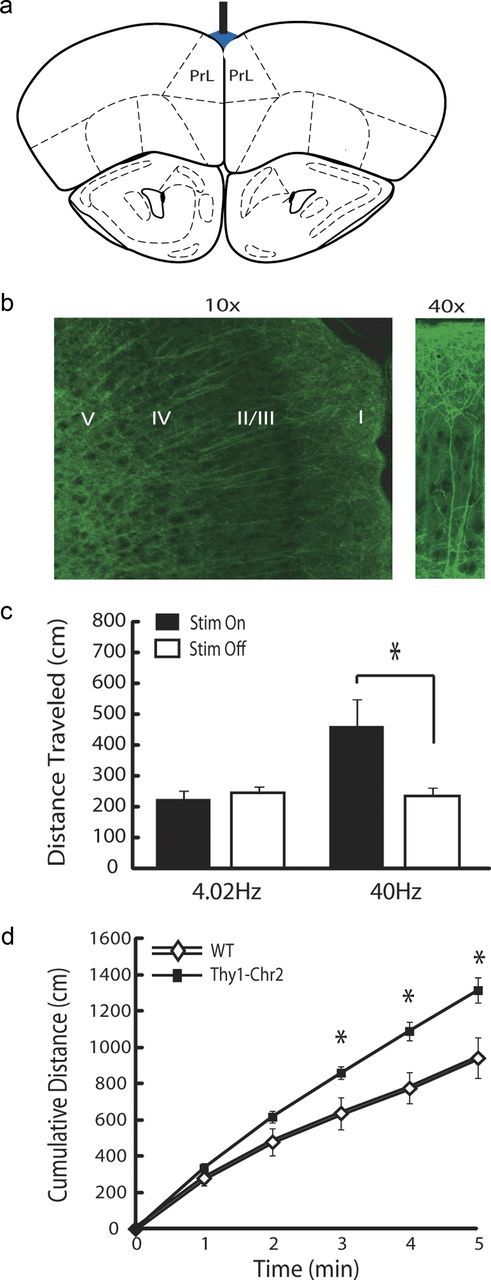
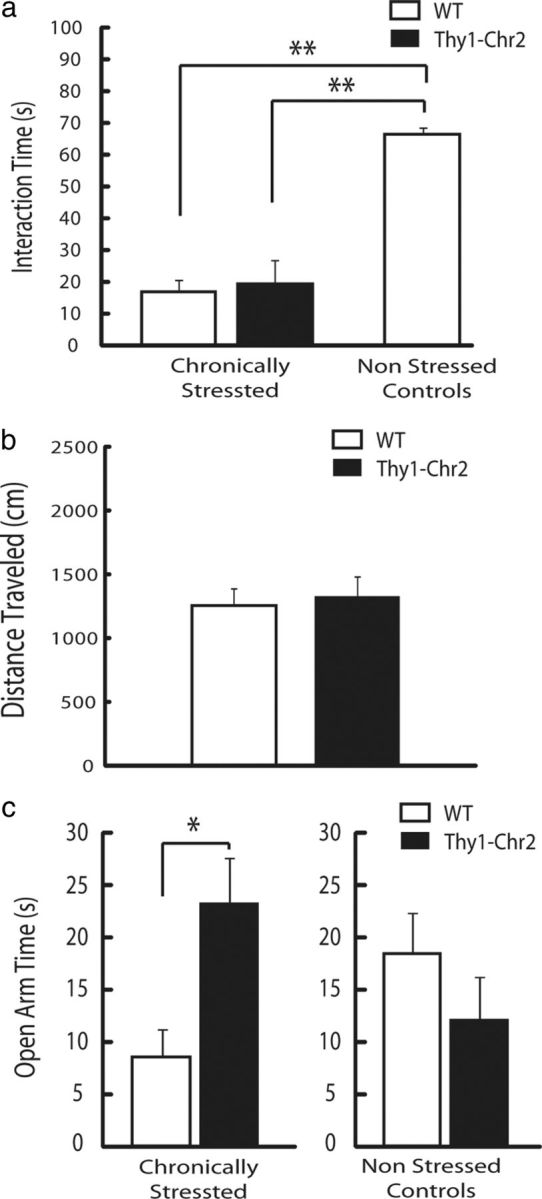
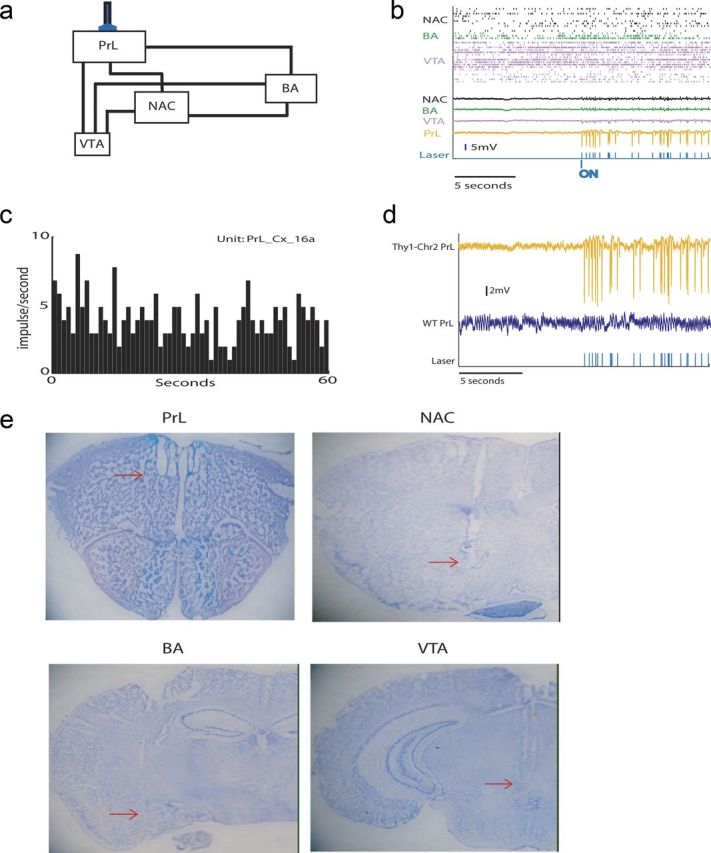
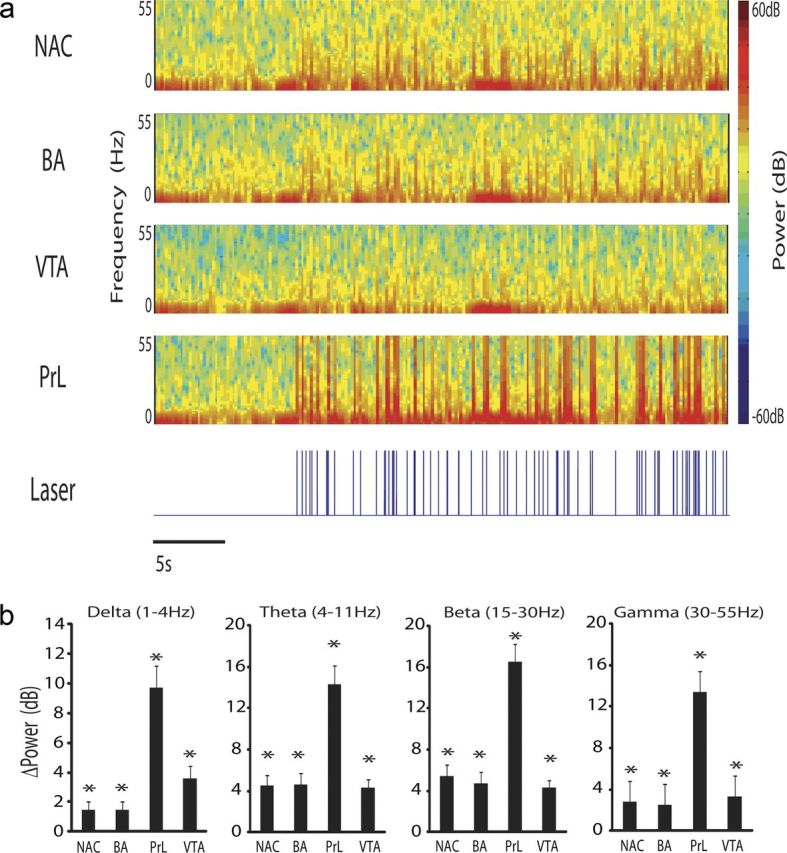
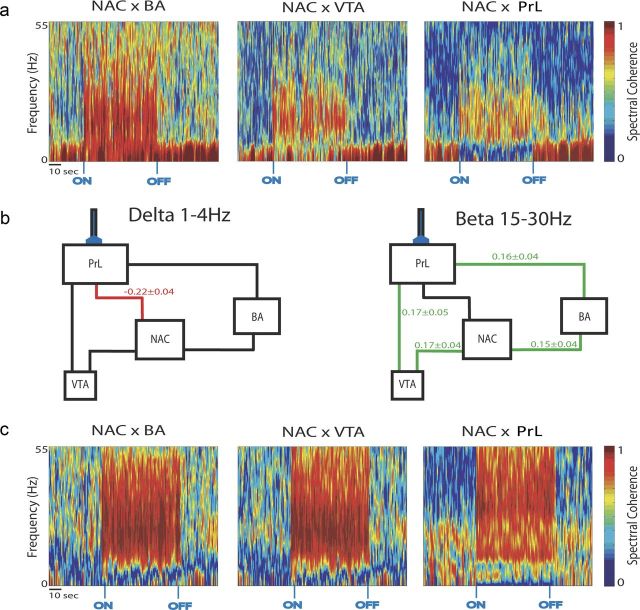
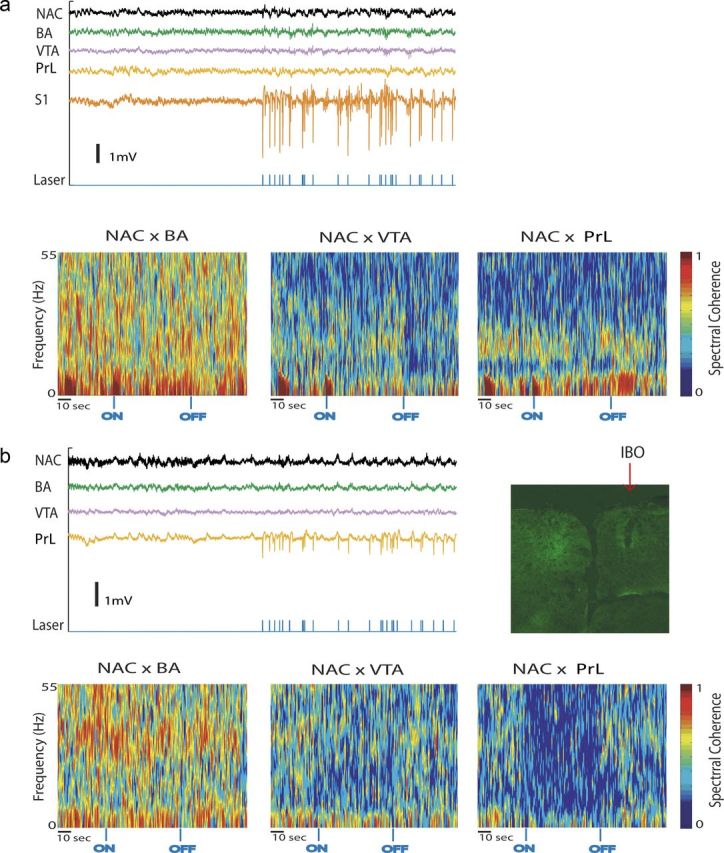
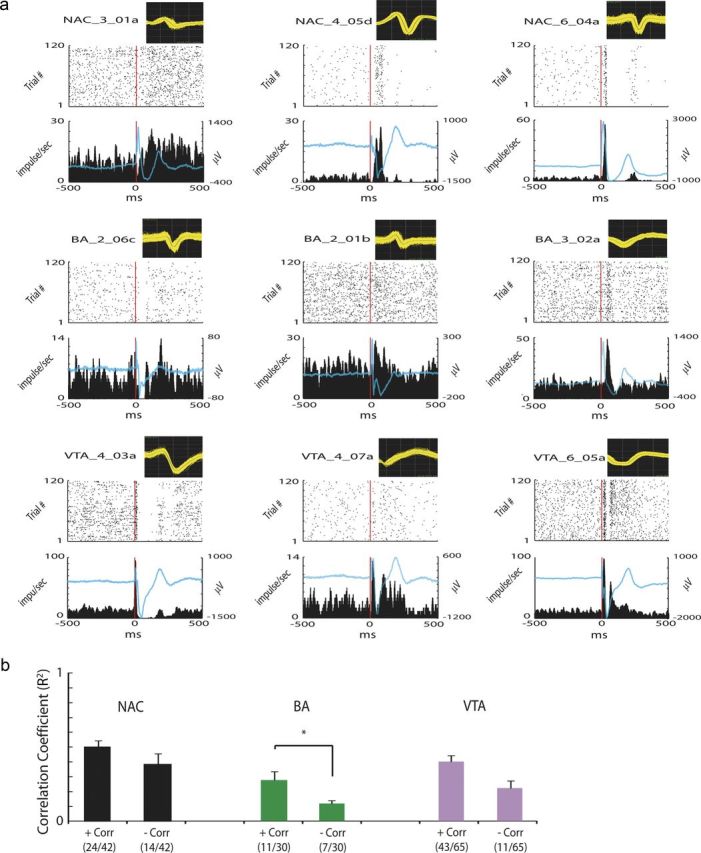
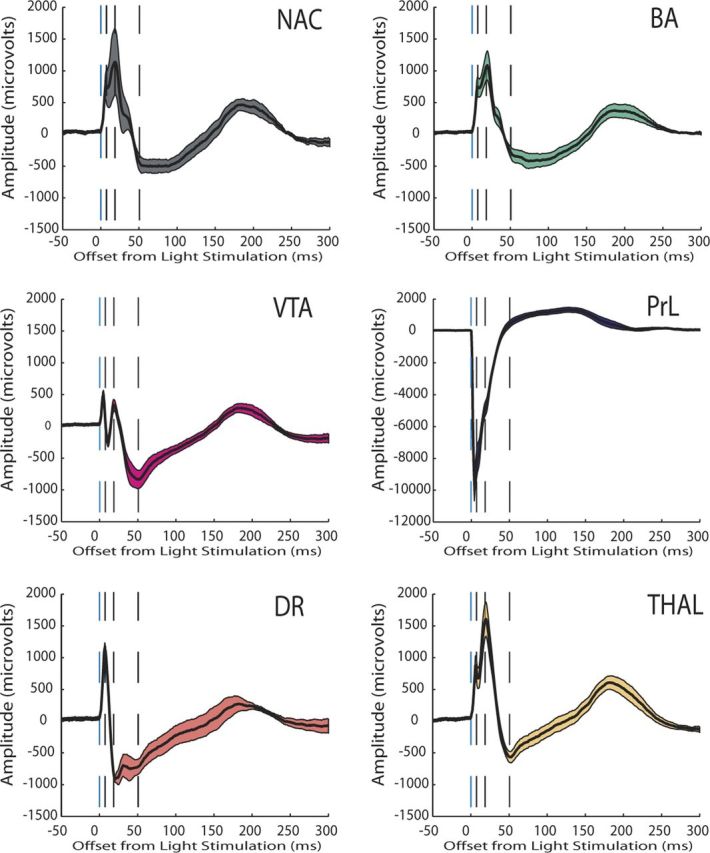
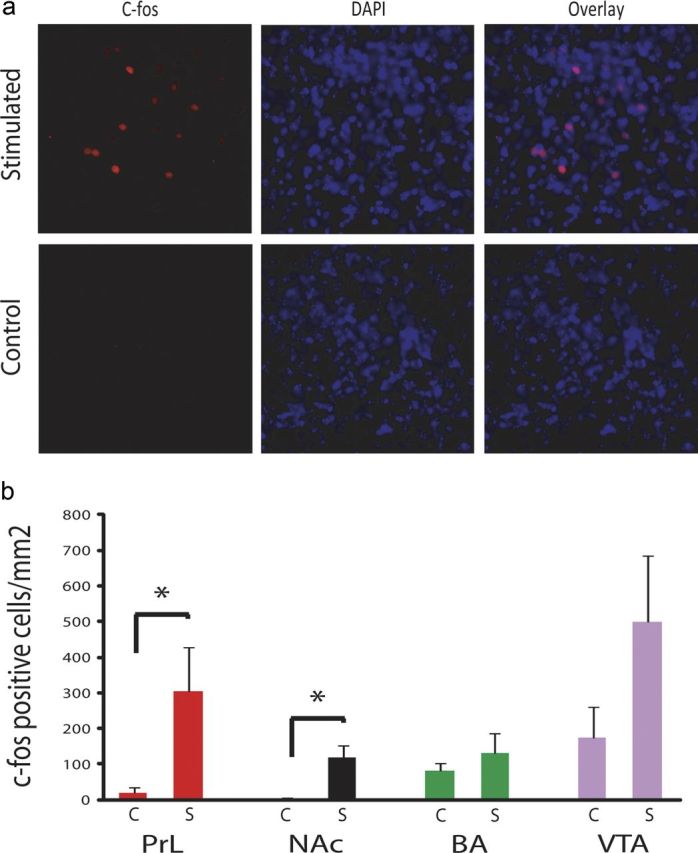
Transcranial magnetic stimulation and deep brain stimulation have emerged as therapeutic modalities for treatment refractory depression; however, little remains known regarding the circuitry that mediates the therapeutic effect of these approaches. Here we show that direct optogenetic stimulation of prefrontal cortex (PFC) descending projection neurons in mice engineered to express Chr2 in layer V pyramidal neurons (Thy1-Chr2 mice) models an antidepressant-like effect in mice subjected to a forced-swim test. Furthermore, we show that this PFC stimulation induces a long-lasting suppression of anxiety-like behavior (but not conditioned social avoidance) in socially stressed Thy1-Chr2 mice: an effect that is observed >10 d after the last stimulation. Finally, we use optogenetic stimulation and multicircuit recording techniques concurrently in Thy1-Chr2 mice to demonstrate that activation of cortical projection neurons entrains neural oscillatory activity and drives synchrony across limbic brain areas that regulate affect. Importantly, these neural oscillatory changes directly correlate with the temporally precise activation and suppression of limbic unit activity. Together, our findings show that the direct activation of cortical projection systems is sufficient to modulate activity across networks underlying affective regulation. They also suggest that optogenetic stimulation of cortical projection systems may serve as a viable therapeutic strategy for treating affective disorders.


Figures

Figure 1.
Figure 1.
High-frequency PFC stimulation induces hyperactivity. a, Cortical stimulation targeting approach used for behavioral and neurophysiological experiments. b, Anterior PrL expression pattern of Chr2 in Thy1–Chr2 (line 18) mice. Chr2 labeling was observed in the cell bodies of layer V neurons (left) and their apical dendrites. High-resolution image of an apical dendrite of a layer V pyramidal neuron (right). c, Thy1–Chr2 mice were placed in an open field, and locomotor profiles were recorded during PrL stimulation with a prerecorded PrL neuron pattern (4.02 Hz) or at 40 Hz (5 ms pulse width). The distance traveled during the 1 min stimulation intervals was compared with the distance traveled during the 1 min intervals after stimulation using a Student's t test. PrL stimulation at 40 Hz induced hyperactivity, whereas stimulation using the PrL neuron pattern did not. *p < 0.025; n = 6 Thy1–Chr2 mice. d, Open-field locomotor profiles in WT and Thy1–Chr2 mice during 5 min PrL stimulation at 4.02 Hz. *p < 0.05 using Student's t test; n = 6 mice per genotype.
Figure 2.
Figure 2.
Antidepressant-like effect of chronic cortical stimulation in chronically stressed mice. a, Thy1–Chr2 mice exposed to chronic subordination stress displayed similar interaction times as their WT littermates during the social interaction test after chronic cortical stimulation. Chronically stressed mice exhibited significantly lower social interaction scores than nonstressed nonstimulated single-housed control mice. **p < 0.001 using Student's t test; n = 6–7 per genotype. b, Thy1–Chr2 mice exposed to chronic subordination stress exhibited similar open-field exploration profiles as their chronically stressed WT littermates after chronic cortical stimulation. c, Chronically stressed and chronically stimulated Thy1–Chr2 mice spent more time in the open arm of an EPM compared with their WT littermate controls. *p < 0.05 using Student's t test; n = 7 per genotype (left). No significant differences in open arm time were observed between single-housed (nonstressed) Thy1–Chr2 and WT control mice after chronic stimulation. P < 0.05 using Student's t test; n = 6–7 per genotype.
Figure 3.
Figure 3.
Neurophysiological recordings during optogenetic stimulation of cortical projection neurons. a, Diagram of limbic circuit that contributes to depression. b, Ten second trace of neurophysiological activity recorded at the onset of cortical stimulation juxtaposed with a 10 s trace of neurophysiological activity recorded at the offset of cortical stimulation. c, Sixty second rate histogram of exogenous PrL neuron used to drive cortical stimulation in this study. d, PrL LFP trace recorded in Thy1–Chr2 and WT mouse during cortical stimulation. Note that laser pulses do not generate the large-amplitude traces in WT mice during cortical stimulation. e, Histological images showing representative electrode lesion tracks.
Figure 4.
Figure 4.
Optogenetic stimulation of cortical projection neurons increases oscillatory power across limbic brain areas. a, LFP spectral trace during optogenetic stimulation of cortical projection neurons. b, Change in oscillatory power during optogenetic cortical stimulation. *p < 0.05 using Student's t test, followed by an FDR correction for multiple comparisons; n = 8 for all brain areas.
Figure 5.
Figure 5.
Cortical stimulation modulates spectral synchrony across distributed limbic circuits. a, Spectral coherence plots generated for LFP pairs recorded across limbic brain areas during PrL stimulation. b, Circuits that demonstrated significant changes in synchrony during cortical stimulation are shown in green (increases) or red (decreases) with their respective percentage coherence change from baseline. p < 0.05 using Student's t test, followed by an FDR correction for multiple comparisons; n = 8 for all brain area pairs. c, Spectral coherence plots generated for LFP pairs recorded across limbic brain areas in a mouse during fixed frequency PrL stimulation at 4 Hz (note that 4 Hz stimulation tended to enhance limbic beta synchrony).
Figure 6.
Figure 6.
Stimulation of cortical projection neurons is necessary to enhance limbic synchrony. a, LFP activity and limbic synchrony during S1 stimulation in a Thy1–Chr2 mouse (n = 1). b, Example LFP activity and limbic synchrony during PrL stimulation in a Thy1–Chr2 mouse pretreated with ibotenic acid (n = 2). Example histological image of PrL in Thy1–Chr2 mouse treated unilaterally with ibotenic acid. Note the decreased eYPF expression in the hemisphere treated with ibotenic acid (IBO).
Figure 7.
Figure 7.
Example of neuron isolated from NAc. From left to right, Depiction of the extracellularly recorded waveform of the unit (x-axis, 1600 μs; y-axis, 185 μV), projection of the clusters corresponding to the unit and the noise based on analysis of the first two principal components of the waveforms recorded (x-axis, PC1; y-axis, PC2), and interspike interval histogram.
Figure 8.
Figure 8.
Cortical stimulation synchronizes unit activity across limbic circuits. PrL was stimulated at 0.1 Hz for 20 min for a total of 120 trials. a, Each plot depicts a spike waveform (800 μs width, top), the perievent spike raster plot (middle), and the perievent firing rate time histogram (bottom) for the same neuron during cortical stimulation. Time 0 (red line) is the time of cortical stimulation during each trial. A total of 78.6% of NAc neurons (33 of 42), 53.3% of BA neurons (16 of 30), and 80.0% of VTA neurons (52 of 65) were significantly modulated by cortical stimulation. Blue lines represent LTA functions calculated from LFPs recorded simultaneously from the same microwire as each isolated unit. b, A total of 90.5% of NAc neurons (38 of 42), 60.0% of BA neurons (18 of 30), and 83.1% of VTA neurons (54 of 65) displayed activities that positively correlated (+Corr; Type A; see NAC_6_04a for example) or negatively correlated (−Corr; Type B; see NAC_4_05d for example) with locally recorded LTAs after single-pulse cortical stimulation. *p < 0.05 using Mann–Whitney U test.
Figure 9.
Figure 9.
Evoked potential recorded from limbic brain areas during low-frequency cortical stimulation (0.1 Hz). Evoked potentials are shown as the mean ± SEM for all of the LFP channels recorded across each structure within a single mouse during a single trial. This mouse had recording electrodes implanted in dorsal raphe (DR) (AP, −4.5 mm; ML, 0.3 mm; and DV, −2.25 mm from bregma) and medial dorsal thalamus (THAL) (AP, −1.6 mm; ML, 0.3 mm; and DV, −2.9 mm from bregma) in addition to the other brain areas described in this study. Note that several brain areas that were most distal to the stimulation site (i.e., DR and VTA) exhibited maximum/minimum potential peaks that occurred before the proximal brain areas (i.e., NAc).
Figure 10.
Figure 10.
Stimulation-induced c-fos expression. a, c-fos immunostaining (red) in the NAc; cell nuclei are identified by DAPI staining (blue). Images are representative of three images taken from each of three separate brains at 40× magnification. b, Quantification of c-fos-positive cells across PrL, NAc, BA, and VTA in Thy1–Chr2 mice after 5 min of PrL stimulation and in nonstimulated Thy1–Chr2 mice. *p < 0.05 using t test; n = 6 mice per condition.

Similar articles

Cited by

References

    1. Adhikari A, Topiwala MA, Gordon JA. Synchronized activity between the ventral hippocampus and the medial prefrontal cortex during anxiety. Neuron. 2010;65:257–269. - PMC - PubMed
    1. Akil H, Brenner S, Kandel E, Kendler KS, King MC, Scolnick E, Watson JD, Zoghbi HY. Medicine. The future of psychiatric research: genomes and neural circuits. Science. 2010;327:1580–1581. - PMC - PubMed
    1. American Psychiatric Association. Diagnostic and statistical manual of mental disorders DSM-IV-TR. Washington, DC: American Psychiatric Association; 2000.
    1. Anikeeva P, Andalman AS, Witten I, Warden M, Goshen I, Grosenick L, Gunaydin LA, Frank LM, Deisseroth K. Optetrode: a multichannel readout for optogenetic control in freely moving mice. Nat Neurosci. 2012;15:163–170. - PMC - PubMed
    1. Arenkiel BR, Peca J, Davison IG, Feliciano C, Deisseroth K, Augustine GJ, Ehlers MD, Feng G. In vivo light-induced activation of neural circuitry in transgenic mice expressing channelrhodopsin-2. Neuron. 2007;54:205–218. - PMC - PubMed

Publication types