. 2013 Jan 16;33(3):1130-42.
doi: 10.1523/JNEUROSCI.3082-12.2013.

Different roles of BDNF in nucleus accumbens core versus shell during the incubation of cue-induced cocaine craving and its long-term maintenance

Affiliations

Different roles of BDNF in nucleus accumbens core versus shell during the incubation of cue-induced cocaine craving and its long-term maintenance

Xuan Li et al. J Neurosci. .

Abstract

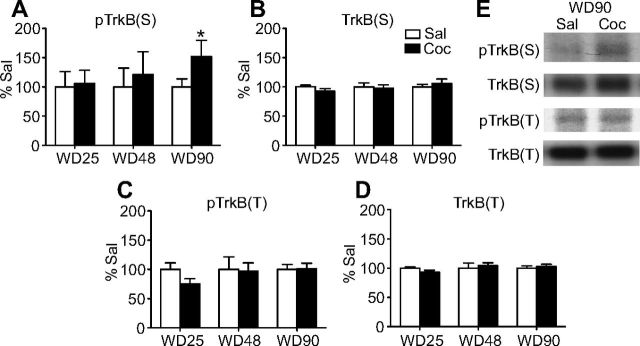
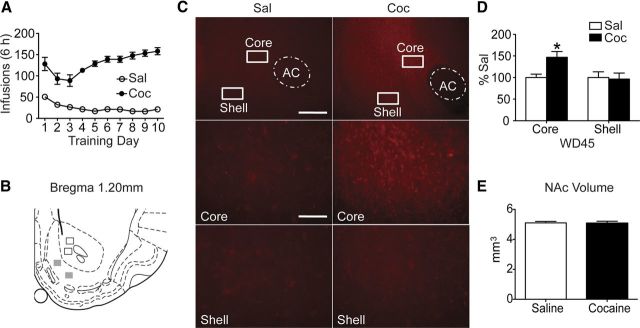
Brain-derived neurotrophic factor (BDNF) contributes to diverse types of plasticity, including cocaine addiction. We investigated the role of BDNF in the rat nucleus accumbens (NAc) in the incubation of cocaine craving over 3 months of withdrawal from extended access cocaine self-administration. First, we confirmed by immunoblotting that BDNF levels are elevated after this cocaine regimen on withdrawal day 45 (WD45) and showed that BDNF mRNA levels are not altered. Next, we explored the time course of elevated BDNF expression using immunohistochemistry. Elevation of BDNF in the NAc core was detected on WD45 and further increased on WD90, whereas elevation in shell was not detected until WD90. Surface expression of activated tropomyosin receptor kinase B (TrkB) was also enhanced on WD90. Next, we used viral vectors to attenuate BDNF-TrkB signaling. Virus injection into the NAc core enhanced cue-induced cocaine seeking on WD1 compared with controls, whereas no effect was observed on WD30 or WD90. Attenuating BDNF-TrkB signaling in shell did not affect cocaine seeking on WD1 or WD45 but significantly decreased cocaine seeking on WD90. These results suggest that basal levels of BDNF transmission in the NAc core exert a suppressive effect on cocaine seeking in early withdrawal (WD1), whereas the late elevation of BDNF protein in NAc shell contributes to incubation in late withdrawal (WD90). Finally, BDNF protein levels in the NAc were significantly increased after ampakine treatment, supporting the novel hypothesis that the gradual increase of BDNF levels in NAc accompanying incubation could be caused by increased AMPAR transmission during withdrawal.


Figures

Figure 1.
Figure 1.
BDNF protein levels are increased in the NAc 45 d after discontinuing cocaine self-administration training. A, Western blot analysis indicated a significant increase in BDNF protein levels (*p < 0.05, t(13) = 3.015, t test) in whole NAc of rats that self-administered cocaine (6 h/d for 10 d; n = 8) compared with rats that self-administered saline (n = 7). B, Representative blots comparing cocaine and saline groups. Data (mean ± SEM) are expressed as percentage of mean values in the saline group.
Figure 2.
Figure 2.
Cocaine self-administration leads to a significant increase in surface expression of phosphorylated TrkB (pTrkB; Tyr706/707) in whole NAc on WD90. A, Whole NAc was obtained on WD25, WD48, or WD90 after saline or cocaine self-administration and biotinylated. Surface-expressed pTrkB [pTrkB(S)] was significantly increased in the NAc of the cocaine group on WD90 (saline, n = 13; cocaine, n = 8; *p < 0.05, t(19) = 1.839, t test, one tail), whereas there were no differences between cocaine and saline groups on either WD25 (saline, n = 10; cocaine, n = 9) or WD48 (saline, n = 9; cocaine, n = 10). BD, Surface TrkB [TrkB(S)], total pTrkB [pTrkB(T)], and total TrkB [TrkB(T)] in the cocaine group were similar to their respective saline controls at each withdrawal time. E, Representative blots from WD90 groups are shown (TrkB: 140 kDa). Data (mean ± SEM) are expressed as percentage of mean values in the saline group from the same WD.
Figure 3.
Figure 3.
BDNF immunoreactivity is selectively increased in the NAc core on WD45 after cocaine self-administration training. A, Infusions during 10 d of saline or cocaine self-administration training (saline, n = 13; cocaine, n = 11). B, Schematic diagram illustrating regions sampled to measure BDNF immunoreactivity in NAc core (open boxes) and shell (closed gray boxes). C, Representative images of BDNF staining in the NAc on WD45 after saline (left panels) or cocaine self-administration (right panels). Top, Low-magnification images. Scale bar, 1000 μm. Middle and bottom, Higher-magnification images in core and shell, respectively. Scale bar, 100 μm. D, A significant increase in BDNF staining was observed in the NAc core (*p < 0.05, t(22) = 3.117, t test), but not shell, of the cocaine group on WD45 compared with the saline group. Data (mean ± SEM) are expressed as percentage of mean values in the saline group. E, The volume of the NAc (mm3) did not differ between saline and cocaine groups on WD45.
Figure 4.
Figure 4.
BDNF immunoreactivity is significantly elevated in both the NAc core and shell on WD90 after cocaine self-administration training. A, Infusions during 10 d of saline or cocaine self-administration training (saline, n = 12; cocaine, n = 8). B, BDNF staining was significantly increased in the NAc core (***p < 0.0005, t(15) = 5.070, t test; saline, n = 11; cocaine, n = 6) and shell (*p < 0.05, t(18) = 2.537, t test; saline, n = 12; cocaine, n = 8) in the cocaine group on WD90 compared with saline controls. Data (mean ± SEM) are expressed as percentage of mean values in the saline group. C, Representative images of BDNF staining in the NAc on WD90 after saline (left) or cocaine self-administration (right). Top, Low-magnification images. Scale bar, 1000 μm. Middle and bottom, Higher-magnification images in core and shell, respectively. Scale bar, 100 μm.
Figure 5.
Figure 5.
Neither total BDNF mRNA nor BDNF exon IV levels are increased in the NAc 45 d after discontinuing cocaine self-administration training. A, Training data are expressed as infusions (mean ± SEM) on each 6 h training day for rats that self-administered saline (n = 9) or cocaine (n = 8). B, C, Real-time PCR analysis revealed no differences in total BDNF mRNA expression or BDNF exon IV levels in either NAc core or shell of the cocaine group compared with the saline group on WD45. Data (mean ± SEM) are expressed as percentage of mean values in the saline group.
Figure 6.
Figure 6.
Attenuating BDNF-TrkB signaling with LV-TrkBsiRNA in the NAc core led to enhanced cue-induced cocaine seeking on WD1. A, Experimental timeline. B, Cocaine self-administration training was similar in both cohorts, and no differences were found between the LV-GFP and LV-TrkBsiRNA groups. C, Cue-induced cocaine seeking was significantly enhanced on WD1 in rats injected with LV-TrkBsiRNA into the NAc core before cocaine self-administration training compared with rats injected with LV-GFP (*p < 0.05, t(11) = 2.576, t test; LV-GFP, n = 7; LV-TrkBsiRNA, n = 6). By WD30, no difference was apparent between the LV-GFP and LV-TrkBsiRNA groups (LV-GFP, n = 6; LV-TrkBsiRNA, n = 8). Whereas the LV-GFP groups exhibited incubation (significantly increased active hole nose-pokes on WD30 compared with WD1) (*p < 0.05, t(11) = 6.207, t test), no significant difference was found between LV-TrkBsiRNA groups tested on WD1 versus WD30. Results are expressed as nose-pokes (mean ± SEM) in the previously active hole during a 60 min cocaine-seeking test in which cocaine was not available and each nose-poke into the active hole resulted in the delivery of the light cue previously paired with cocaine infusions.
Figure 7.
Figure 7.
Attenuating BDNF-TrkB signaling with AAV-TrkB.T1 in the NAc core led to enhanced cue-induced cocaine seeking on WD1. A, Experimental timeline. B, Cocaine self-administration training was similar between AAV-GFP (n = 7) and AAV-TrkB.T1 (n = 6) groups. C, Similarly to results obtained with LV-TrkBsiRNA (Fig. 6), we observed significantly enhanced cue-induced cocaine seeking on WD1 in the AAV-TrkB.T1 group compared with the AAV-GFP group (*p < 0.05, t(11) = 2.357, t test). No difference was found between the groups on WD90, but both groups showed incubation compared with their respective WD1 (AAV-GFP: *p < 0.05, t(6) = 7.704; AAV-TrkB.T1: #p < 0.05, t(5) = 2.326; one tailed, paired t tests). Results are expressed as nose-pokes (mean ± SEM) in the previously active hole during a 30 min cocaine-seeking test conducted as described in the legend to Figure 6. D, Representative image showing FLAG immunostaining in the NAc core after the final seeking test on WD90. Scale bar, 1000 μm.
Figure 8.
Figure 8.
Attenuating BDNF-TrkB signaling with LV-TrkBsiRNA or LV-TrkB.T1 in the NAc shell had no effect on cue-induced cocaine seeking on either WD1 or WD45. A, Experimental timeline. B, Cocaine self-administration training was similar in both cohorts, and no differences were found between LV-GFP, LV-TrkBsiRNA, and LV-TrkB.T1 groups. C, No effects on cue-induced cocaine seeking were observed on either WD1 or WD45 in rats injected with LV-GFP, LV-TrkBsiRNA, or LV-TrkB.T1 in the NAc shell before cocaine self-administration training, although all three WD45 groups (LV-GFP: n = 9; LV-TrkBsiRNA: n = 9; LV-TrkB.T1: n = 6) showed incubation compared with respective WD1 groups (LV-GFP: n = 9; LV-TrkBsiRNA: n = 9; LV-TrkB.T1: n = 7). Comparison of WD1 and WD45 groups: LV-GFP, *p < 0.05, t(16) = 3.758; LV-TrkBsiRNA, #p < 0.05, t(16) = 4.617; LV-TrkB.T1, $p < 0.05, t(11) = 3.716; t tests. Results are expressed as nose-pokes (mean ± SEM) in the previously active hole during a 30 min cocaine-seeking test conducted as described in the legend to Figure 6.
Figure 9.
Figure 9.
Attenuating BDNF-TrkB signaling with AAV-TrkB.T1 in the NAc shell led to significantly decreased cue-induced cocaine seeking on WD90. A, Experimental timeline. B, Cocaine self-administration training was similar for AAV-GFP (n = 7) and AAV-TrkB.T1 (n = 6) groups. C, On WD1, there was no difference in cue-induced cocaine seeking between AAV-GFP and AAV-TrkB.T1 groups. On WD90, although both groups showed incubation compared with their respective WD1 (AAV-GFP: *p < 0.05, t(6) = 7.017; AAV-TrkB.T1: #p < 0.05, t(5) = 4.437; paired t tests), the response of the AAV-TrkB.T1 group was significantly decreased compared with the AAV-GFP group ($p < 0.05, t(11) = 2.333, t test). D, Representative image showing FLAG immunostaining in NAc shell after the behavioral test on WD90. Scale bar, 1000 μm.
Figure 10.
Figure 10.
Long-term elevation of BDNF levels with LV-BDNF-GFP had no effect on GluA1 or GluA2 surface expression in either the NAc core or shell. A, Representative image of BDNF staining 3 weeks after injection of LV-BDNF-GFP into the NAc core. Intense staining for BDNF (red) was observed in infected neurons, identified based on GFP expression (green). Note that the GFP signal is weak because it was not amplified by immunostaining. These results demonstrate that LV-BDNF-GFP was effective in vivo. Scale bar, 100 μm. B, Forty-seven days after injection of LV-GFP (n = 9) or LV-BDNF-GFP (n = 4) into the NAc core, BDNF levels in the core of the LV-BDNF-GFP group were significantly elevated compared with LV-GFP controls (*p < 0.05, t(11) = 2.242, t test), but this chronic elevation of BDNF levels failed to affect GluA1 and GluA2 surface expression. C, Similarly, whereas BDNF levels in the shell of the LV-BDNF-GFP group (n = 8) showed a significant increase compared with the LV-GFP group (n = 11; *p < 0.05, t(17) = 2.750, t test), no changes on GluA1 and GluA2 surface expression were observed. Data (mean ± SEM) are expressed as percentage of mean values in the LV-GFP group.
Figure 11.
Figure 11.
Treatment with the ampakine CX929 in drug naive rats significantly increased BDNF protein levels in whole NAc. As a positive control, we first confirmed that BDNF protein levels in rat hippocampus were significantly elevated in the ampakine treatment group (n = 8) compared with the vehicle group (n = 8) (*p = 0.05, t(7) = 2.506, paired t test), consistent with previous studies (Rex et al., 2006). Analysis of whole NAc from the same animals revealed elevated BDNF protein levels (*p < 0.05, t(7) = 2.328, paired t test) but no change in BDNF total mRNA levels. Data (mean ± SEM) are expressed as percentage of mean values in the vehicle group.

Similar articles

Cited by

References

    1. Altar CA, DiStefano PS. Neurotrophin trafficking by anterograde transport. Trends Neurosci. 1998;21:433–437. - PubMed
    1. Altar CA, Cai N, Bliven T, Juhasz M, Conner JM, Acheson AL, Lindsay RM, Wiegand SJ. Anterograde transport of brain-derived neurotrophic factor and its role in the brain. Nature. 1997;389:856–860. - PubMed
    1. Bahi A, Boyer F, Chandrasekar V, Dreyer JL. Role of accumbens BDNF and TrkB in cocaine-induced psychomotor sensitization, conditioned place preference and reinstatement in rats. Psychopharmacology. 2008;199:169–182. - PubMed
    1. Berglind WJ, See RE, Fuchs RA, Ghee SM, Whitfield TW, Jr, Miller SW, McGinty JF. A BDNF infusion into the medial prefrontal cortex suppresses cocaine seeking in rats. Eur J Neurosci. 2007;26:757–766. - PubMed
    1. Berglind WJ, Whitfield TW, Jr, LaLumiere RT, Kalivas PW, McGinty JF. A single intra-PFC infusion of BDNF prevents cocaine-induced alterations in extracellular glutamate within the nucleus accumbens. J Neurosci. 2009;29:3715–3719. - PMC - PubMed

Publication types

LinkOut - more resources