Functional organization of information flow in the corticospinal pathway
- PMID: 23325255
- PMCID: PMC6704852
- DOI: 10.1523/JNEUROSCI.2403-12.2013
Functional organization of information flow in the corticospinal pathway
Abstract
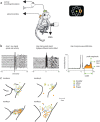
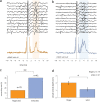
Transmission of information in the corticospinal (CS) route constitutes the fundamental infrastructure for voluntary actions. The anatomy of this pathway has been studied extensively, but there is little direct evidence regarding its functional organization. Here we explored the areal specificity of CS connections by studying two related questions: the functional significance of the parallel, motor, and premotor CS pathways; and the way in which finger-related motor commands are handled by this pathway. We addressed these questions by recording from primary motor (M1) and premotor cortical sites in primates (Maccaca fascicularis) performing a motor task, while measuring the evoked intraspinal unit response to single pulse cortical stimulation. Stimulation in M1 evoked spinal neuronal responses more frequently than stimulation in premotor cortex. The number of muscles excited by M1 stimulation was higher than the number excited by premotor stimulation. Within subregions of M1 finger-related sites were sparsely connected with intermediate zone interneurons and tended to affect the ventrally located motoneurons directly. These results suggest that, despite the parallel anatomical organization, the flow of motor commands is predominantly relayed via M1 to downstream elements. The functional impact of premotor cortex is weak, possibly due to inhibitory systems that can shape the flow of information in the CS pathway. Finally, the difference in spinal processing of finger versus wrist-related motor commands points to a different motor control strategy of finger versus wrist movements.
Figures


Similar articles
-
Differences in the corticospinal projection from primary motor cortex and supplementary motor area to macaque upper limb motoneurons: an anatomical and electrophysiological study.Cereb Cortex. 2002 Mar;12(3):281-96. doi: 10.1093/cercor/12.3.281. Cereb Cortex. 2002. PMID: 11839602
-
Pronounced reduction of digit motor responses evoked from macaque ventral premotor cortex after reversible inactivation of the primary motor cortex hand area.J Neurosci. 2008 May 28;28(22):5772-83. doi: 10.1523/JNEUROSCI.0944-08.2008. J Neurosci. 2008. PMID: 18509039 Free PMC article.
-
Inducing homeostatic-like plasticity in human motor cortex through converging corticocortical inputs.J Neurophysiol. 2009 Dec;102(6):3180-90. doi: 10.1152/jn.91046.2008. Epub 2009 Sep 2. J Neurophysiol. 2009. PMID: 19726723
-
Investigating human motor control by transcranial magnetic stimulation.Exp Brain Res. 2003 Sep;152(1):1-16. doi: 10.1007/s00221-003-1537-y. Epub 2003 Jul 17. Exp Brain Res. 2003. PMID: 12879177 Review.
-
Motor areas in the frontal lobe of the primate.Physiol Behav. 2002 Dec;77(4-5):677-82. doi: 10.1016/s0031-9384(02)00929-0. Physiol Behav. 2002. PMID: 12527018 Review.
Cited by
-
Enhanced dorsal premotor-motor inhibition in cervical dystonia.Clin Neurophysiol. 2015 Jul;126(7):1387-91. doi: 10.1016/j.clinph.2014.10.140. Epub 2014 Oct 25. Clin Neurophysiol. 2015. PMID: 25468241 Free PMC article.
-
The engagement of the cerebellum and basal ganglia enhances expertise in a sensorimotor adaptation task.Imaging Neurosci (Camb). 2024 Aug 19;2:imag-2-00271. doi: 10.1162/imag_a_00271. eCollection 2024. Imaging Neurosci (Camb). 2024. PMID: 40800439 Free PMC article.
-
Corticospinal gating during action preparation and movement in the primate motor cortex.J Neurophysiol. 2018 Apr 1;119(4):1538-1555. doi: 10.1152/jn.00639.2017. Epub 2018 Jan 3. J Neurophysiol. 2018. PMID: 29357454 Free PMC article.
-
Terminal distribution of the corticospinal projection from the hand/arm region of the primary motor cortex to the cervical enlargement in rhesus monkey.J Comp Neurol. 2013 Dec 15;521(18):4205-35. doi: 10.1002/cne.23410. J Comp Neurol. 2013. PMID: 23840034 Free PMC article.
-
Spinal cord neural interfacing in common marmosets (Callithrix jacchus).J Neural Eng. 2020 Jan 14;17(1):016031. doi: 10.1088/1741-2552/ab4104. J Neural Eng. 2020. PMID: 31480029 Free PMC article.
References
-
- Asher I, Zinger N, Yanai Y, Israel Z, Prut Y. Population-based corticospinal interactions in macaques are correlated with visuomotor processing. Cereb Cortex. 2010;20:241–252. - PubMed
-
- Bennett KM, Lemon RN. Corticomotoneuronal contribution to the fractionation of muscle activity during precision grip in the monkey. J Neurophysiol. 1996;75:1826–1842. - PubMed
-
- Brosch M, Bauer R, Eckhorn R. Stimulus-dependent modulations of correlated high-frequency oscillations in cat visual cortex. Cereb Cortex. 1997;7:70–76. - PubMed
Publication types
MeSH terms
LinkOut - more resources
Full Text Sources
Other Literature Sources
