. 2013 Jan 16;33(3):1241-58.
doi: 10.1523/JNEUROSCI.3386-12.2013.

Ciliary neurotrophic factor receptor regulation of adult forebrain neurogenesis

Affiliations

Ciliary neurotrophic factor receptor regulation of adult forebrain neurogenesis

Nancy Lee et al. J Neurosci. .

Abstract

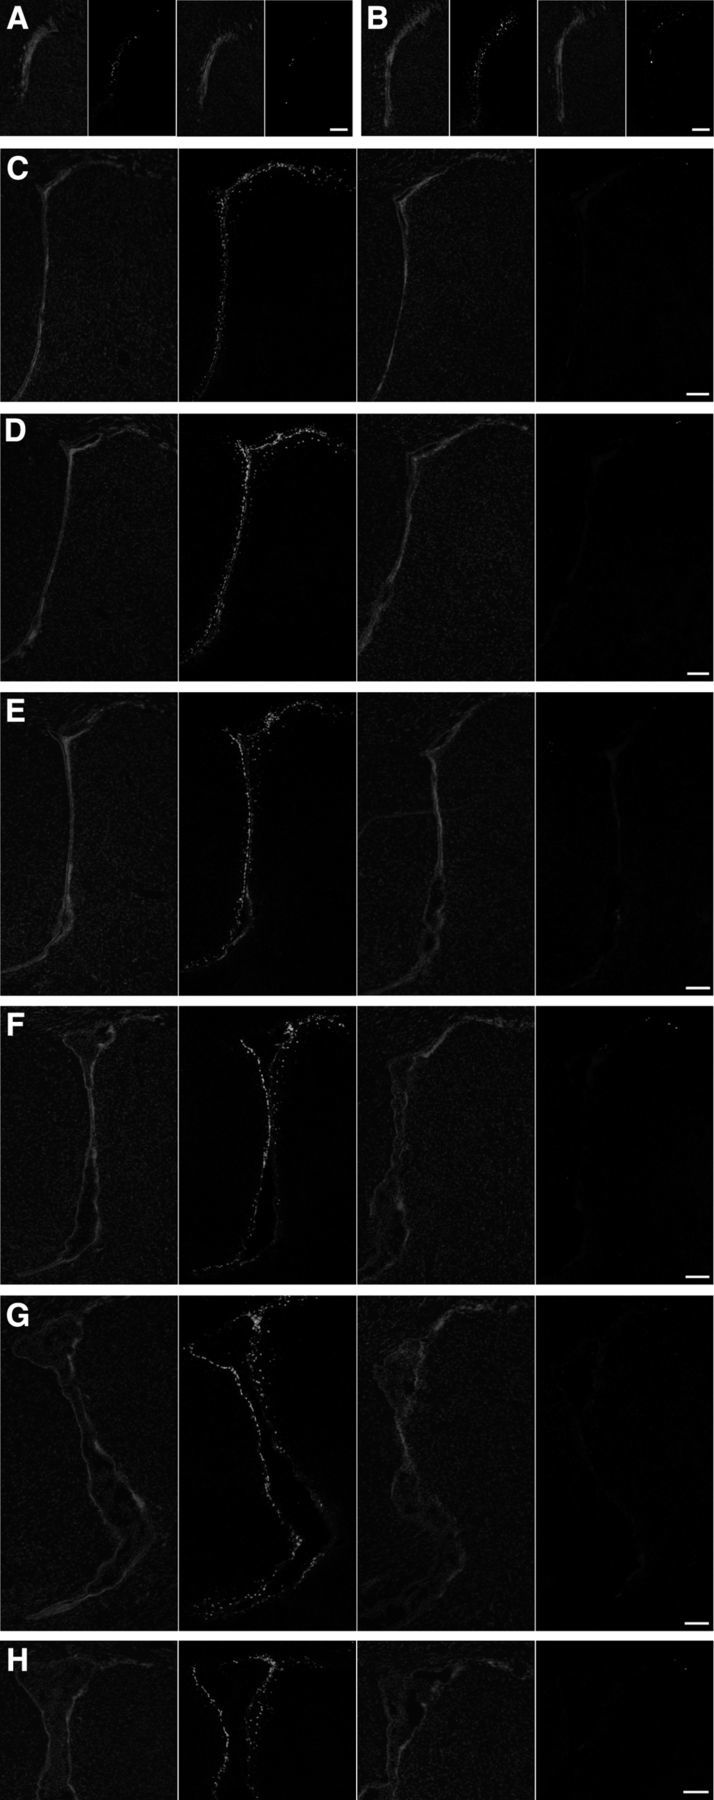
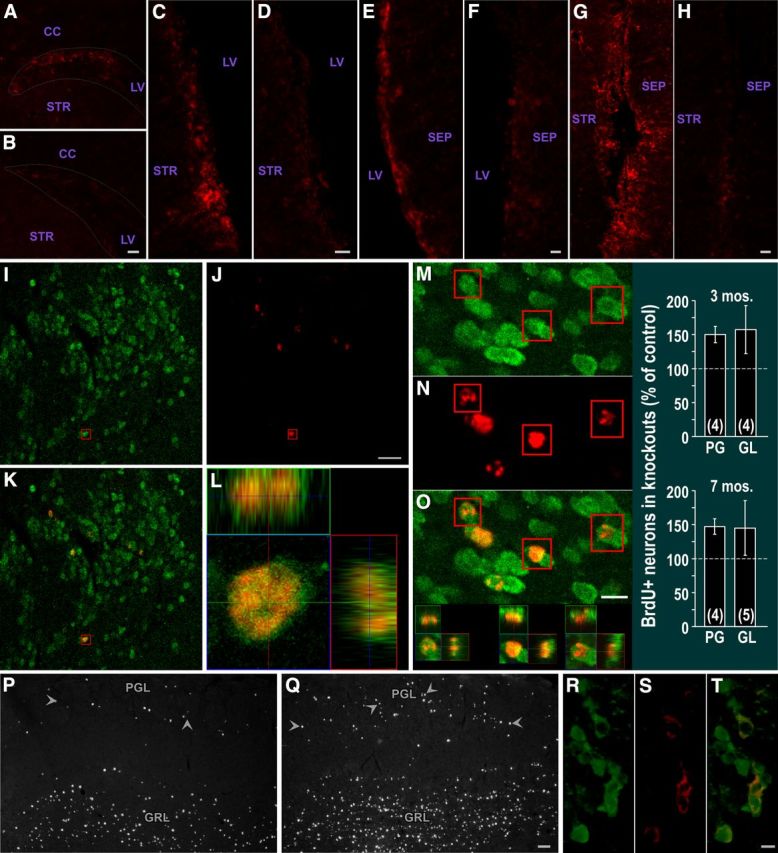
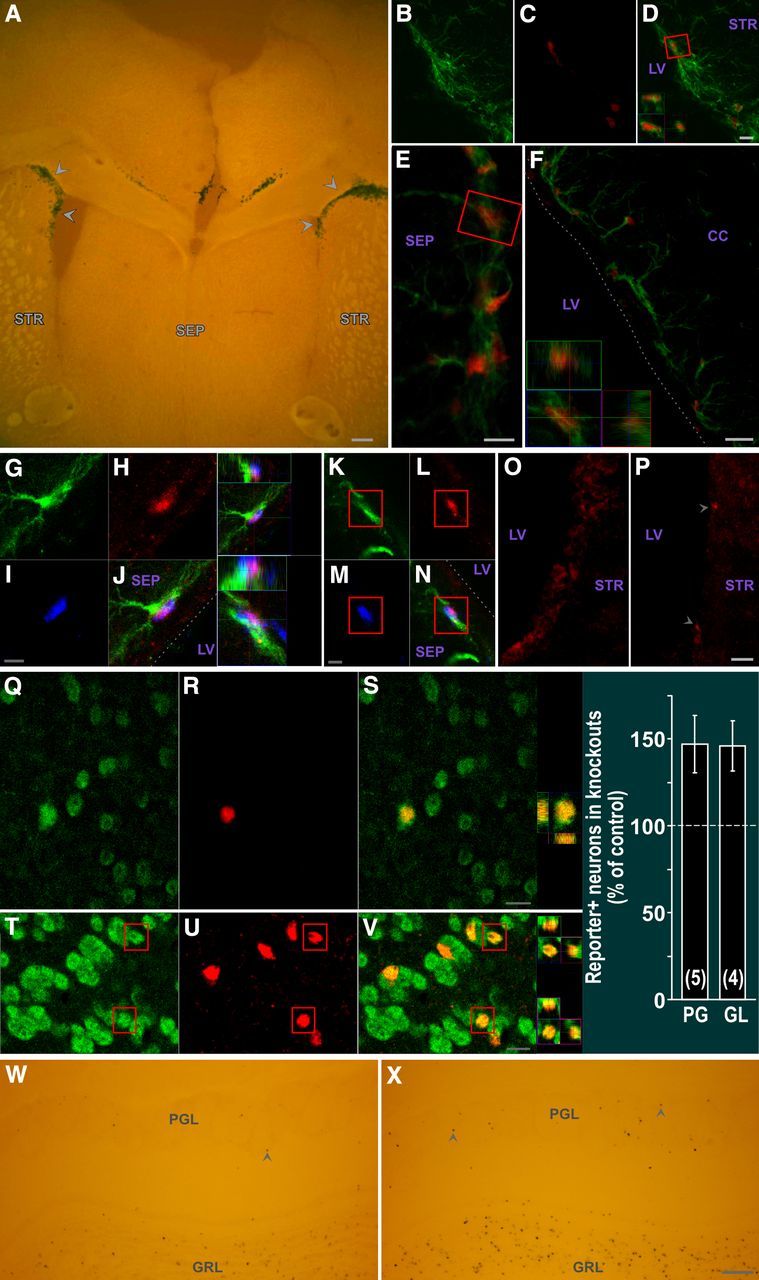
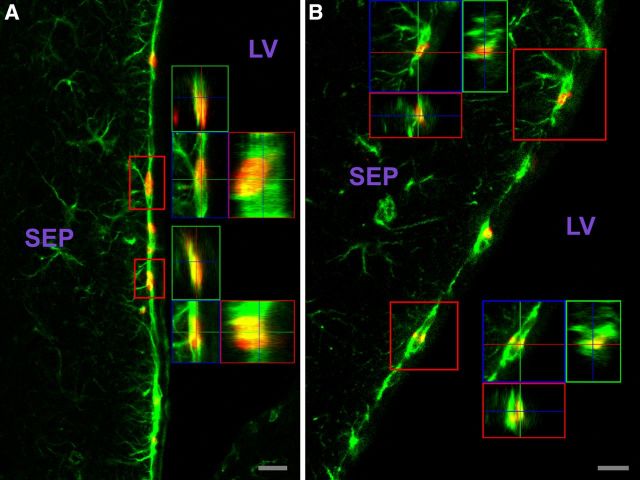
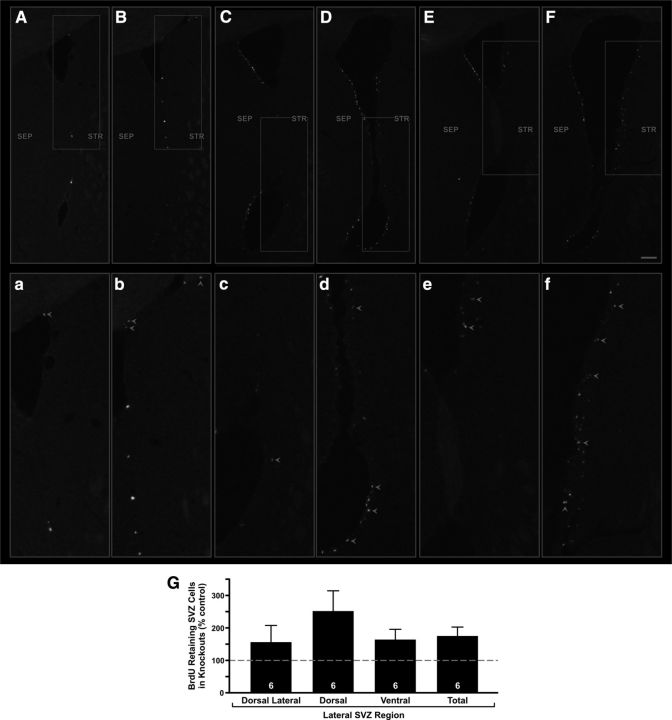
Appropriately targeted manipulation of endogenous neural stem progenitor (NSP) cells may contribute to therapies for trauma, stroke, and neurodegenerative disease. A prerequisite to such therapies is a better understanding of the mechanisms regulating adult NSP cells in vivo. Indirect data suggest that endogenous ciliary neurotrophic factor (CNTF) receptor signaling may inhibit neuronal differentiation of NSP cells. We challenged subventricular zone (SVZ) cells in vivo with low concentrations of CNTF to anatomically characterize cells containing functional CNTF receptors. We found that type B "stem" cells are highly responsive, whereas type C "transit-amplifying" cells and type A neuroblasts are remarkably unresponsive, as are GFAP(+) astrocytes found outside the SVZ. CNTF was identified in a subset of type B cells that label with acute BrdU administration. Disruption of in vivo CNTF receptor signaling in SVZ NSP cells, with a "floxed" CNTF receptor α (CNTFRα) mouse line and a gene construct driving Cre recombinase (Cre) expression in NSP cells, led to increases in SVZ-associated neuroblasts and new olfactory bulb neurons, as well as a neuron subtype-specific, adult-onset increase in olfactory bulb neuron populations. Adult-onset receptor disruption in SVZ NSP cells with a recombinant adeno-associated virus (AAV-Cre) also led to increased neurogenesis. However, the maintenance of type B cell populations was apparently unaffected by the receptor disruption. Together, the data suggest that endogenous CNTF receptor signaling in type B stem cells inhibits adult neurogenesis, and further suggest that the regulation may occur in a neuron subtype-specific manner.


Figures

Figure 1.
Figure 1.
The adult SVZ contains GFAP+ cells with functional CNTF receptors. As described in the text, pSTAT3 immunohistochemistry of SVZ region injected with CNTF (A) or contralateral side receiving vehicle (B); image flipped horizontally to aid comparison. Images were identically captured and optimized. Arrows indicate examples of SVZ cells. C–K, Most, and likely all, GFAP+ SVZ cells display a robust pSTAT3 response to CNTF. GFAP signal (green) is cytoplasmic and pSTAT3 signal (red) is nuclear such that comparatively little yellow signal is produced for double-labeled cells. Two individual channels are presented, and merged images are in right panels. C–E, Example showing responsive cells throughout the SVZ. F–H, Dorsal septal SVZ with examples of double-labeled cells with few primary processes; 3D views (X, Y, and Z “cuts”) through boxed cells are in H. Broken line indicates approximate edge of tissue. I–K, Examples of RMS double-labeled cells; 3D views of boxed cells are in K. CC, Corpus callosum; STR, striatum; SEP, septum; LV, lateral ventricle. Scale bars: (in A) A, B, 25 μm; E, 500 μm; H, K, 10 μm.
Figure 2.
Figure 2.
Functional in vivo CNTF receptors in the SVZ are restricted to type B “stem” cells. A–C, SVZ cells selectively respond to CNTF. Injecting CNTF into striatum away from SVZ demonstrates that SVZ GFAP+ (green) cells display robust pSTAT3 response (red), whereas other cells, including GFAP+ cells closer to the needle tract (arrowheads) that receive higher CNTF concentrations, do not respond. D–G, Type B stem cells contain functional CNTF receptors. GFAP+ (green) SVZ cells with few processes, and retention of BrdU (blue) administered a month before death, display a pSTAT3 response (red) to CNTF. Three individual channels and merged image are presented. B, Inset, The 3D views of cell boxed in D. Dotted line indicates approximate edge of tissue. H–I, PSA-NCAM+ SVZ cells do not express functional CNTF receptors. PSA-NCAM+ (green, cytoplasmic label) cells do not display a CNTF-induced pSTAT3 response (red, nuclear). I, Region boxed in H with pSTAT3 signal intensity increased to better demonstrate lack of pSTAT3 label in PSA-NCAM+ cells “cut” through their nucleus (e.g., arrowheads). J–L, Ascl1+ SVZ cells do not express functional CNTF receptors. Ascl1+ (green) cells do not display a CNTF-induced pSTAT3 response (red). Two individual channels and merged image in right panel. The 3D views through boxed cells are in L. Abbreviations as in Figure 1. Scale bars: C, 50 μm; E, 5 μm; H, 25 μm; I, 12 μm; L, 20 μm.
Figure 3.
Figure 3.
CNTFRα and CNTF are expressed in type B stem cells. Although the CNTFRα immunohistochemistry signal is not as “clean” as the pSTAT3 signal (e,g,. Fig. 2), both approaches reveal the same cell type-specific pattern of expression for CNTF receptors. A–C, CNTFRα immunoreactivity (red) colocalizes with GFAP (green) in the dorsal later SVZ. Solid arrows indicate regions of intense label for both. D–I, CNTFRα immunoreactivity (red) does not colocalize with Ascl1+ (green) cells (presumptive type C cells) in the dorsal later SVZ. Open arrows indicate examples of Ascl1+ cells. J–O, CNTFRα immunoreactivity (red) does not colocalize with PSA-NCAM+ (green) cells in the dorsal later SVZ. Open arrows indicate examples of PSA-NCAM+ cells. The dorsal lateral SVZ was chosen for these illustrations because it contains many well-labeled GFAP+, PSA-NCAM+, and Ascl1+ cells. P–S, Example of a GFAP+ (green)/CNTFRα+ (red)/ BrdU retaining (blue) cell in the striatal SVZ with few primary processes. Line indicates approximate edge of the tissue. Far left panel, 3D view. T–Z, a, CNTF (red) is found in GFAP+ (green) SVZ cells with few primary processes that also label for BrdU (blue) administered a month before perfusion. 3D views of boxed triple-labeled cells are presented. Lower levels of CNTF are also detected as label in the ependymal cell layer. b, In contrast, no CNTF is detected in PSA-NCAM+ (green) SVZ cells. Dotted lines indicate the approximate ventricular edge of tissue. Abbreviations as in Figure 1. Scale bars, 5 μm.
Figure 4.
Figure 4.
hGFAP-Cre induces floxed gene excision in type B stem cells and their progeny. A–D, Xgal histology of hGFAP-Cre+/ROSA26+ mice. (A) hGFAP-Cre gene excision in SVZ, including regions extending beneath white matter (arrows). B, hGFAP-Cre gene excision throughout SVZ and RMS (arrowheads in rostral to caudal series of sections). Medial is to the right in all panels. C, hGFAP-Cre gene excision in olfactory bulb granule layer (GRL) and periglomerular layer (PGL) cells. D, Spinal cord motor neurons (e.g., arrow) are not affected, in contrast to small non-neuronal cells (presumptive astrocytes; e.g., arrowhead). A, D, Sections were CV counterstained. E–L, Proliferating (BrdU+; blue) SVZ, GFAP+ (green) cells with few primary processes (type B stem cells) displaying βGal reporter signal (red) in hGFAP-Cre mice. Top 3D view in middle panels, cell in E–H; bottom 3D view, cell in I–L. Septal type B cell examples are shown because type B cell morphology is clearest in this region. Dotted line indicates approximate edge of tissue. M–O, hGFAP-Cre gene excision in essentially all RMS neuroblasts. CAG-CAT-EGFP reporter-positive (green), doublecortin+ (red) RMS neuroblasts with merged view in O. 3D view in O, boxed cell. P–S, hGFAP-Cre gene excision in essentially all PG neurons. CAG-CAT-EGFP reporter (green), NeuN+ (red), and merged views. 3D view in S, boxed cells. Abbreviations as in Figure 1. Scale bars: A, 50 μm; B, 200 μm; C, 100 μm; D, 50 μm; H, 5 μm; L, 2 μm; M, 10 μm; Q, 10 μm.
Figure 5.
Figure 5.
hGFAP-Cre-induced excision of the floxed CNTFRα gene disrupts functional CNTF receptors. The CNTF-induced SVZ pSTAT3 response of control mice is greatly reduced in hGFAP-Cre, floxed CNTFRα “knock-out” mice with only rare cells displaying pSTAT3 elevation comparable to controls. Each set of four images presents, from left to right: DAPI stain of control section, pSTAT3 immunohistochemistry of same control section, DAPI stain of knock-out section, and pSTAT3 immunohistochemistry of same knock-out section. A–H, The sets of images are ordered rostral to caudal through the SVZ. Medial is to the left in all cases. The knock-out mouse and its littermate control pair were processed in parallel. All compared images were identically captured and optimized. Scale bars, 100 μm.
Figure 6.
Figure 6.
Depletion of SVZ CNTFRα and increased olfactory bulb neurogenesis in hGFAP-Cre, floxed CNTFRα “knock-out” mice. CNTFRα immunohistochemistry of control (A, C, E, G) or knock-out (B, D, F, H) SVZ. A, B, Dorsal lateral SVZ. C, D, Lateral/striatal SVZ. E, F, Medial/septal SVZ. G, H, Ventral SVZ. Each set of compared images was acquired and optimized identically. The knock-out mouse and its littermate control pair were processed in parallel. Dotted lines outline approximate borders of dorsal lateral SVZ. I–O, Multilabel, 3D confocal data from mice administered BrdU 1 month before death indicate that essentially all BrdU-labeled cells in the granular layer (GRL) and PG layer (PGL) of the olfactory bulb are NeuN+ neurons. Examples of neurons (NeuN+; green) labeled with BrdU (red). I–L, PG neurons. M–O, GL neurons. Boxed cells shown as 3D view. P, Q, hGFAP-Cre, floxed CNTFRα “knock-out” mice display an increase in BrdU-labeled cells in the granular layer (GRL) and PG layer (PGL) of the olfactory bulb 1 month after BrdU administration. Examples of olfactory bulb sections from a control mouse (P) and its knock-out littermate (Q) injected with BrdU at 2 months of age and killed at 3 months. Arrowheads indicate examples of PG neurons. Images were identically captured and optimized. Bar graph summarizes quantification of BrdU-positive PG and GL neurons in 3- and 7-month-old mice. Numbers in bars indicate the number of knock-out–control pairs quantified. R–T, hGFAP-Cre leads to floxed gene excision in TH+ PGL cells. GFP reporter signal (green) in TH+ (red) PG neurons of hGFAP-Cre+/CAG-CAT-EGFP reporter-positive mouse. T, Merged view. Abbreviations as in Figure 1. Scale bars: B, D, H, 20 μm; F, 10 μm; I–L, 20 μm; M–O, 10 μm; P, Q, 50 μm; R–T, 5 μm.
Figure 7.
Figure 7.
AAV-Cre infection of adult SVZ leads to floxed gene excision in SVZ type B stem cells as well as SVZ CNTFRα depletion and increased olfactory bulb neurogenesis in floxed CNTFRα mice. A, X-gal (dark blue) reporter signal and autofluorescent pseudo “counterstain” showing a high density of Xgal+ SVZ cells (arrowheads). B–D, Cre (red) expression in GFAP+ (green) SVZ cells. D, Merged view. Boxed cell shown as 3D view in D. E, F, Floxed gene excision in GFAP+ SVZ cells. βGal reporter signal (red) in GFAP+ (green) cells of (E) septal and (F) corpus callosum SVZ. 3D view of cell boxed in E is shown in F. Dotted line indicates approximate edge of tissue. G–N, Floxed gene excision in type B stem cells. βGal reporter signal (red) is detected in GFAP+ (green) SVZ cells with few primary processes that also label with BrdU (blue) administered 1 month before death. 3D views of triple-labeled cells are presented. Dotted lines delineate approximate edge of tissue. O, P, AAV-Cre infection of SVZ of floxed CNTFRα mice leads to depletion of CNTFRα. CNTFRα immunohistochemistry examples of infected SVZ regions of control (O) and floxed CNTFRα (P) mice. P, Arrowheads indicate examples of rare cells with CNTFRα. Q–V, Multilable 3D confocal data from AAV-Cre-injected ROSA26 reporter mice indicate that essentially all resulting reporter-positive PG and GL cells are NeuN+ neurons. Examples of βGal reporter signal (red) in NeuN+ (green) PG (Q–S) and GL (T–V) neurons, with 3D views of boxed neurons. W, X, AAV-Cre infected floxed CNTFRα “knock-out” mice display significantly increased neurogenesis relative to identically treated littermate controls injected and processed in parallel (see text for statistics). Examples of ROSA26 reporter+ (Xgal+) cells in the granular layer (GRL) and PG layer (PGL) of a control mouse (W) and its floxed CNTFRα littermate (X). X-gal (dark blue) reporter signal and autofluorescent pseudo “counterstain” are shown. Arrowheads designate examples of PG neurons. Images were identically captured and optimized. Bar graph summarizes quantification of reporter-positive PG and GL neurons. Numbers in bars indicate the number of knock-out–control pairs quantified. Abbreviations as in Figure 1. Scale bars: A, 50 μm; B–D, 10 μm; E, 5 μm; F, 10 μm; G–N, 5 μm; O, P, 10 μm; Q–S, 5 μm; T–V, 10 μm; W, X, 100 μm.
Figure 8.
Figure 8.
Type B stem cells in septal SVZ can be accurately quantified. Examples in A and B of GFAP+ (green) septal SVZ cells that retain BrdU (red) administered 1 month before death and display type B cell morphology (few primary processes emanating from soma). In most cases, these prominent processes run parallel with, and overlap, those of neighboring GFAP+ cells. 3D views of boxed cells shown. Abbreviations as in Figure 1. Scale bars, 10 μm.
Figure 9.
Figure 9.
CNTF receptor disruption in hGFAP-Cre, floxed CNTFRα “knock-out” mice leads to an increase in BrdU-retaining cells in the lateral SVZ. Sections from an hGFAP-Cre, floxed CNTFRα “knock-out” mouse (B, D, F) and a littermate control (A, C, E), both injected with BrdU at 6 months of age and processed for BrdU immunohistochemistry at 7 months. Although the number of BrdU-labeled cells in the medial/septal SVZ is not affected by the knock-out, the knock-out mice display significantly more BrdU-labeled cells in the lateral/striatal SVZ relative to their littermate controls. The examples are presented rostral to caudal. Sections were processed free floating and subsequently slide mounted such that the section in E contains some overlapped tissue. af, Higher-magnification views of boxed regions in A–F. Arrowheads indicate examples of BrdU-labeled cells. Scale bar: A–F, 100 μm. G, Quantification reveals a knock-out-induced increase in BrdU-retaining cells in the lateral SVZ. Dorsal Lateral indicates Dorsal lateral SVZ extension; Dorsal, the remainder of the dorsal half of the lateral SVZ; Ventral, ventral half of the lateral SVZ. The knock-out effects in the individual regions were not statistically significant because of the degree of variability, but ANOVA indicates that the number of cells in the entire lateral SVZ (Total) displayed a significant increase (p < 0.01, F = 9.84) with no difference between the individual regions (p > 0.05; F = 1.12) and no interaction (p > 0.05; F = 1.12). Number of knock-out–control littermate pairs quantified is indicated in the bars.

Similar articles

Cited by

References

    1. Altman J, Das GD. Autoradiographic and histological studies of postnatal neurogenesis. I. A longitudinal investigation of the kinetics, migration and transformation of cells incorporating tritiated thymidine in neonate rats, with special reference to postnatal neurogenesis in some brain regions. J Comp Neurol. 1966;126:337–389. - PubMed
    1. Alvarez-Buylla A, Garcia-Verdugo JM. Neurogenesis in adult subventricular zone. J Neurosci. 2002;22:629–634. - PMC - PubMed
    1. Alvarez-Buylla A, García-Verdugo JM, Tramontin AD. A unified hypothesis on the lineage of neural stem cells. Nat Rev Neurosci. 2001;2:287–293. - PubMed
    1. Androutsellis-Theotokis A, Leker RR, Soldner F, Hoeppner DJ, Ravin R, Poser SW, Rueger MA, Bae SK, Kittappa R, McKay RD. Notch signaling regulates stem cell numbers in vitro and in vivo. Nature. 2006;442:823–826. - PubMed
    1. Bagley J, LaRocca G, Jimenez DA, Urban NN. Adult neurogenesis and specific replacement of interneuron subtypes in the mouse main olfactory bulb. BMC Neurosci. 2007;8:92. - PMC - PubMed

Publication types

MeSH terms

Substances