

Obesity prevalence among low-income, preschool-aged children--New York City and Los Angeles County, 2003-2011
- PMID: 23325351
- PMCID: PMC4604837
Obesity prevalence among low-income, preschool-aged children--New York City and Los Angeles County, 2003-2011
Abstract
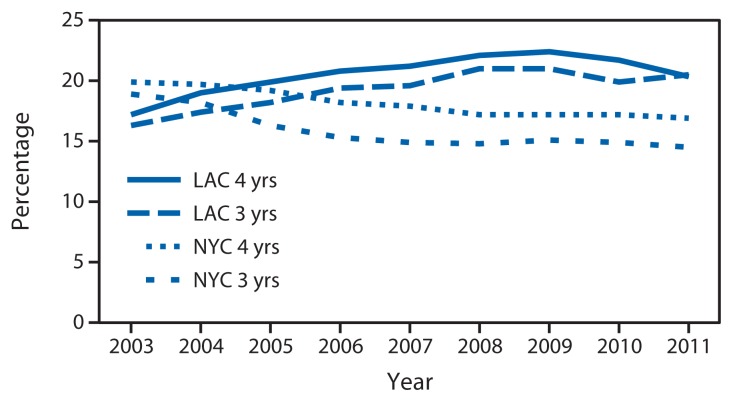
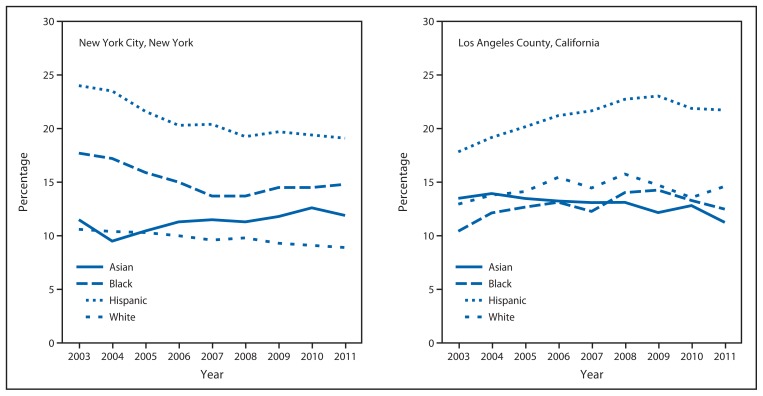
Recent studies have reported evidence of a leveling and decline in childhood obesity prevalence in New York and California. However, some areas of the United States continue to experience increases in the prevalence of childhood obesity. To assess differences and changes over time in early childhood obesity in the two most populous cities in the United States, obesity prevalence among low-income, preschool-aged children enrolled in the Special Supplemental Nutrition Program for Women, Infants, and Children (WIC) in New York City (NYC) was compared with obesity prevalence among WIC-enrolled children in Los Angeles County (LAC) during 2003-2011. In NYC, from 2003 to 2011, obesity prevalence decreased among blacks, whites, and Hispanics, but increased among Asians. In LAC, obesity prevalence decreased among Asians and increased and then decreased among blacks and Hispanics from 2003 to 2011. Hispanic WIC-enrolled children had the greatest prevalence of obesity for all years in both areas. In 2011, the obesity prevalence among Hispanics in NYC was 19.1%, compared with 21.7% in LAC. Comparisons of obesity prevalence data among cities and states might suggest interventions and policies to help reverse childhood obesity increases in some populations.
Figures
References
-
- CDC. Obesity in K–8 students—New York City, 2006–07 to 2010–11 school years. MMWR. 2011;60:1673–8. - PubMed
-
- Singh GK, Kogan MD, van Dyck PC. Changes in state-specific childhood obesity and overweight prevalence in the United States from 2003 to 2007. Arch Pediatr Adolesc Med. 2010;164:598–607. - PubMed
MeSH terms
LinkOut - more resources
Full Text Sources
Medical
