. 2013 Mar;304(6):C561-73.
doi: 10.1152/ajpcell.00189.2012. Epub 2013 Jan 16.

Shank2 contributes to the apical retention and intracellular redistribution of NaPiIIa in OK cells

Affiliations

Shank2 contributes to the apical retention and intracellular redistribution of NaPiIIa in OK cells

Evgenia Dobrinskikh et al. Am J Physiol Cell Physiol. 2013 Mar.

Abstract

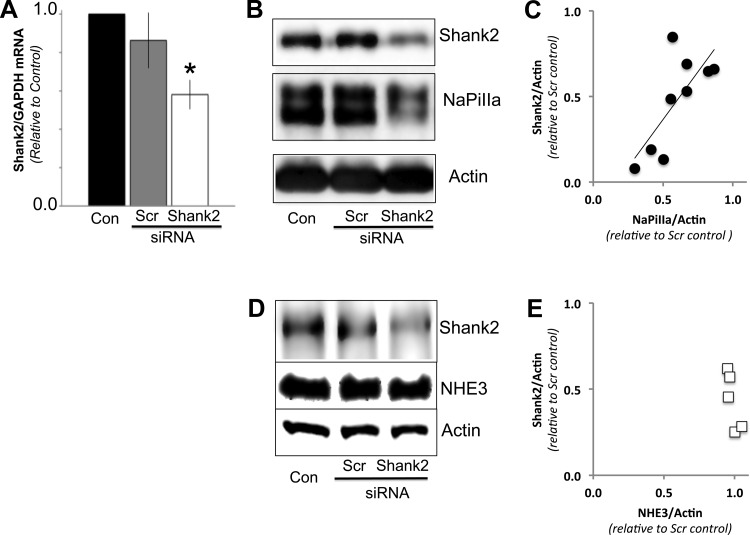
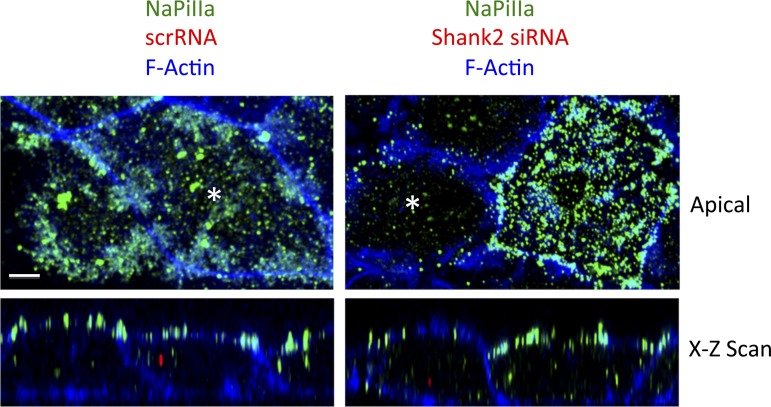
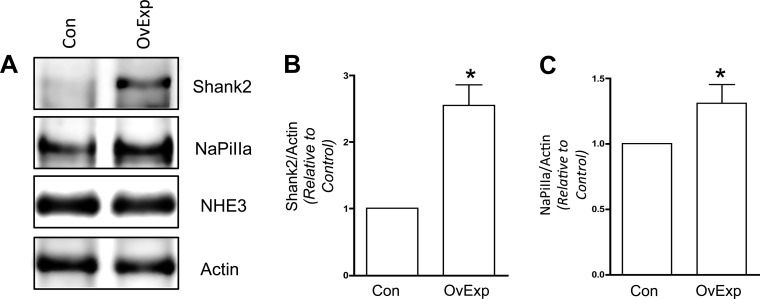
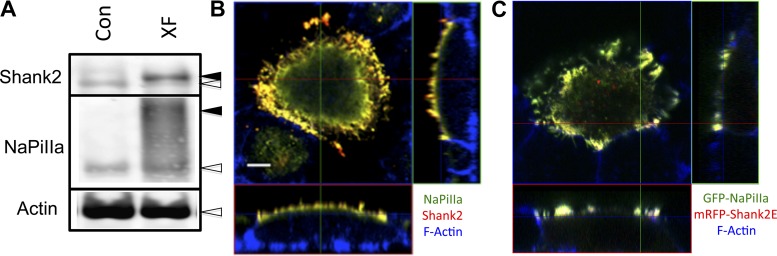
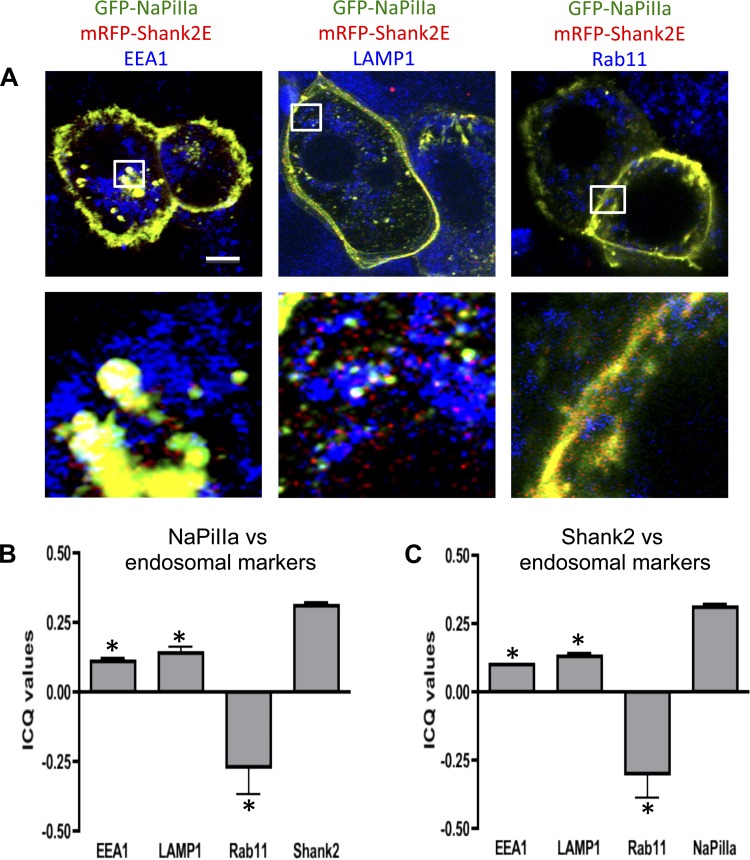
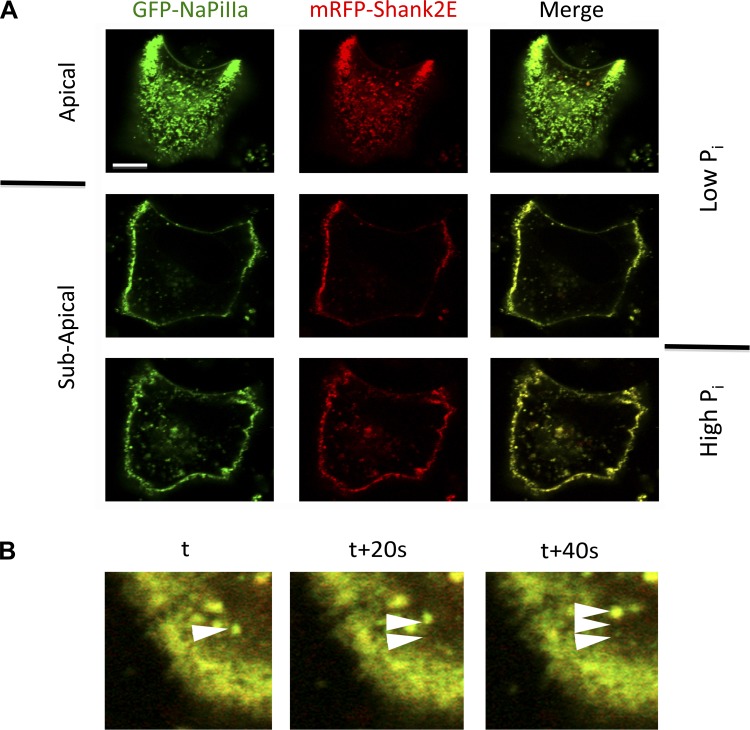
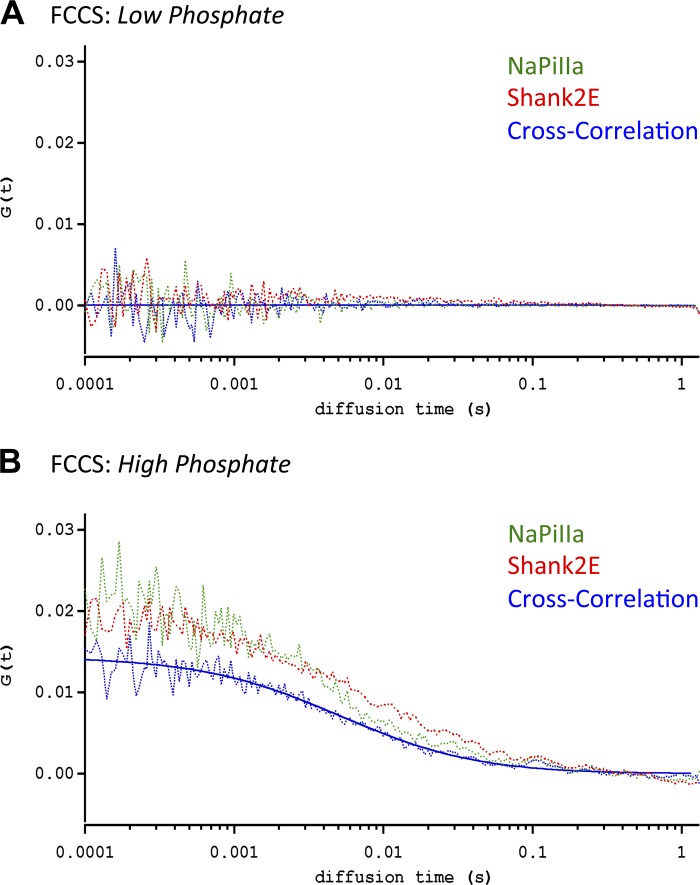
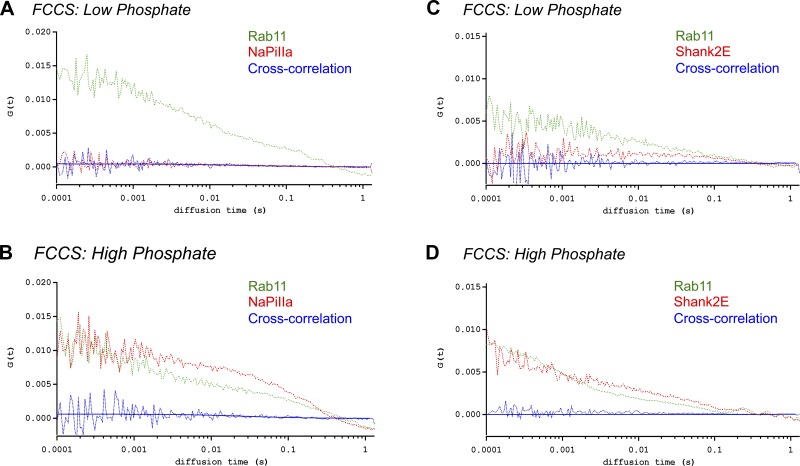
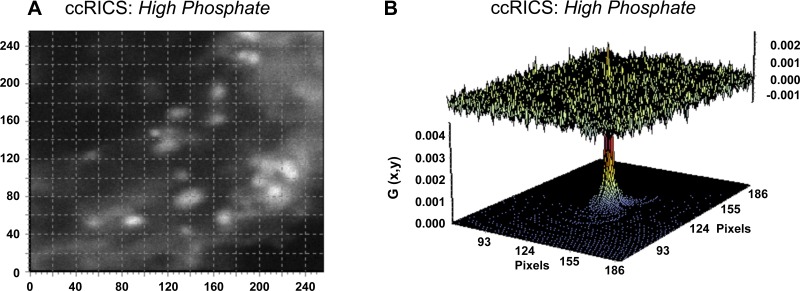
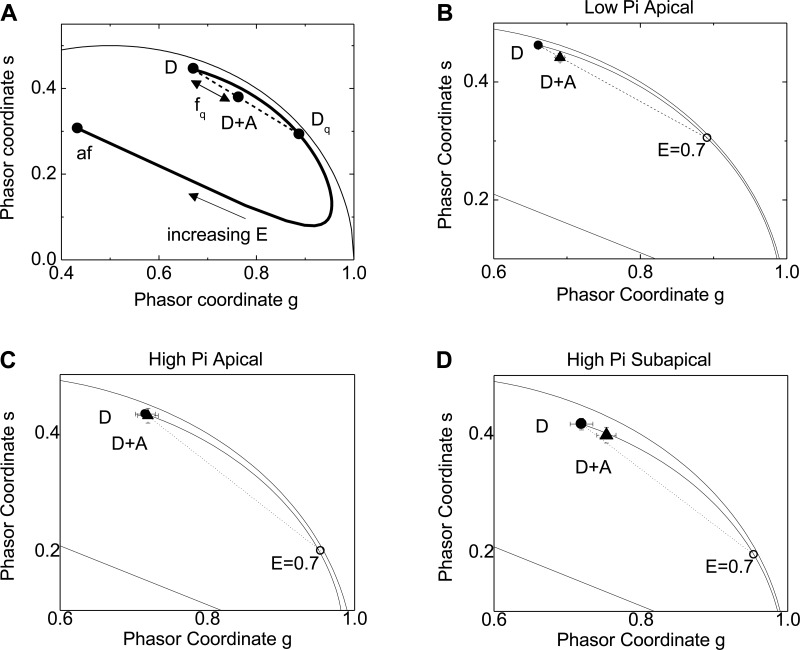
In renal proximal tubule (PT) cells, sodium-phosphate cotransporter IIa (NaPiIIa) is normally concentrated within the apical membrane where it reabsorbs ∼70% of luminal phosphate (Pi). NaPiIIa activity is acutely regulated by moderating its abundance within the apical membrane. Under low-Pi conditions, NaPiIIa is retained within the apical membrane. Under high-Pi conditions, NaPiIIa is retrieved from the apical membrane and trafficked to the lysosomes for degradation. The present study investigates the role of Shank2 in regulating the distribution of NaPiIIa. In opossum kidney cells, a PT cell model, knockdown of Shank2 in cells maintained in low-Pi media resulted in a marked decrease in NaPiIIa abundance. After being transferred into high-Pi media, live-cell imaging showed that mRFP-Shank2E and GFP-NaPiIIa underwent endocytosis and trafficked together through the subapical domain. Fluorescence cross-correlation spectroscopy demonstrated that GFP-NaPiIIa and mRFP-Shank2 have indistinguishable diffusion coefficients and migrated through the subapical domain in temporal synchrony. Raster image cross-correlation spectroscopy demonstrated these two proteins course through the subapical domain in temporal-spatial synchrony. In the microvilli of cells under low-Pi conditions and in the subapical domain of cells under high-Pi conditions, fluorescence lifetime imaging microscopy-Forster resonance energy transfer analysis of Cer-NaPiIIa and EYFP-Shank2E found these fluors reside within 10 nm of each other. Demonstrating a complexity of functions, in cells maintained under low-Pi conditions, Shank2 plays an essential role in the apical retention of NaPiIIa while under high-Pi conditions Shank2 remains associated with NaPiIIa and escorts NaPiIIa through the cell interior.


Figures

Fig. 1.
Fig. 1.
Shank2 small interfering (si)RNAs knockdown levels of Shank2 mRNA and protein. A: quantitative (q)PCR analysis of opossum kidney (OK) cells treated with Shank2 siRNAs had significantly lower levels of Shank2/GAPDH mRNA compared with either untreated controls (Con) or cells transfected with scrambled (Scr) siRNAs (n = 3; *P < 0.05). B: Western blot analysis of OK cells treated with Shank2 siRNAs had significantly lower levels of Shank2/actin protein compared with either untreated controls (Con) or cells transfected with scrambled siRNAs (Scr). The abundance of sodium-phosphate cotransporter IIa (NaPiIIa) was also markedly reduced in the cells treated with Shank2 siRNAs. Actin served as a loading control. C: in OK cells treated with Shank2 vs. scrambled siRNAs, linear regression analysis of the densitometric data from the Western blots showed a linear correlation between level of Shank2 knockdown and NaPiIIa abundance (r2 = 0.59; P = 0.02; n = 9 pairs). D: Western blot analysis of cells treated with Shank2 siRNAs showed a decrease in Shank2 abundance but no significant difference in sodium-proton exchanger 3 (NHE3) abundance. E: graph displays densitometry values and shows that despite a range of Shank2 knockdown levels, the NHE3 levels remain similar to those found in Scr siRNA control cells (n = 5).
Fig. 2.
Fig. 2.
Shank2 knockdown alters the abundance and distribution of NaPiIIa. Left: in OK cells transfected with scrambled siRNAs (red puncta seen in the x-z scan; denoted by * in the apical x-y scan), imaging in both the x-y and x-z axes shows NaPiIIa (green) concentrated within the apical domain. This pattern and the signal abundance is similar to that seen in adjacent cells with no observed uptake of scrambled siRNAs (no red observed in cell interior). Right: OK cells transfected with Shank2 siRNAs (red puncta seen in the x-z scan; denoted with an asterisk in the apical x-y scan) had markedly less NaPiIIa (green) than adjacent, untransfected cells (no red observed in cell interior). NaPiIIa remaining in the Shank2 siRNA-transfected cells was observed in both the apical membrane and the cell interior (n = 4 preps; 10 cells/prep). Bar = 5 μm. Apical sections shown are from four 0.5-μm stacked sections.
Fig. 3.
Fig. 3.
Shank2 overexpression (OvExp) increases NaPiIIa abundance. A: in OK cells transfected with Flag-Shank2 cDNA, densitometric analysis found Shank2 abundance increased by 2.55 ± 0.31 times compared with control cells (Con; n = 4; *P < 0.05). No change in NHE3 levels were observed. B: Flag-Shank2-transfected cells had a modest but significant increase in the abundance of endogenous NaPiIIa (1.31 ± 0.14 times vs. control) measured in Shank2-transfected cells (n = 4; *P < 0.05). C: NaPiIIa/actin.
Fig. 4.
Fig. 4.
GFP-NaPiIIa and mRFP-Shank2E expression characteristics in OK cells. A: Western blotting shows recombinant GFP-NaPiIIa and mRFP-Shank2E (closed arrowheads) are expressed at modestly higher levels than native NaPiIIa and Shank2 (open arrowheads). Actin served as a loading control (XF, transfected). B: confocal imaging in the X-Z (bottom rectangle) and Y-Z planes (right rectangle) shows that native NaPiIIa (green) and Shank2 (red) are concentrated at the apical domain. F-actin (blue) delineates the cell periphery. X-Y scans (top left box) are at the level of the subapical domain. C: confocal imaging shows that recombinant GFP-NaPiIIa (green) and mRFP-Shank2E (red) are similarly concentrated at the apical domain. Bar = 5 μm.
Fig. 5.
Fig. 5.
GFP-NaPiIIa and mRFP-Shank2E colocalize in the cell interior. A: after a 1-h incubation in high phosphate media, GFP-NaPiIIa (green) and mRFP-Shank2E (red) are present within the cell interior and colocalize with each other (i.e., yellow). Partial colocalization of GFP-NaPiIIa and mRFP-Shank2E with EEA1 (left; blue) and LAMP1 (middle; blue) but not with rab11 (right; blue) is observed (i.e., white). bar = 5 μm. White boxes (5 × 5 μm) in upper panels are shown at higher magnification in lower panels. B: ICQ values for NaPiIIa showed a modest positive correlation with EEA1 (0.11 ± 0.01; n = 7) and LAMP1 (0.14 ± 0.02; n = 7), a negative correlation with rab11 (−0.26 ± 0.09; n = 7) and a strong positive correlation with Shank2E (0.31 ± 0.01; n = 7). C: likewise, ICQ values for Shank2E showed a modest positive correlation with EEA1 (0.10 ± 0.02; n = 7) and LAMP1 (0.13 ± 0.01; n = 7), a negative correlation with rab11 (−0.29 ± 0.09; n = 7) and a strong positive correlation with NaPiIIa (0.31 ± 0.01; n = 7). *P < 0.05 vs. NaPiIIa/or Shank2.
Fig. 6.
Fig. 6.
Live-cell imaging of GFP-NaPiIIa and mRFP-Shank2-containing endosomes. A: live-cell confocal imaging of GFP-NaPiIIa (green) and mRFP-Shank2 (red) in OK cells shows that in low-Pi media both proteins are concentrated within the apical domain with very little of either protein in the subapical domain. Upon shifting cells into high-Pi media, both proteins migrate into the subapical domain. High-Pi images were taken after 60 min in high-Pi media. Merged images of both channels show a high degree of colocalization of both proteins within the apical and subapical domains. Bar = 5 μm. B: merged images of GFP-NaPiIIa (green) and mRFP-Shank2E (red) captured at sequential 20-s time intervals. Arrowheads highlight the sequential migration of a dual-labeled endosome after 0, 20, and 40 s. Bar = 5 μm.
Fig. 7.
Fig. 7.
Fluorescence correlation spectroscopy (FCS) and fluorescence cross-correlation spectroscopy (FCCS) analysis of GFP-NaPiIIa and mRFP-Shank2 comigration. A: FCS analysis of OK cells under low-Pi conditions found little evidence of GFP-NaPiIIa (green line) and mRFP-Shank2 (red line) migration through a focal volume within the subapical domain. B: after 60 min under high-Pi conditions, FCS analysis readily detected the migration of GFP-NaPiIIa (green line) and mRFP-Shank2 (red line) within the subapical domain. FCCS analysis showed a strong degree of cross-correlation (blue line; both raw data and fitted line are shown) in the temporal patterns of GFP-NaPiIIa and mRFP-Shank2 transit through the focal volume.
Fig. 8.
Fig. 8.
FCS/FCCS analysis of rab11 vs. NaPiIIa and Shank2 comigration. A: FCS analysis of OK cells under Low-Pi conditions measured the temporal migration of GFP-rab11 (green line) through a focal volume within the subapical domain but found little evidence of mCherry-NaPiIIa (red line) migration through the same volume. B: after 60 min under High-Pi conditions, FCS analysis readily detected the migration of GFP-rab11 (green line) and mCherry-NaPiIIa (red line) within the subapical domain. FCCS analysis (blue line; both raw data and fitted line are shown), however, measured no appreciable cross-correlation in the temporal patterns of GFP-rab11 and mCherry-NaPiIIa migration. C and D: similar to rab11 vs. NaPiIIa above, FCCS analysis found no cross-correlation in the temporal patterns of GFP-rab11 and mRFP-Shank2 migration under high-Pi conditions.
Fig. 9.
Fig. 9.
Raster image cross-correlation spectroscopy (ccRICS) analysis of GFP-NaPiIIa and mRFP-Shank2 comigration. A: single 256 × 256 pixel frame from a 100-frame ccRICS raster scan in the subapical domain taken after one h in High-Pi media shows an abundance of cross-correlated GFP-NaPiIIa and mRFP-Shank2E signal. Immobile and slow-moving signals were mathematically removed and are not present in the image. B: three-dimensional presentation of the two-dimensional fitting function of the ccRICS data (top) shows a distinct conical peak, representing a high degree of synchrony in the temporal-spatial migration patterns of GFP-NaPiIIa and mRFP-Shank2. The residuals, the difference between the measured data and fitting function (bottom), demonstrate the tightness of the fit.
Fig. 10.
Fig. 10.
fluorescence lifetime imaging microscopy-Forster resonance energy transfer (FRET-FLIM) analysis of Cer-NaPiIIa and EYFP-Shank2E association. A: schematic representation of a phasor plot from a FLIM-FRET measurement showing how FRET is quantified in terms of an efficiency (E) and fraction of quenched donors (fq). Phasor position of the fluorescence lifetime values from cells cotransfected with donor and acceptor proteins (D + A) determines if FRET occurred. The distance between (D + A) and (D) normalized to the distance between (D) and (Dq) equals the fraction of donor fluorophors whose fluorescence lifetimes were decreased by FRET to the acceptor fluorophors (fq). B: within microvilli under low-Pi conditions, there was a significant separation in the phasor coordinates of (D) vs. (D + A). Analysis found there was FRET between 11 ± 2% of donor-acceptor pairs. C: within microvilli under high-Pi conditions, there was no discernible FRET observed. D: within the subapical domain under high-Pi conditions, FRET occurred between 10 ± 5% of donor-acceptor pairs.

Similar articles

Cited by

References

    1. Bacia K, Majoul IV, Schwille P. Probing the endocytic pathway in live cells using dual-color fluorescence cross-correlation analysis. Biophys J 83: 1184–1193, 2002. - PMC - PubMed
    1. Bastepe M, Juppner H. Inherited hypophosphatemic disorders in children and the evolving mechanisms of phosphate regulation. Rev Endocr Metab Disord 9: 171–180, 2008. - PubMed
    1. Berkel S, Marshall CR, Weiss B, Howe J, Roeth R, Moog U, Endris V, Roberts W, Szatmari P, Pinto D, Bonin M, Reiss A, Engels H, Sprengel R, Scherer SW, Rappold GA. Mutations in the SHANK2 synaptic scaffolding gene in autism spectrum disorder and mental retardation. Nat Genet 42: 489–491, 2010. - PubMed
    1. Berndt T, Kumar R. Novel mechanisms in the regulatioin of phosphorus homeostasis. Physiology 24: 17–25, 2009. - PMC - PubMed
    1. Capuano P, Bacic D, Stange G, Hernando N, Kaissling B, Pal R, Kocher O, Biber J, Wagner CA, Murer H. Expression and regulation of the renal Na/Pi cotransporter NaPi-IIa in a mouse model deficient for the PDZ protein, PDZK1. Pflügers Arch 449: 392–402, 2005. - PubMed

Publication types

MeSH terms

Substances