

doi: 10.1098/rsif.2012.0988.
Print 2013 Mar 6.
Spatial stochastic modelling of the Hes1 gene regulatory network: intrinsic noise can explain heterogeneity in embryonic stem cell differentiation
Affiliations
- PMID: 23325756
- PMCID: PMC3565746
- DOI: 10.1098/rsif.2012.0988
Item in Clipboard
Spatial stochastic modelling of the Hes1 gene regulatory network: intrinsic noise can explain heterogeneity in embryonic stem cell differentiation
J R Soc Interface.
.
Abstract
Individual mouse embryonic stem cells have been found to exhibit highly variable differentiation responses under the same environmental conditions. The noisy cyclic expression of Hes1 and its downstream genes are known to be responsible for this, but the mechanism underlying this variability in expression is not well understood. In this paper, we show that the observed experimental data and diverse differentiation responses can be explained by a spatial stochastic model of the Hes1 gene regulatory network. We also propose experiments to control the precise differentiation response using drug treatment.
Figures
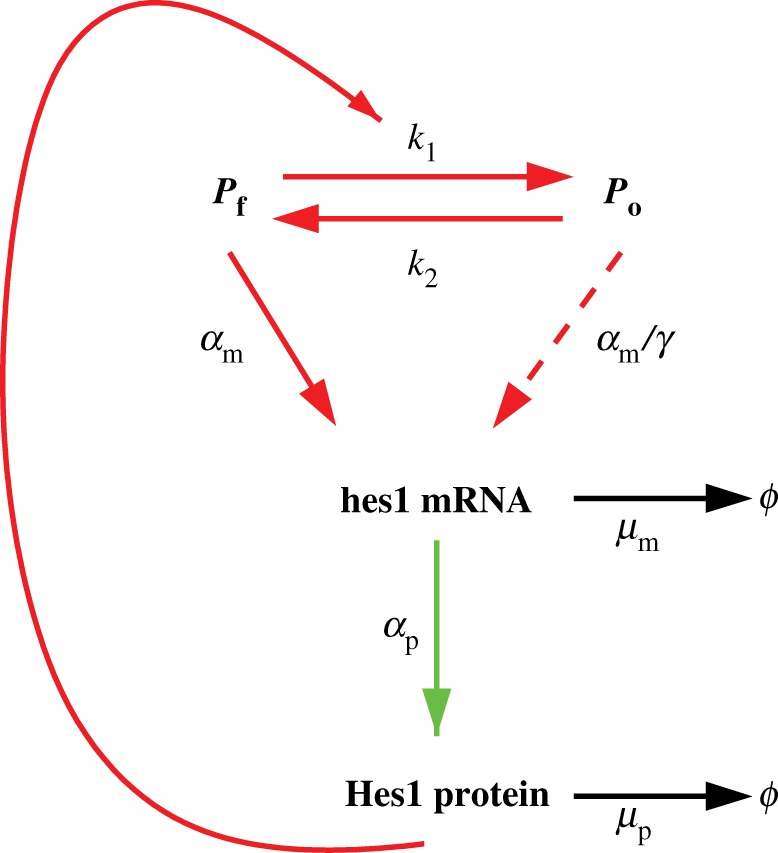
The negative feedback loop in the Hes1 GRN. When the promoter site is free, hes1 mRNA is transcribed at its maximal rate. hes1 mRNA then produces Hes1 protein via the process of translation. Hes1 protein occupies the promoter and represses the transcription of its own mRNA. The occupied promoter site is still able to produce hes1 mRNA, but at a significantly reduced rate [15]. Reaction arrows displayed in red only occur at the promoter site, while those in green occur only in the cytoplasm and those in black occur everywhere within the cell.
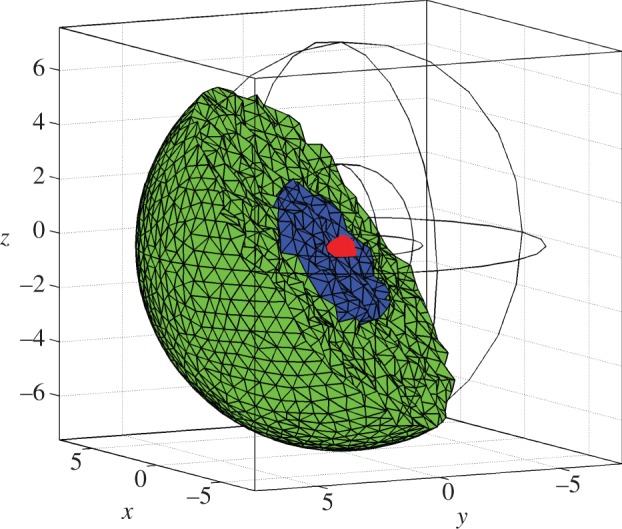
The three-dimensional meshed domain used in numerical simulations of the Hes1 model. The domain is discretized such that 10 946 voxels make up the domain. Here, the units of axes are in micrometres. The cell is represented by a sphere, centre (0,0), with a radius of 7.5 μm. The nucleus is shown as a blue sphere, centre (0,0), with a radius of 3 μm. The cytoplasm (shown in green) is the part of the cell that is outside the nucleus. The gene subdomain is chosen to be the voxel closest to the centre of the cell (0,0), a distance r from the nuclear membrane.
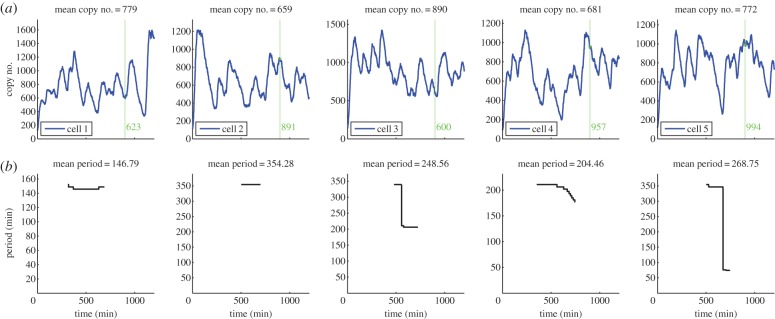
In row (a), plots of the total numbers of Hes1 protein (found by summing the number of proteins over the entire cell domain) are presented against time for five different trajectories of the Hes1 model. The mean copy numbers are displayed in the titles of row (a). The green vertical line represents the transference of cells to a neural differentiation medium. The number highlighted in green is the copy number of Hes1 at this time. Row (b) shows the corresponding time varying period as approximated by a Morlet continuous time wavelet transform with Gaussian edge elimination. The mean periods are displayed in the titles of row (b). Baseline parameter values are used (table 1).
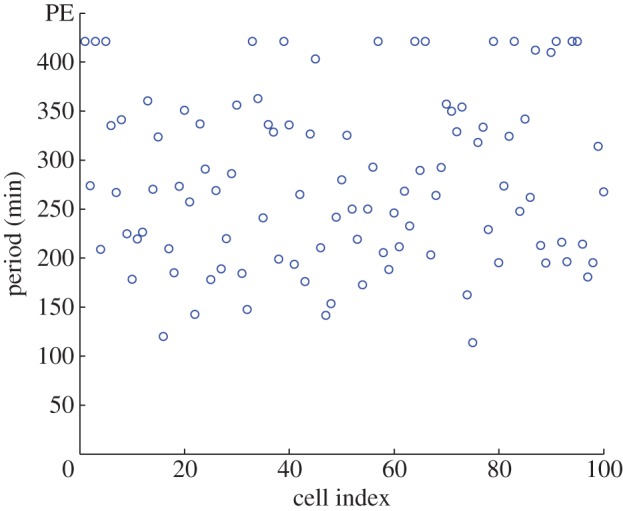
Plot showing the period of 100 different trajectories. The periods were calculated using a Morlet continuous wavelet transform with Gaussian edge elimination. Baseline parameter values are used (table 1).
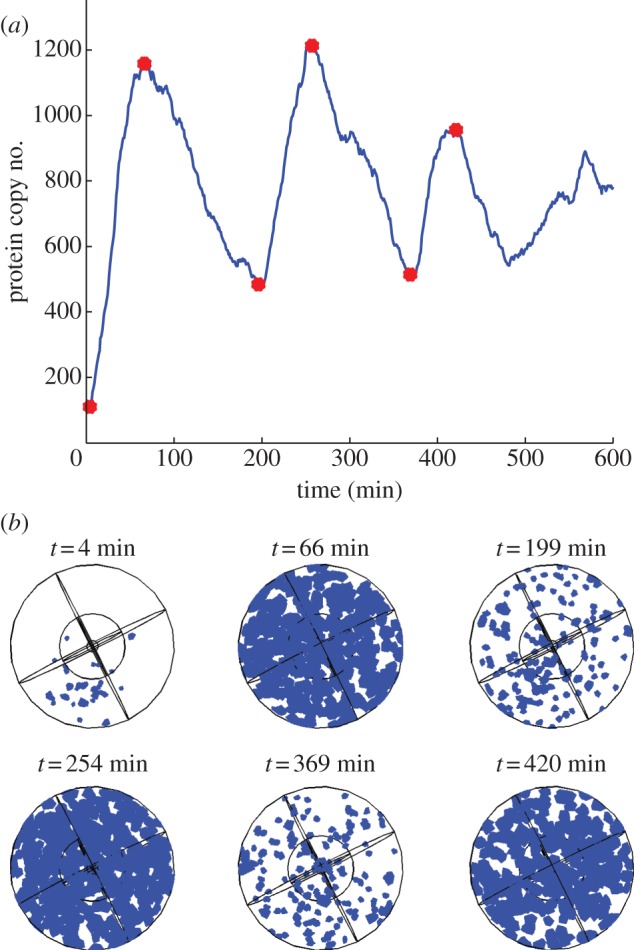
(a) Plot showing the total Hes1 protein copy number over a period of 600 min from a single trajectory of the Hes1 model (see table 1 of the main paper for parameter values), and (b) plots showing the corresponding spatial distributions of Hes1 protein. The times for these spatial snapshots were chosen to correspond to the peaks and troughs of oscillations in Hes1 protein copy number shown in (a) above. These times are highlighted by the red circles in (a). In (b) blue voxels indicate regions of the cell which contain Hes1 protein.
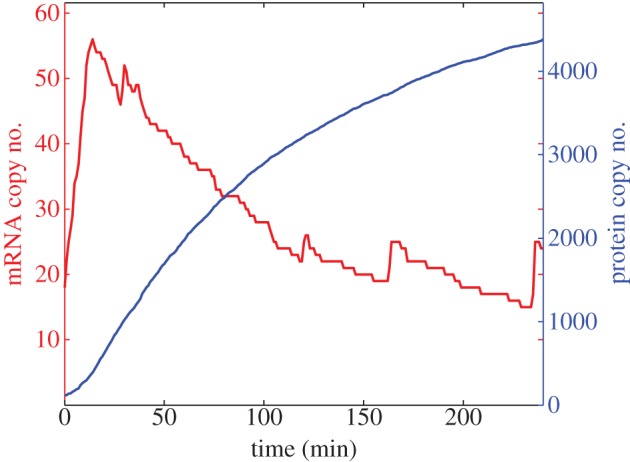
A single trajectory from a proteasome inhibition numerical experiment. The total numbers of hes1 mRNA (red) and Hes1 protein (blue) are plotted against time. Baseline parameter values are used, with the exception of μp which is reduced by a factor 100.
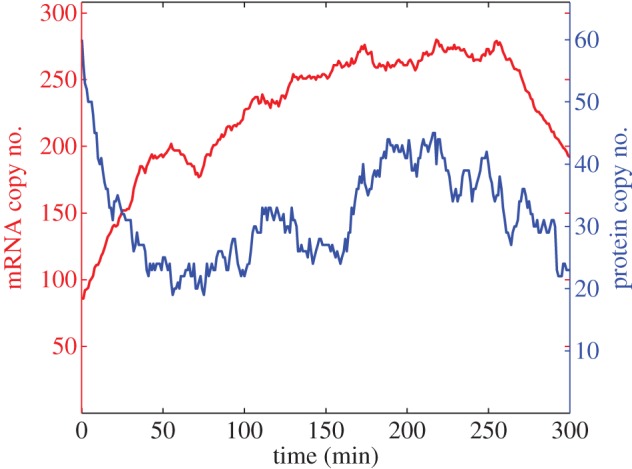
A single trajectory from a translation inhibition numerical experiment. The total numbers of hes1 mRNA (red) and Hes1 protein (blue) are plotted against time. Baseline parameter values are used with the exception of αp which is reduced by a factor 100.
Similar articles
-
The cyclic gene Hes1 contributes to diverse differentiation responses of embryonic stem cells.Genes Dev. 2009 Aug 15;23(16):1870-5. doi: 10.1101/gad.1823109. Genes Dev. 2009. PMID: 19684110 Free PMC article.
-
Integrative genomic analyses on HES/HEY family: Notch-independent HES1, HES3 transcription in undifferentiated ES cells, and Notch-dependent HES1, HES5, HEY1, HEY2, HEYL transcription in fetal tissues, adult tissues, or cancer.Int J Oncol. 2007 Aug;31(2):461-6. Int J Oncol. 2007. PMID: 17611704
-
Expression dynamics and functions of Hes factors in development and diseases.Curr Top Dev Biol. 2014;110:263-83. doi: 10.1016/B978-0-12-405943-6.00007-5. Curr Top Dev Biol. 2014. PMID: 25248479 Review.
-
Hes1 regulates embryonic stem cell differentiation by suppressing Notch signaling.Genes Cells. 2010 Jun;15(7):689-98. doi: 10.1111/j.1365-2443.2010.01413.x. Epub 2010 Jun 10. Genes Cells. 2010. PMID: 20545770 Free PMC article.
-
The roles and mechanism of ultradian oscillatory expression of the mouse Hes genes.Semin Cell Dev Biol. 2014 Oct;34:85-90. doi: 10.1016/j.semcdb.2014.04.038. Epub 2014 May 24. Semin Cell Dev Biol. 2014. PMID: 24865153 Review.
Cited by
-
Is the Cell Nucleus a Necessary Component in Precise Temporal Patterning?PLoS One. 2015 Jul 30;10(7):e0134239. doi: 10.1371/journal.pone.0134239. eCollection 2015. PLoS One. 2015. PMID: 26226505 Free PMC article.
-
The Linear Noise Approximation for Spatially Dependent Biochemical Networks.Bull Math Biol. 2019 Aug;81(8):2873-2901. doi: 10.1007/s11538-018-0428-0. Epub 2018 Apr 11. Bull Math Biol. 2019. PMID: 29644520 Free PMC article.
-
The role of dimerisation and nuclear transport in the Hes1 gene regulatory network.Bull Math Biol. 2014 Apr;76(4):766-98. doi: 10.1007/s11538-013-9842-5. Epub 2013 May 18. Bull Math Biol. 2014. PMID: 23686434 Free PMC article.
-
Smart computational exploration of stochastic gene regulatory network models using human-in-the-loop semi-supervised learning.Bioinformatics. 2019 Dec 15;35(24):5199-5206. doi: 10.1093/bioinformatics/btz420. Bioinformatics. 2019. PMID: 31141124 Free PMC article.
-
Systematic comparison of modeling fidelity levels and parameter inference settings applied to negative feedback gene regulation.PLoS Comput Biol. 2022 Dec 15;18(12):e1010683. doi: 10.1371/journal.pcbi.1010683. eCollection 2022 Dec. PLoS Comput Biol. 2022. PMID: 36520957 Free PMC article.
References
-
- Hirata H, Yoshiura S, Ohtsuka T, Bessho Y, Harada T, Yoshikawa K, Kageyama R. 2002. Oscillatory expression of the bHLH factor Hes1 regulated by a negative feedback loop. Science 298, 840–84310.1126/science.1074560 (doi:10.1126/science.1074560) - DOI - DOI - PubMed
-
- Geva-Zatorsky N, et al. 2006. Oscillations and variability in the p53 system. Mol. Syst. Biol. 2, E1–E1310.1038/msb4100068 (doi:10.1038/msb4100068) - DOI - DOI - PMC - PubMed
-
- Nelson DE, et al. 2004. Oscillations in NF-kB signaling control the dynamics of gene expression. Science 306, 704–70810.1126/science.1099962 (doi:10.1126/science.1099962) - DOI - DOI - PubMed
-
- Shankaran H, Ippolito DL, Chrisler WB, Resat H, Bollinger N, Opresko LK, Wiley HS. 2009. Rapid and sustained nuclear-cytoplasmic ERK oscillations induced by epidermal growth factor. Mol. Syst. Biol. 5, 332.10.1038/msb.2009.90 (doi:10.1038/msb.2009.90) - DOI - DOI - PMC - PubMed
-
- Sang L, Coller HA, Roberts JM. 2008. Control of the reversibility of cellular quiescence by the transcriptional repressor HES1. Science 321, 1095–110010.1126/science.1155998 (doi:10.1126/science.1155998) - DOI - DOI - PMC - PubMed
Publication types
MeSH terms
Substances
Grants and funding
LinkOut - more resources
Full Text Sources
Other Literature Sources
