. 2013 Feb;140(4):926-37.
doi: 10.1242/dev.086785. Epub 2013 Jan 16.

Notch cooperates with Lozenge/Runx to lock haemocytes into a differentiation programme

Affiliations

Notch cooperates with Lozenge/Runx to lock haemocytes into a differentiation programme

Ana Terriente-Felix et al. Development. 2013 Feb.

Abstract

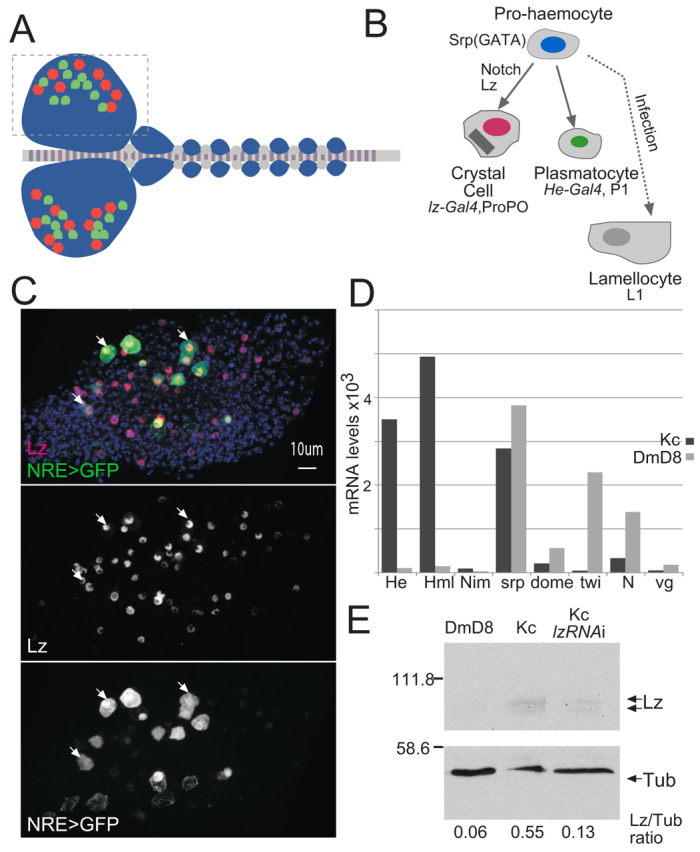
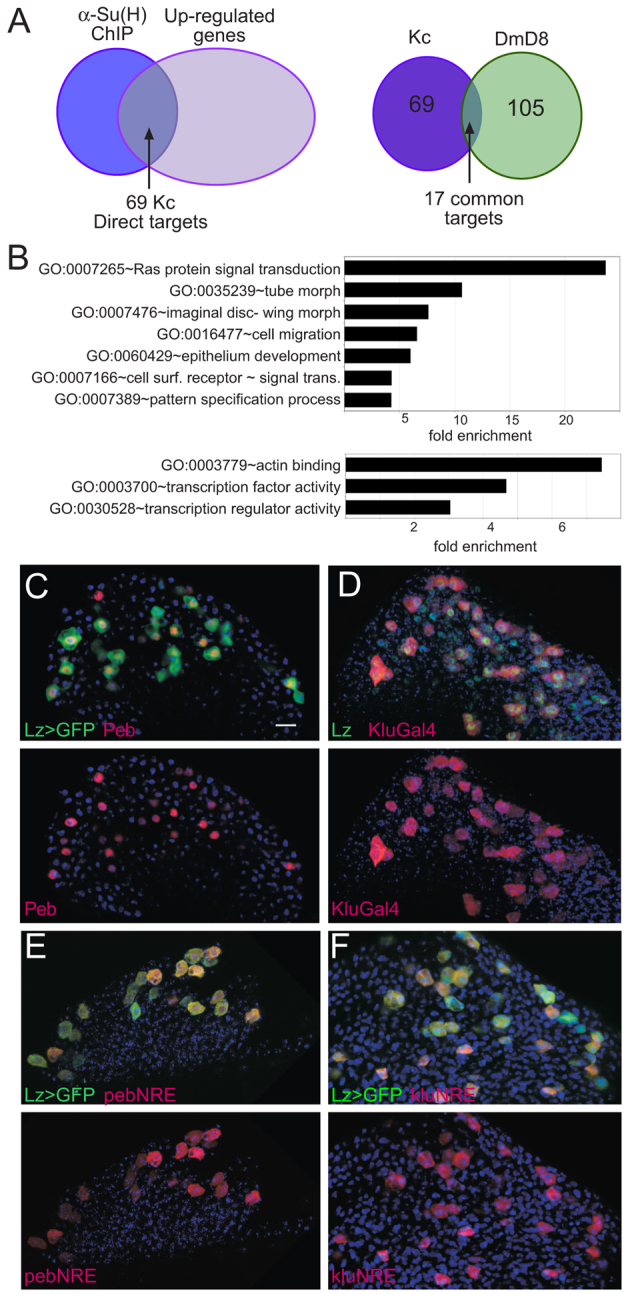
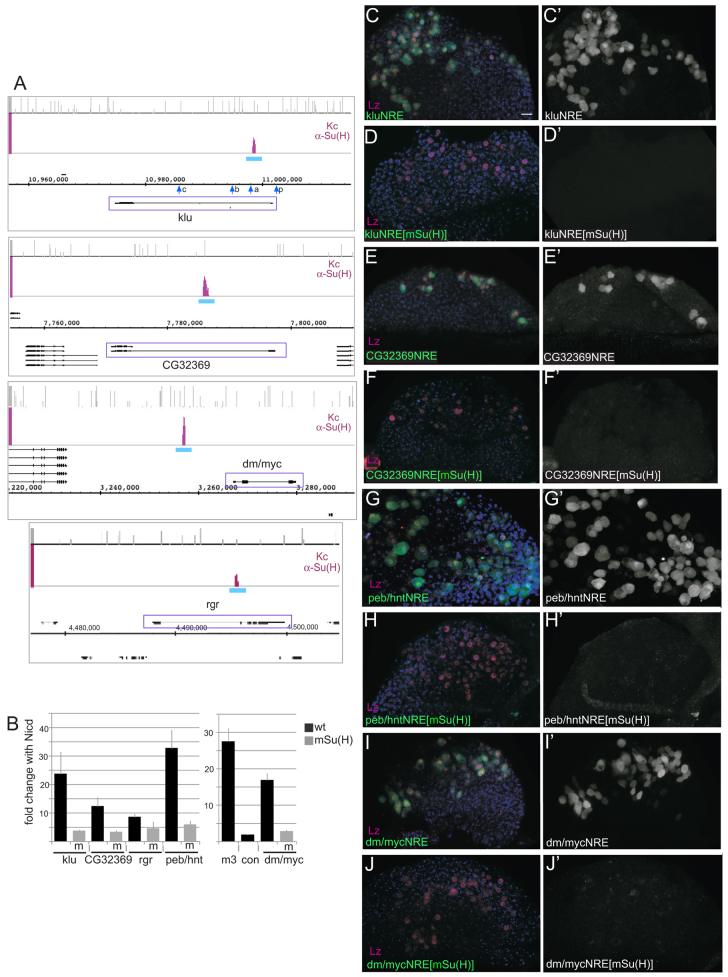
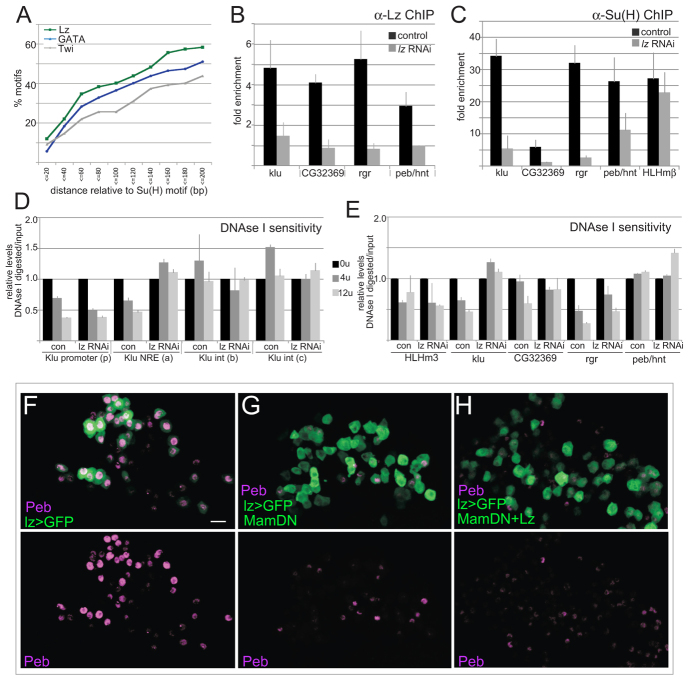
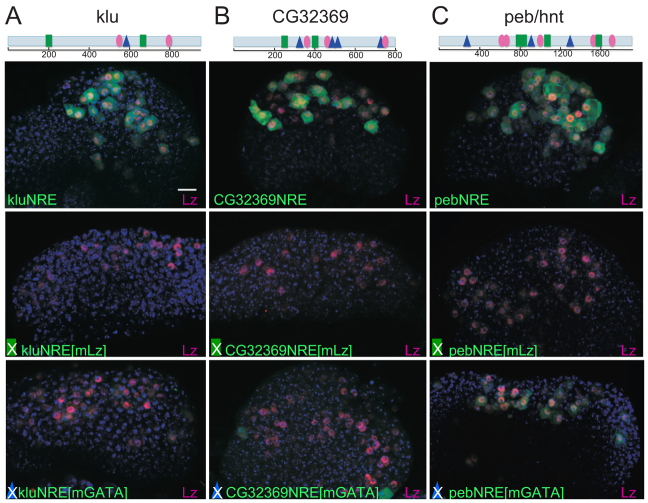
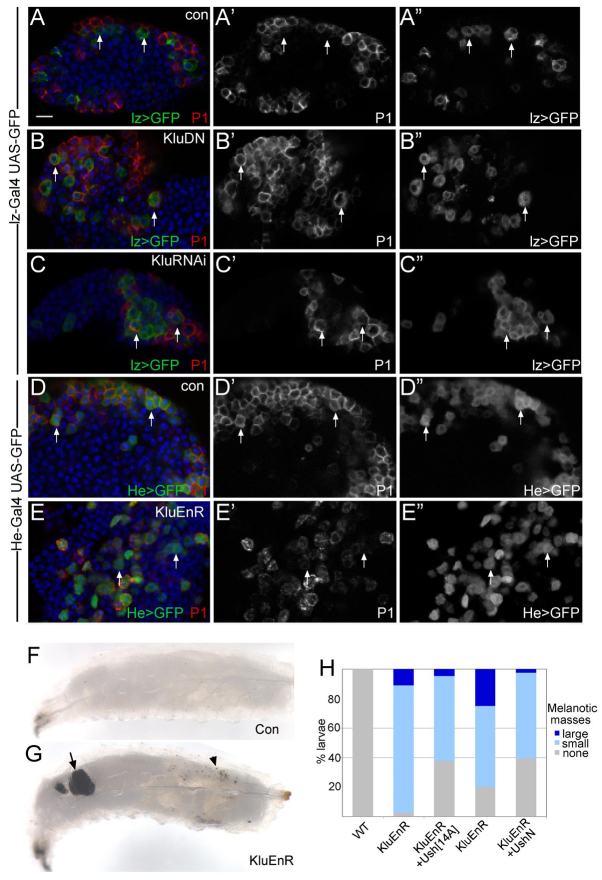
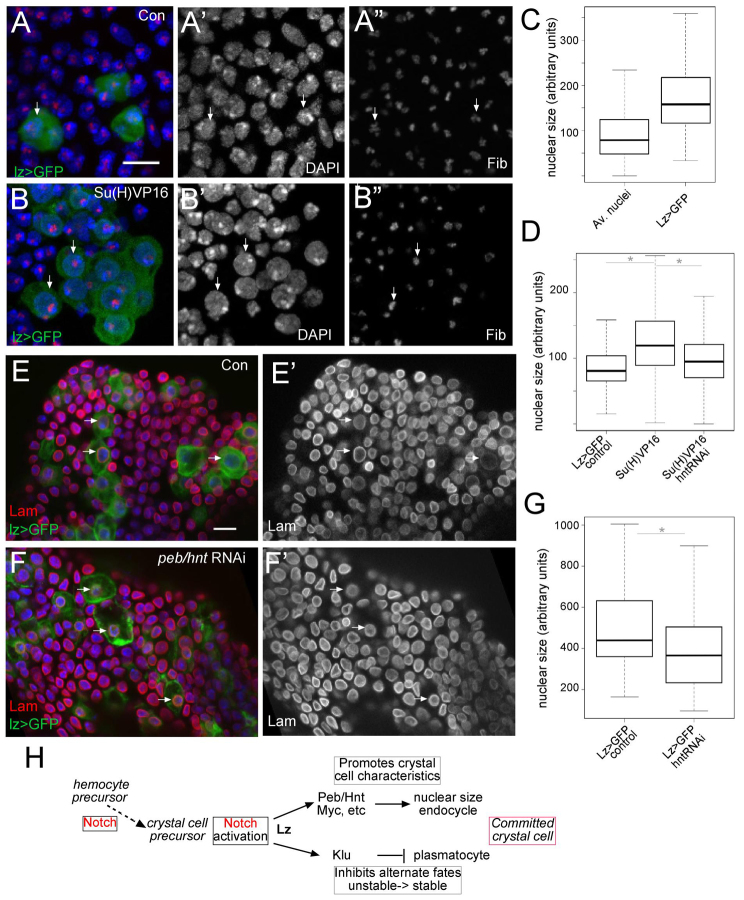
The diverse functions of Notch signalling imply that it must elicit context-specific programmes of gene expression. With the aim of investigating how Notch drives cells to differentiate, we have used a genome-wide approach to identify direct Notch targets in Drosophila haemocytes (blood cells), where Notch promotes crystal cell differentiation. Many of the identified Notch-regulated enhancers contain Runx and GATA motifs, and we demonstrate that binding of the Runx protein Lozenge (Lz) is required for enhancers to be competent to respond to Notch. Functional studies of targets, such as klumpfuss (ERG/WT1 family) and pebbled/hindsight (RREB1 homologue), show that Notch acts both to prevent the cells adopting alternate cell fates and to promote morphological characteristics associated with crystal cell differentiation. Inappropriate activity of Klumpfuss perturbs the differentiation programme, resulting in melanotic tumours. Thus, by acting as a master regulator, Lz directs Notch to activate selectively a combination of target genes that correctly locks cells into the differentiation programme.


Figures

Fig. 1.
Fig. 1.
Haemocyte development: role of Notch and relationship to Kc167 cells. (A) Drosophila lymph gland where larval haemocyte development gives rise to crystal cells (red) and plasmatocytes (green). Boxed area indicates the region shown in confocal images in this and subsequent figures. (B) The haemocyte lineage, specific markers and relevant Gal4 drivers are indicated. Notch and Lozenge (Lz) are required for crystal cells (red nuclei) to develop from Serpent (Srp)-expressing pro-haemocytes. (C) Expression of a general Notch-responsive reporter, NRE-GFP (green), indicates that Notch is active in Lz-expressing (red) crystal cell precursors. Arrows indicate examples of cells co-expressing Lz and NRE-GFP. (D) ModEncode measurements of relative mRNA expression levels of the indicated genes (He, hemese; Hml, hemolectin; Nim, Nimrod; srp, serpent; dome, domeless; twi, twist; N, Notch; vg, vestigial) in Kc167 cells compared with DmD8 (muscle precursor related) (Cherbas et al., 2011); haemocyte-related genes Hemolectin (Hml) and Hemese (He) are specifically expressed in Kc cells. (E) Lz is present in Kc167 cells; western blot of total cell extracts from the indicated cells was probed with α-Lz and α-Tub. The quantified ratio of Lz/Tub is indicated for each lane (arbitrary units). Cells pre-treated with dsRNA to ablate Lz (Kc LzRNAi) have reduced protein. Scale bar: 10 μm.
Fig. 2.
Fig. 2.
Identification of Notch targets in haemocytes. (A) Left: Venn diagram illustrating overlap between genes in proximity to Su(H)-bound regions [blue: anti-Su(H) ChIP, 185 bound regions] and upregulated after 30 minutes of Notch activation (mauve, 1302 upregulated transcripts) identifies 69 APGs that are putative direct Notch targets in Kc cells. Right: overlap between direct Notch targets identified in Kc cells (purple) and in DmD8 cells (green) is limited to 17 common genes. (B) Examples of over-represented GO (Biological Process, upper graph; Molecular Function, lower graph) categories in Kc direct Notch targets. (C-F) Expression of indicated targets and/or target enhancers in crystal cell lineage (marked by lz>GFP (C, E, F; green) and anti-Lz (D; green). See supplementary material Table S1 for a list of direct targets. Scale bar: 10 μm.
Fig. 3.
Fig. 3.
Notch-responsive enhancers direct expression in crystal cell lineage and require Su(H) motifs for activity. (A) Examples of genomic regions from representative Notch targets showing Su(H) ChIP-enriched regions in Kc cells (purple; fold enrichment relative to total input –0.1-2.5, log2 scale). Matches to the Su(H)-binding motif are indicated (bar height indicates affinity class of sites). Gene models are depicted in black. Blue bars represent the regions (NRE) that were cloned to test responsiveness in vivo (for distribution of motifs see Fig. 5). Blue arrows in klu indicate fragments analysed in DNase I sensitivity assays (see Fig. 4D). (B) Fold change in luciferase activity in the presence of the NICD from each unmutated NRE (wt) indicated and from NRE with mutated (m) Su(H) motifs. (C-J′) Expression from the indicated NRE, either unmutated (C,C′,E,E′,G,G′,I,I′) or where Su(H) motifs have been mutated [mSu(H)] (D,D′,F,F′,H,H′,J,J′). Levels of enhancer activity are detected by fluorescence (GFP or mCherry, green, C-J; single channel, white, C′-J′) in crystal cell precursors marked by expression of Lz (red, C-J). See supplementary material Fig. S1 for additional NRE expression. Scale bar: 10 μm.
Fig. 4.
Fig. 4.
Lz influences Su(H) recruitment at Notch-responsive enhancers and is required with Notch in vivo. (A) Lz and GATA motifs are located in proximity to Su(H). Graph showing percentage of detected motifs located within the indicated distance (bp) of the Su(H) motif within Kc ChIP peaks (blue, GATA; green, Lz; grey, Twist). (B) Lz is present at NREs. Fold enrichment of the indicated NRE in α-Lz ChIP relative to the adjacent coding sequence (cds) in Kc cells (dark shading) and after lz RNAi (light shading). (C) Depletion of Lz compromises Su(H) binding. Fold enrichment of the indicated NRE in anti-Su(H) ChIP relative to the cds in Kc cells (dark shading) and after lz RNAi (light shading). (D,E) Effects of Lz depletion on DNase I sensitivity of the indicated regions in klu (D) and of NRE from other genes (E). Chromatin from control and Lz RNAi-treated cells was subjected to digestion with 0, 4 or 12 U of DNase I and the levels of intact DNA quantified by qPCR. Location of klu fragments are indicated in Fig. 3A. (F-H) Peb/Hnt expression in control glands (F, lz >GFP) and in glands where MamDN only (G) or Lz and MamDN (H) were expressed (lz>GFP indicates lz-Gal4 UAS-GFP). Scale bar: 10 μm. Data are mean±s.e.m.
Fig. 5.
Fig. 5.
Notch-responsive enhancers require Lz and Srp sites for full activity. (A-C) Consequences on indicated NRE activity of mutating Lz (mLz) or GATA (mGATA) motifs. Expression of the resulting GFP reporters (green) in crystal cell lineage (α-Lz, purple). Diagrams above depict the location of the Lz-(green rectangles) and GATA (blue triangles)-binding motifs within each enhancer relative to Su(H) motifs (pink ovals). Scale bar: 10 μm.
Fig. 6.
Fig. 6.
Regulation of klu by Notch blocks plasmatocyte fates. (A-A″) Expression of the plasmatocye marker P1 (red, A; white, A′) does not overlap with Lz (lz>GFP, green in A; white in A″) in wild-type glands (arrows). (B-C″) P1 is detected in Lz cells that express KluDN (B-B″, e.g. arrows) or kluRNAi (C-C″, arrows), labelled as in A. (D-D″) Expression of P1 is detected in all He-Gal4-expressing cells (He-Gal4 UAS-nlsGFP, He>GFP) in control glands (arrows). (E-E″) Expression of KluEnR compromises P1 expression in many of the He>GFP cells (arrows). (F,G) Expression of KluEnR leads to melanotic masses, (F) wild-type larvae, (G) KluEnR-expressing larvae with both large (arrows) and small (arrowhead) small masses. (H) Larvae were scored for melanotic masses (large, larvae had at least one large mass; small, larvae had only small dots of melanin). Co-expression of Ush reduces the percentage of KluEnR larvae that exhibit melanotic masses. Over 80 larvae were scored for each genotype. See supplementary material Fig. S6 for Lz expression in KluEnR. Scale bar: 10 μm.
Fig. 7.
Fig. 7.
Notch regulates nuclear size via Hnt. (A-B″) Crystal cell lineage marked by lz>GFP (green, e.g. arrows) in control (A) and Su(H)VP16-expressing (B) lymph gland stained to detect DNA (DAPI, blue, single channel A′,B′) and nucleolus (Fibrillarin, red, single channel A″,B″). Expression of Su(H)VP16 results in enlarged nuclei (compare arrows). (C) Size of nuclei based on DAPI staining in lz>GFP-expressing lymph glands, GFP-expressing nuclei (crystal cell lineage) are larger than average (P=3.331e-14, 15 LG, 75 Lz+ cells and 1833 non Lz+ cells). Box and whisker plot. Horizontal line indicates median, box indicates interquartile range (IQR), and whiskers indicate maximum and minimun within 1.5 IQR. (D) The measurable increase in nuclei (DAPI) size obtained by expressing Su(H)VP16 (with lz-Gal4) is suppressed by co-expressing RNAi targeting peb/hnt or myc. RNAi targeting white was used as control (nuclear size in C,D was calculated by measuring the diameter/volume of DAPI staining; 15 LG, 732 cells for Lz>+; 11 LG, 1325 cells for LzG4>Su(H)VP16+whiteRNAi; 17 LG, 527 cells for LzG4>Su(H)VP16+hntRNAi). Asterisk indicates that results were significantly different, P<2.2e-16, using used two-sample Kolmogorov-Smirnov test. Numbers are arbitrary units that differ between experiments owing to the method used to obtain images. Box and whisker plot as in C. (E-F″) Nuclear diameters (nuclear Lamin, red E,F; single channel E′,F′) in large lz>GFP crystal cells from control (E, whiteRNAi; F, peb/hntRNAi). (G) Knockdown of peb/hnt leads to a reduction in nuclear diameter. Asterisk indicates that results were significantly different, P=0.004799, using used two-sample Kolmogorov-Smirnov test (11 LG per genotype, 60 Lz+ cells for controls and 47 Lz+ cells for hntNRAi). Box and whisker plot as in C. (H) The proposed role of Notch acting in combination with Lz in the crystal cell lineage. Notch activity is also required at earlier stages in haemocyte development, where the target genes are likely to differ, as it will operate in a different context. Scale bar: 10 μm.

Similar articles

Cited by

References

    1. Alberta J. A., Springett G. M., Rayburn H., Natoli T. A., Loring J., Kreidberg J. A., Housman D. (2003). Role of the WT1 tumor suppressor in murine hematopoiesis. Blood 101, 2570-2574 - PubMed
    1. Benmimoun B., Polesello C., Waltzer L., Haenlin M. (2012). Dual role for Insulin/TOR signaling in the control of hematopoietic progenitor maintenance in Drosophila. Development 139, 1713-1717 - PubMed
    1. Bernard F., Krejci A., Housden B., Adryan B., Bray S. J. (2010). Specificity of Notch pathway activation: twist controls the transcriptional output in adult muscle progenitors. Development 137, 2633-2642 - PMC - PubMed
    1. Bieda M., Xu X., Singer M. A., Green R., Farnham P. J. (2006). Unbiased location analysis of E2F1-binding sites suggests a widespread role for E2F1 in the human genome. Genome Res. 16, 595-605 - PMC - PubMed
    1. Bray S. J. (1997). Expression and function of Enhancer of split bHLH proteins during Drosophila neurogenesis. Perspect. Dev. Neurobiol. 4, 313-323 - PubMed

Publication types