. 2013 Feb;140(4):897-905.
doi: 10.1242/dev.080192. Epub 2013 Jan 16.

The microRNA miR-7 regulates Tramtrack69 in a developmental switch in Drosophila follicle cells

Affiliations

The microRNA miR-7 regulates Tramtrack69 in a developmental switch in Drosophila follicle cells

Yi-Chun Huang et al. Development. 2013 Feb.

Abstract

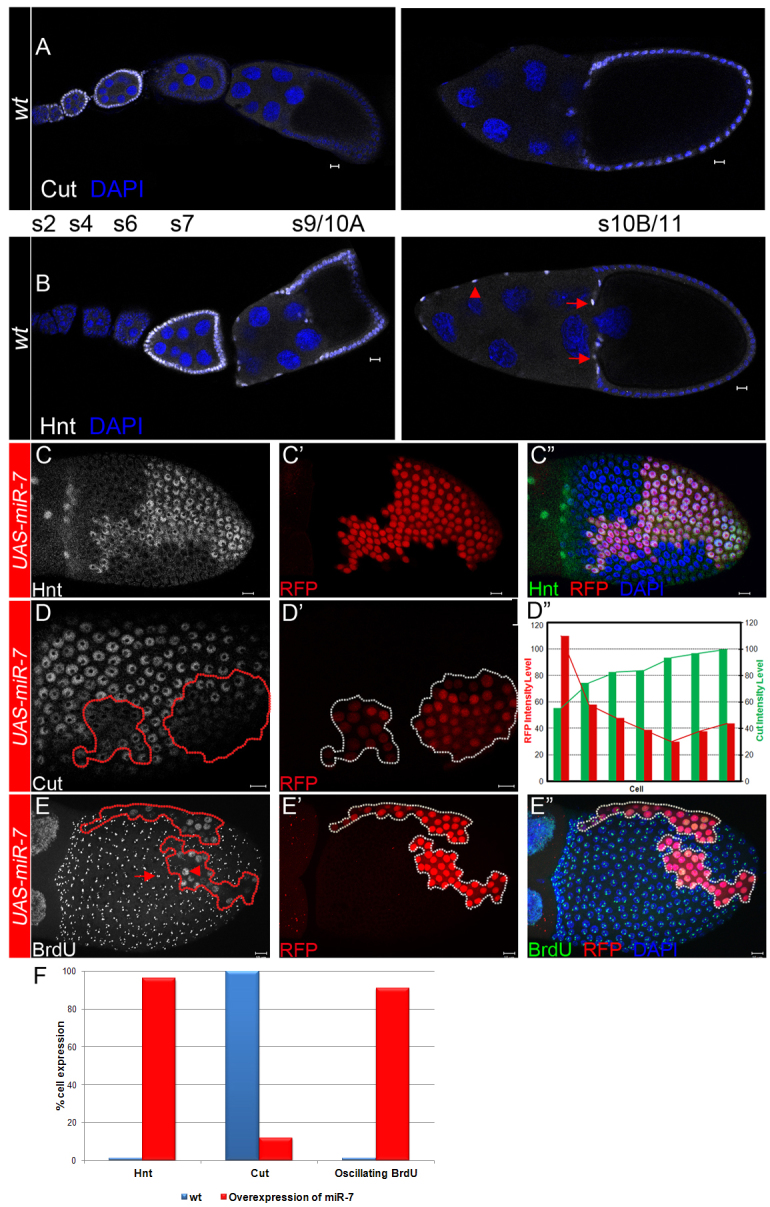
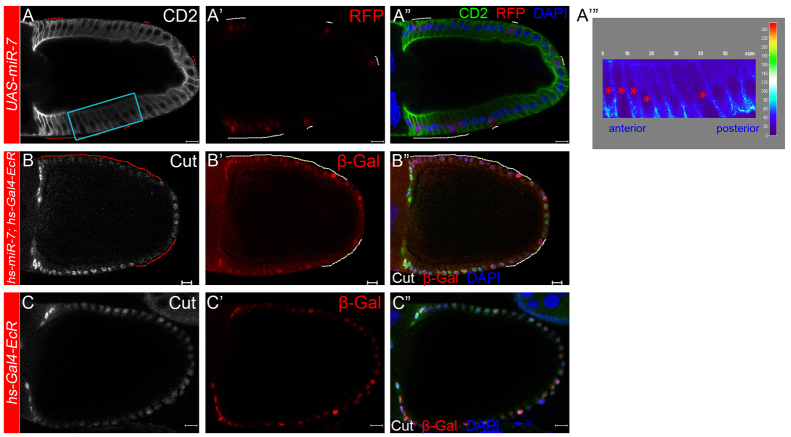
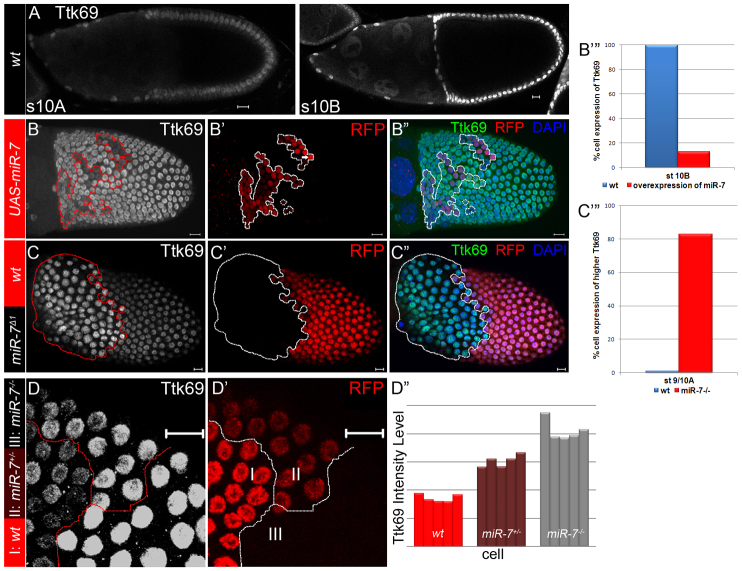
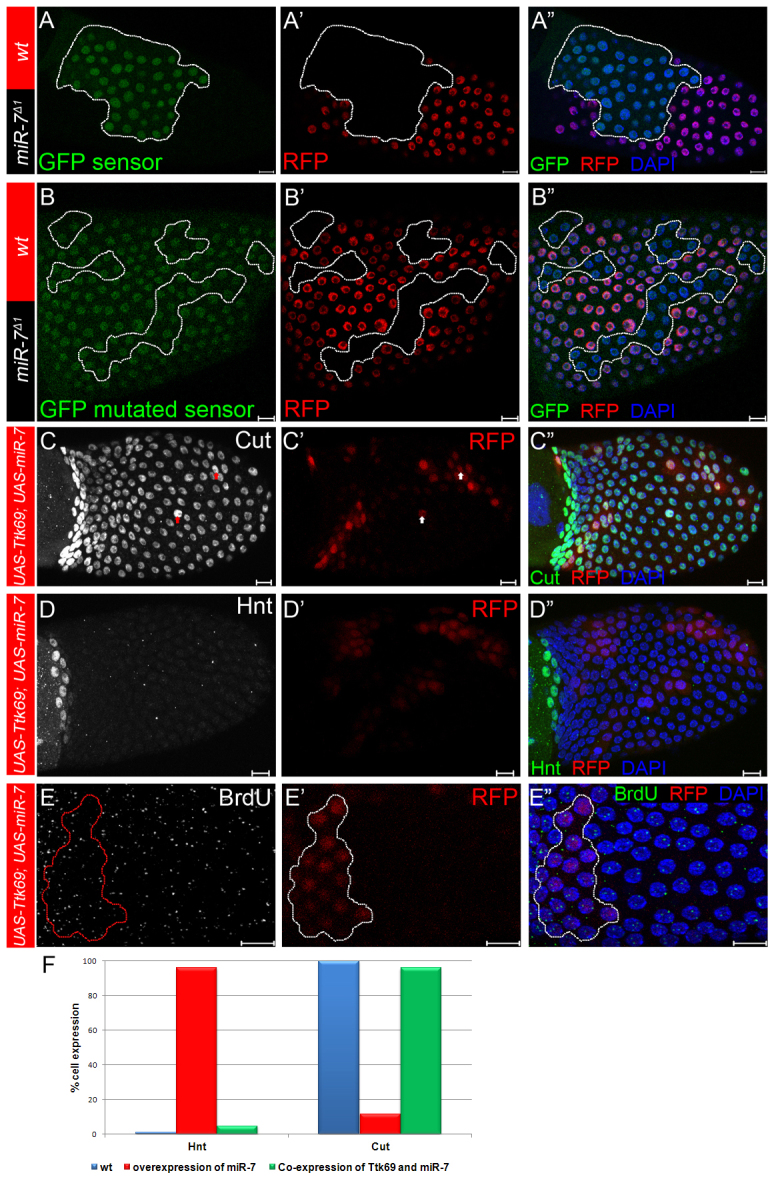
Development in multicellular organisms includes both small incremental changes and major switches of cell differentiation and proliferation status. During Drosophila oogenesis, the follicular epithelial cells undergo two major developmental switches that cause global changes in the cell-cycle program. One, the switch from the endoreplication cycle to a gene-amplification phase, during which special genomic regions undergo repeated site-specific replication, is attributed to Notch downregulation, ecdysone signaling activation and upregulation of the zinc-finger protein Tramtrack69 (Ttk69). Here, we report that the microRNA miR-7 exerts an additional layer of regulation in this developmental switch by regulating Ttk69 transcripts. miR-7 recognizes the 3' UTR of ttk69 transcripts and regulates Ttk69 expression in a dose-dependent manner. Overexpression of miR-7 effectively blocks the switch from the endocycle to gene amplification through its regulation of ttk69. miR-7 and Ttk69 also coordinate other cell differentiation events, such as vitelline membrane protein expression, that lead to the formation of the mature egg. Our studies reveal the important role miR-7 plays in developmental decision-making in association with signal-transduction pathways.


Figures

Fig. 1.
Fig. 1.
Overexpression of miR-7 causes a defect in the E/A switch in follicle cells. (A) Expression of Cut by follicle cells in early-stage egg chambers (s1-s6). At stage 7, Notch is activated, and therefore no Cut expression is observed; these stages are called the middle stage (s7-s10A). Once Notch is downregulated at stage 10B, Cut staining reappears. (B) By contrast, Hnt is present only at the middle stages, when Notch is activated. At stage 10B, Hnt expression is limited to the anterior follicle cells (arrows, centripetal cells; arrowhead, stretch cells). (C-E″) In stage 10B egg chambers, follicle cells (red) with miR-7 overexpression (induced by Flp-out Gal4) are outlined with dotted lines. (C-C″) Prolonged Hnt staining (98%, n=257) was observed in cells overexpressing miR-7. (D,D′) Cells with overexpressed miR-7 failed to induce late-stage Cut expression (87%, n=186). (D″) Signaling intensity analysis of RFP and Cut expression in D. RFP intensity (y-axis, left) is negatively correlated with Cut expression intensity (y-axis, right) in miR-7-overexpressing cells (x-axis). (E-E″) Oscillating genomic BrdU incorporation (indicated by an arrowhead) was found in miR-7-overexpressing follicle cells (outlined). Neighboring wild-type cells all showed a punctate pattern (red arrow). (F) Quantitative analysis of Hut, Cut and BrdU, respectively, in stage 10B cells with overexpressed miR-7. DAPI (blue) was used to mark cell nuclei. Posterior is towards the right. Scale bars: 10 μm.
Fig. 2.
Fig. 2.
miR-7 does not regulate Notch or ecdysone signaling during the E/A switch. (A-A‴) Notch activation is marked with E(Spl)-CD2 expression. No increased CD2 staining (white in A and green in A″) was observed in stage 10B follicle cells with overexpressed miR-7 (red in A′ and A″). (A‴) Intensity analysis representing the CD2 expression level of the blue-boxed area in A (clone cells marked with asterisks). (Plot was generated using ImageJ v1.46j interactive 3D surface plot.) miR-7 overexpression was induced by flip-out Gal4 driven UAS-miR-7, and marked with β-Galactosidase expression (red) (B-B″) Follicle cells with heat shock-induced overexpression of miR-7 (hs-miR-7) were revealed by Cut downregulation (white in B, outlined). In this stage 10B egg chamber, no clear difference was detected between miR-7-overexprssing cells and neighboring wild-type cells in ecdysone signaling activity, as revealed by β-Galactosidase staining (red in B′ and B″) of the hs-Gal4-EcR; UAS-LZ reporter. (C-C″) In a control experiment without hs-miR-7, the patched β-Galactosidase staining (red in C′ and C″) did not have any effect on the Cut expression (C). DAPI (blue) was used to mark cell nuclei. Posterior is towards the right. Scale bars: 10 μm.
Fig. 3.
Fig. 3.
Regulation of Ttk69 expression by miR-7. (A) Expression of Ttk69 at low levels during oogenesis through stage 10A. At stage 10B, Ttk69 is upregulated in the main-body follicle cells. (B-B″) Collapsed images of the z-stacks. Lower Ttk69 expression in cells overexpressing miR-7 (red) than in wild-type neighbors. Arrow indicates brighter RFP, i.e. a higher amount of miR-7 was expressed and stronger repression of Ttk69. (B‴) Quantitative analysis of Ttk69 levels in stage 10B cells with overexpressed miR-7. (C-C″) FLP/FRT miR-7Δ1 clone cells (outlined, absence of red), revealing earlier Ttk69 upregulation than in adjacent cells. (C‴) Quantitative results of higher Ttk69 expression at stage 9/10A miR-7–/– clone cells. (D,D′) Higher magnification and collapsed images of the z-stacks. The Ttk69 signaling level depends on miR-7 dose. The homozygous RFP follicle cells (area I) had the lowest Ttk69 staining, whereas homozygous mutant miR-7Δ1 clones showed the highest Ttk69 expression (absence of red, area III). (D″) Intensity analysis of Ttk69 expression levels (y-axis) in D. Five cells were randomly selected from each of the three areas marked in D′ and grouped together. DAPI (blue) was used to mark cell nuclei. Posterior is towards the right. Scale bars: 10 μm.
Fig. 4.
Fig. 4.
Direct regulation of Ttk69 by miR-7. (A-B″) miR-7Δ1 clone cells (absence of red, outlined). (A-A″) Strong GFP signal from the ttk69 3′UTR sensor line in clone cells; GFP was absent in wild-type neighbor cells. (B-B″) GFP from the mutated 3′UTR sensor line was expressed in both the miR-7Δ1 clone (outlined) and wild-type follicle cells. (C-C″) Overexpression of Ttk69 rescued the decreased Cut caused by overexpression of miR-7 (compare with Fig. 1D-D″); we occasionally observed higher Cut levels in these cells (arrows). (D-D″) Lack of prolonged Hnt staining in the co-expression of Ttk69 and miR-7 cells. (E-E″) Punctate BrdU labeling was restored when Ttk69 was co-expressed with miR-7 (outlined). (F) Quantification of extra Ttk69 expression needed to rescue the Hnt and Cut phenotypes in stage 10B cells with overexpressed miR-7. DAPI (blue) was used to mark cell nuclei. Posterior is towards the right. Scale bars: 10 μm.
Fig. 5.
Fig. 5.
Loss of miR-7 is not sufficient to activate premature E/A switch. (A-A″) Oscillating genomic BrdU incorporation (arrows) can be observed in miR-7Δ1 follicle-cell clones (absence of red) and in wild-type cells. DAPI (blue) was used to mark cell nuclei. Posterior is towards the right. Scale bars: 10 μm.
Fig. 6.
Fig. 6.
Regulation of VM32E expression by miR-7. (A) Lack of expression of VM32E, the vitelline membrane gene, in early oogenesis. Low levels of VM32E (green) are expressed in late stage 9 egg chambers, and VM32E is then diffused into the extracellular space around the oocyte at stage 10. Centripetal cells (arrows) and posterior follicle cells (arrowhead) do not express VM32E. (B-B″) Suppression of VM32E by miR-7 overexpression (red, outlined). (C-C″) Mutant miR-7Δ1 clones (absence of RFP, outlined) induced early upregulation of VM32E in stage 9 egg chambers and higher VM32E levels in late stage egg chambers relative to wild-type cells (RFP positive). (D-D″) Sectional and surface views of follicular epithelia with mild upregulation of VM32E in cells overexpressing Ttk69 (red, outlined). (E-E″) Decreased VM32E levels in ttk1e11 clone cells (absence of red, outlined). DAPI (blue) was used to mark cell nuclei. Posterior is towards the right. (B,E) Collapsed confocal-image stacks of two stage 10B egg chambers; the sectional images used to project these two collapsed images are shown in supplementary material Figs S3 and S5, respectively. Scale bars: 10 μm.
Fig. 7.
Fig. 7.
miR-7 regulates VM32E through Ttk69. (A-A″) Reduced VM32E (white in A and green in A″) expression was detected in miR-7Δ1 MARCM clones (outlined and marked by RFP, red) with ttk69-RNAi expression in this stage 11 egg chamber (top, sectional views; bottom, surface views). Posterior is towards the right. DAPI (blue) was used to mark cell nuclei in A″. Scale bars: 10 μm.

Similar articles

Cited by

References

    1. Assa-Kunik E., Torres I. L., Schejter E. D., Johnston D. S., Shilo B. Z. (2007). Drosophila follicle cells are patterned by multiple levels of Notch signaling and antagonism between the Notch and JAK/STAT pathways. Development 134, 1161-1169 - PubMed
    1. Berezikov E., Robine N., Samsonova A., Westholm J. O., Naqvi A., Hung J. H., Okamura K., Dai Q., Bortolamiol-Becet D., Martin R., et al. (2011). Deep annotation of Drosophila melanogaster microRNAs yields insights into their processing, modification, and emergence. Genome Res. 21, 203-215 - PMC - PubMed
    1. Bernardi F., Romani P., Tzertzinis G., Gargiulo G., Cavaliere V. (2009). EcR-B1 and Usp nuclear hormone receptors regulate expression of the VM32E eggshell gene during Drosophila oogenesis. Dev. Biol. 328, 541-551 - PubMed
    1. Betel D., Wilson M., Gabow A., Marks D. S., Sander C. (2008). The microRNA.org resource: targets and expression. Nucleic Acids Res. 36, D149-D153 - PMC - PubMed
    1. Boyle M. J., Berg C. A. (2009). Control in time and space: Tramtrack69 cooperates with Notch and Ecdysone to repress ectopic fate and shape changes during Drosophila egg chamber maturation. Development 136, 4187-4197 - PMC - PubMed

Publication types

MeSH terms

LinkOut - more resources