. 2013 Mar;24(6):848-57.
doi: 10.1091/mbc.E12-08-0597. Epub 2013 Jan 16.

cAMP-stimulated phosphorylation of diaphanous 1 regulates protein stability and interaction with binding partners in adrenocortical cells

Affiliations

cAMP-stimulated phosphorylation of diaphanous 1 regulates protein stability and interaction with binding partners in adrenocortical cells

Donghui Li et al. Mol Biol Cell. 2013 Mar.

Abstract

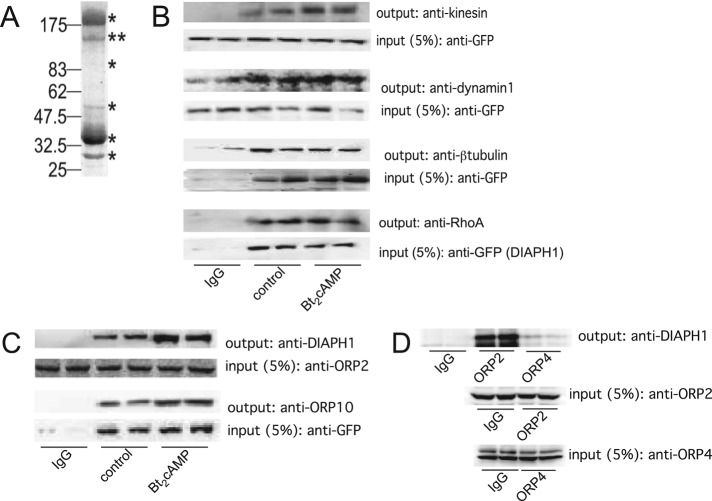
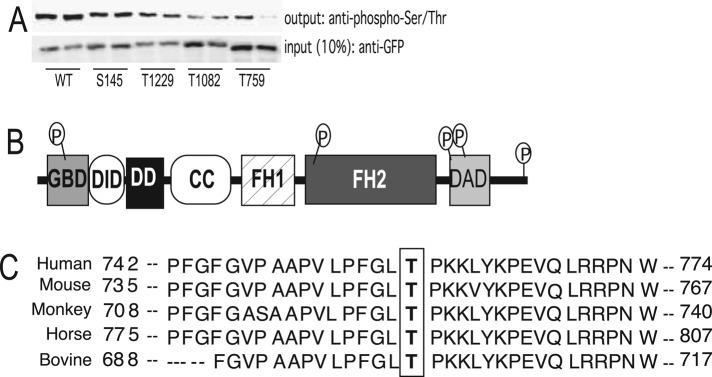
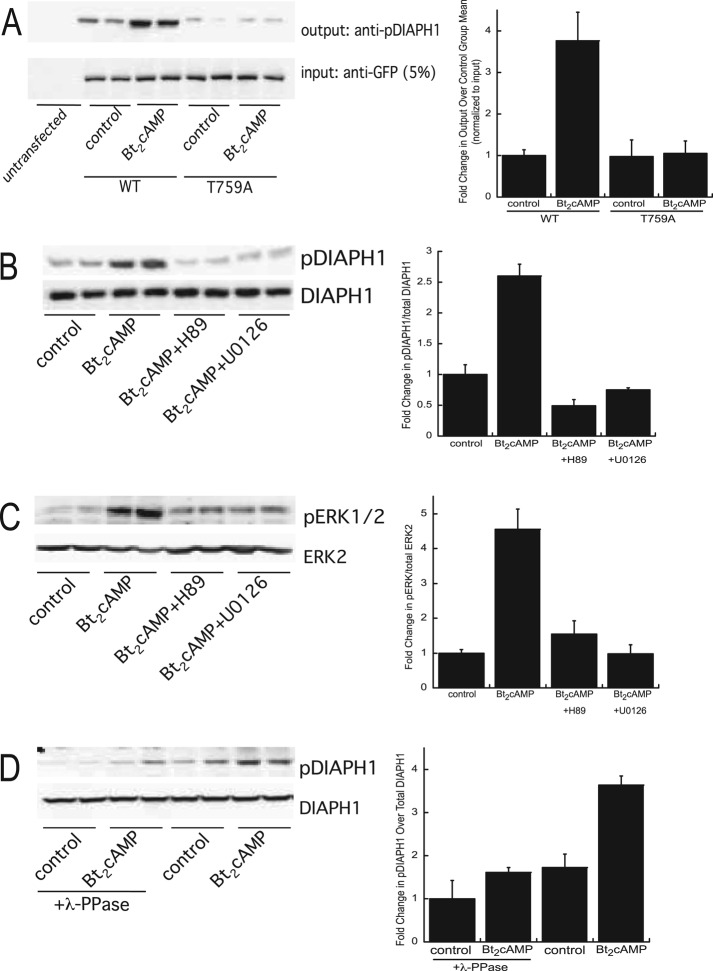
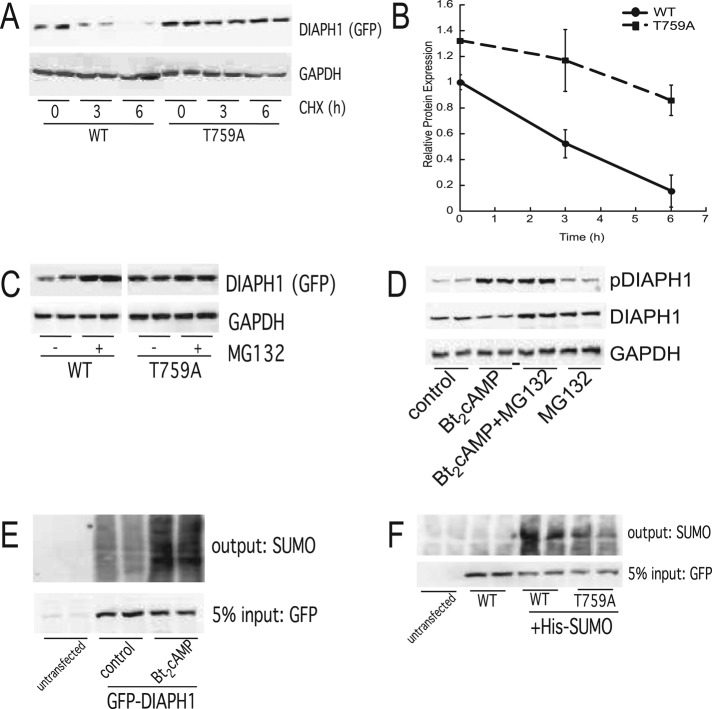
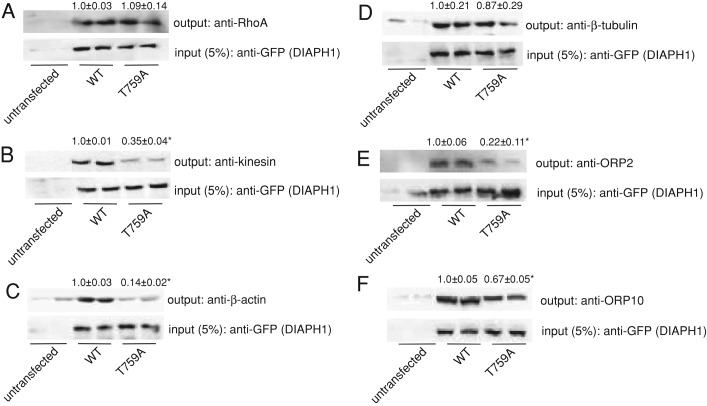
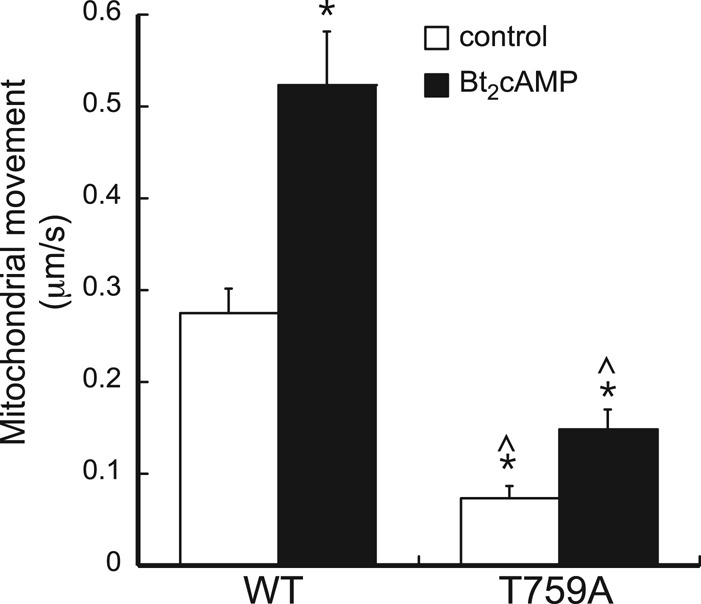
Diaphanous homologue 1 (DIAPH1) is a Rho effector protein that coordinates cellular dynamics by regulating microfilament and microtubule function. We previously showed that DIAPH1 plays an integral role in regulating the production of cortisol by controlling the rate of mitochondrial movement, by which activation of the adrenocorticotropin (ACTH)/cAMP signaling pathway stimulates mitochondrial trafficking and promotes the interaction between RhoA and DIAPH1. In the present study we use mass spectrometry to identify DIAPH1 binding partners and find that DIAPH1 interacts with several proteins, including RhoA, dynamin-1, kinesin, β-tubulin, β-actin, oxysterol-binding protein (OSBP)-related protein 2 (ORP2), and ORP10. Moreover, DIAPH1 is phosphorylated in response to dibutyryl cAMP (Bt2cAMP) at Thr-759 via a pathway that requires extracellular signal-related kinase (ERK). Alanine substitution of Thr-759 renders DIAPH1 more stable and attenuates the interaction between DIAPH1 and kinesin, ORP2, and actin but has no effect on the ability of the protein to interact with RhoA or β-tubulin. Finally, overexpression of a DIAPH1 T759A mutant significantly decreases the rate of Bt2cAMP-stimulated mitochondrial movement. Taken together, our findings establish a key role for phosphorylation in regulating the stability and function of DIAPH1.


Figures

FIGURE 1:
FIGURE 1:
(A) Representative gel of H295R cell lysates that were immunoprecipitated using an anti-DIAPH1 antibody and subjected to SDS–PAGE and Coomassie staining. Immunoprecipitation and mass spectrometric analysis was performed on three separate occasions. Asterisks denote bands that were excised for mass spectrometry. (B) GFP-tagged or endogenous DIAPH1 was immunoprecipitated from control or Bt2cAMP-treated (0.4 mM, 30 min) samples and the immobilized proteins were washed, separated by SDS–PAGE, and analyzed by Western blotting using antibodies against kinesin (heavy chain), dynamin-1, β-tubulin, RhoA, or vimentin. Five percent of inputs were subjected to SDS–PAGE and Western blotting using an anti-GFP antibody. Blots shown are representative, and each immunoprecipitation was performed on at least three separate occasions, each time in duplicate. (C) Lysates from control or Bt2cAMP-treated H295R cells were immunoprecipitated using an anti-OPR2 antibody (input; second from top), and protein A/G agarose or H295R cells were transfected with pEGFP-DIAPH1 and control or Bt2cAMP-stimulated lysates immunoprecipitated using an anti-GFP antibody and protein A/G agarose (input; bottom). Immobilized proteins were washed, separated by SDS–PAGE, and analyzed by Western blotting using antibodies against DIAPH1 (output; top) or ORP10 (output, second from bottom). Immunoprecipitations were carried out three times, each time in duplicate. (D) H295R cells were plated onto 100-mm dishes and the lysates immunoprecipitated with 5 μg of rabbit IgG, anti-ORP2, or ORP4 and the purified proteins separated by SDS–PAGE. Western blotting was performed on 5% of the inputs for ORP2 (middle) or ORP4 (bottom) and the outputs for DIAPH1 (top). Shown are representative blots for studies that were carried out on three separate occasions, each time in duplicate.
FIGURE 2:
FIGURE 2:
(A) H295R cells were transfected with WT or phosphomutant pEGFP-DIAPH1 and lysates immunoprecipitated using an anti-GFP antibody and protein A/G agarose. Immobilized proteins were subjected to SDS–PAGE, followed by Western blotting using an anti–phospho-Ser/Thr antibody. Ten percent of inputs were subjected to SDS–PAGE and Western blotting using an anti-GFP antibody. Densitometric analysis of phosphor-Ser/Thr and GFP expression is expressed as fold change compared with wild type, and data represent mean ± SD of four experiments, each performed in duplicate. (B) Location of the putative phosphorylation sites on the primary structure of DIAPH1. (C) T-Coffee sequence alignment of DIAPH1, highlighting the position of a conserved threonine residue (T759 in humans) across different species.
FIGURE 3:
FIGURE 3:
(A) H295R cells were transfected with WT or T759A-mutant pEGFP-DIAPH1 and treated for 30 min with 0.4 mM Bt2cAMP, and lysates were immunoprecipitated using an anti-GFP antibody and protein A/G agarose. Immobilized proteins were washed, separated by SDS–PAGE, and analyzed by Western blotting using an anti–phospho(T759)-DIAPH1 antibody. Five percent of inputs were subjected to SDS–PAGE and Western blotting using an anti-GFP antibody. Left, representative blots; right, densitometric analysis. Graph data represent mean ± SD of three experiments, each in duplicate. (B) H295R cells were pretreated with 10 μM H89 or 10 μM U0126 and then treated with 0.4 mM Bt2cAMP for 30 min. Cell lysates were harvested and separated by SDS–PAGE, followed by Western blotting using anti–phospho(T769)-DIAPH1or anti-DIAPH1 antibodies. Left, representative blots; right, densitometric analysis. Graph data represent the mean ± SD of five experiments, each in duplicate. (C) H295R cells were pretreated with H89 or U0126 and then treated with Bt2cAMP. Cell lysates were harvested and separated by SDS–PAGE, followed by Western blotting using anti–phospho-ERK1/2 or anti-ERK2 antibodies. Left, representative blots; right, densitometric analysis. Graph data represent mean ± SD of five experiments, each in duplicate. (D) Lysates isolated from control or Bt2cAMP-treated cells were incubated with λ-phosphatase and then subjected to SDS–PAGE and Western blotting for pDIAPH1 or DIAPH1. Left, representative blots; right, densitometric analysis. Graph data represent the mean ± SD of two experiments, each in duplicate. In all graphs, asterisks denote statistical significance (p < 0.05) compared with untreated control.
FIGURE 4:
FIGURE 4:
(A) H295R cells were transfected with WT or T759A-mutant pEGFP-DIAPH1 and treated with 50 μg/ml CHX for 3 or 6 h. Cell lysates were harvested and separated by SDS–PAGE, followed by Western blotting using anti-GFP and anti-GAPDH antibodies. (B) Graphical analysis of data obtained from Western blotting studies of WT and phospho(T579) DIAPH1 protein expression in cells treated with 50 μg/ml CHX for 0–6 h. Data represent mean ± SEM of four separate experiments, each carried out in duplicate. Asterisks and carats denote statistically different (p < 0.05) from WT 0-h and T759A 0-h groups, respectively. (C) H295R cells were transfected with WT or T759A-mutant pEGFP-DIAPH1 and treated with 20 μM MG132 for 6 h. Cell lysates were harvested and separated by SDS–PAGE, followed by Western blotting using anti-GFP and anti-GAPDH antibodies. Left, representative blots; right, densitometric analysis. Graph data represent mean ± SD of three experiments, each in duplicate. (D) H295R cells were treated for 30 min with 0.4 nM Bt2cAMP in the presence or absence of 20 μM MG132. Cell lysates were harvested and separated by SDS–PAGE, followed by Western blotting using anti–phospho(T759)-DIAPH1, anti-DIAPH1, and anti-GAPDH antibodies. Left, representative blots; right, densitometric analysis. Data represent the mean ± SD of four experiments, each in duplicate. Asterisks denote statistical significance (p < 0.05) compared with untreated control. (E) Lysates from control or Bt2cAMP-treated cells transfected with GFP-tagged DIAPH1 were incubated with anti-GFP antibody and protein A/G agarose and the immunoprecipitated protein analyzed by SDS–PAGE and Western blotting for SUMO-1. Representative blots of study performed on three separate occasions, each time in duplicate. (F) Lysates from cells that were transfected with WT or T759A GFP-tagged DIAPH1 were immunoprecipitated with anti-GFP and the immobilized proteins assessed by SDS–PAGE and Western blotting for SUMO-1. Representative blots of study performed on two separate occasions, each time in duplicate.
FIGURE 5:
FIGURE 5:
(A–F) H295R cells were transfected with WT or T759A-mutant pEGFP-DIAPH1, and lysates were immunoprecipitated using an anti-GFP antibody and protein A/G agarose. Immobilized proteins were washed, separated by SDS–PAGE, and analyzed by Western blotting using anti-RhoA (A), anti-kinesin (B), anti–β-actin (C), β-tubulin (D), anti-ORP2 (E), or anti-ORP10 (F) antibodies. Five percent of inputs were subjected to SDS–PAGE and Western blotting using an anti-GFP antibody. All coimmunoprecipitations were performed on at least three separate occasions, in at least duplicate. Data above each blot represent mean ± SD, and asterisks denote significantly different from WT (p < 0.05).
FIGURE 6:
FIGURE 6:
(A) Representative confocal microscopy image of H295R cells that were plated onto cover slips and transfected with WT or T759A-mutant pEGFP-DIAPH1 and Mito Tracker Red. (B) Graphical analysis of mitochondrial movement in H295R cells transfected with WT or T759A-mutant pEGFP-DIAPH1 and treated with 0.4 mM Bt2cAMP. The Zeiss Imaging Physiology platform was used to determine the velocity of movement of individual mitochondrion from video elapsed recordings. Time of exposure of each frame was 1 s, with a 3-s interval between frames. Mitochondrion movement (μm/s) was calculated by subtracting the change in position after each frame interval. Data graphed represents mean ± SEM of three separate experiments. At least 20 mitochondria were analyzed in each experimental replicate. Asterisks and carats denote statistically different (p < 0.05) from WT control and Bt2cAMP-treated groups, respectively.

Similar articles

Cited by

References

    1. Alberts AS. Identification of a carboxyl-terminal diaphanous-related formin homology protein autoregulatory domain. J Biol Chem. 2001;276:2824–2830. - PubMed
    1. Alberts AS, Bouquin N, Johnston LH, Treisman R. Analysis of RhoA-binding proteins reveals an interaction domain conserved in heterotrimeric G protein beta subunits and the yeast response regulator protein Skn7. J Biol Chem. 1998;273:8616–8622. - PubMed
    1. Allan VJ, Schroer TA. Membrane motors. Curr Opin Cell Biol. 1999;11:476–482. - PubMed
    1. Bartolini F, Gundersen GG. Formins and microtubules. Biochim Biophys Acta. 2010;1803:164–173. - PMC - PubMed
    1. Bartolini F, Moseley JB, Schmoranzer J, Cassimeris L, Goode BL, Gundersen GG. The formin mDia2 stabilizes microtubules independently of its actin nucleation activity. J Cell Biol. 2008;181:523–536. - PMC - PubMed

Publication types

MeSH terms