. 2013 Apr 4;121(14):2678-88.
doi: 10.1182/blood-2012-10-459545. Epub 2013 Jan 16.

NK cell responses to cytomegalovirus infection lead to stable imprints in the human KIR repertoire and involve activating KIRs

Affiliations

NK cell responses to cytomegalovirus infection lead to stable imprints in the human KIR repertoire and involve activating KIRs

Vivien Béziat et al. Blood. .

Abstract

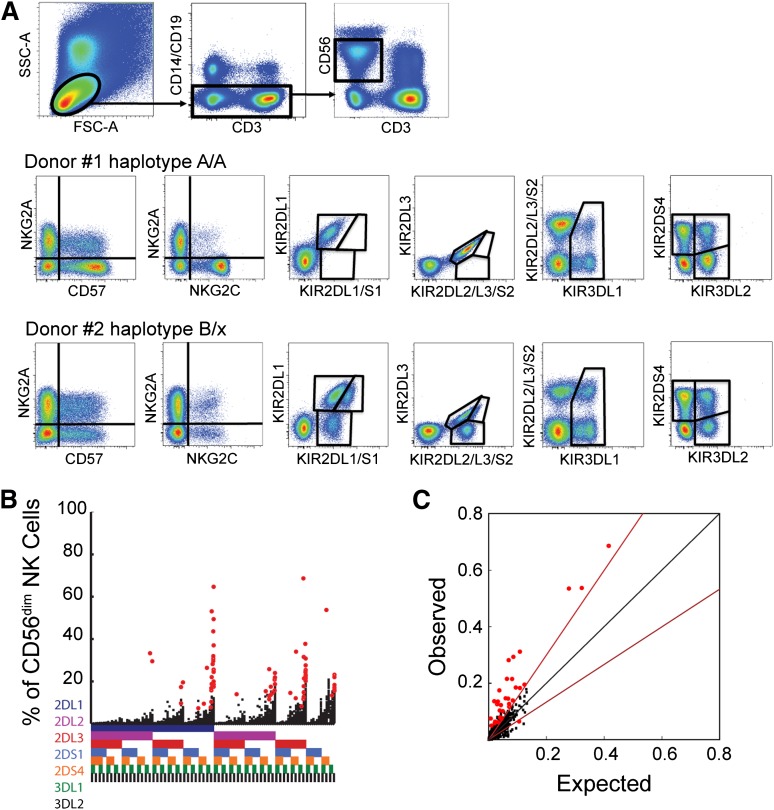
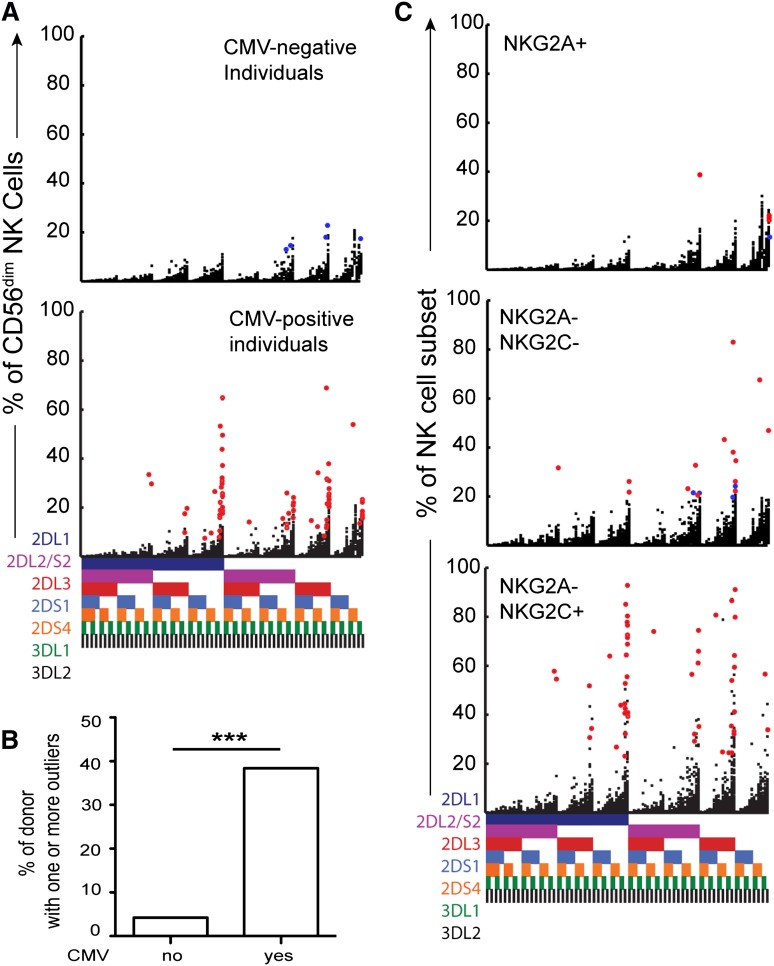
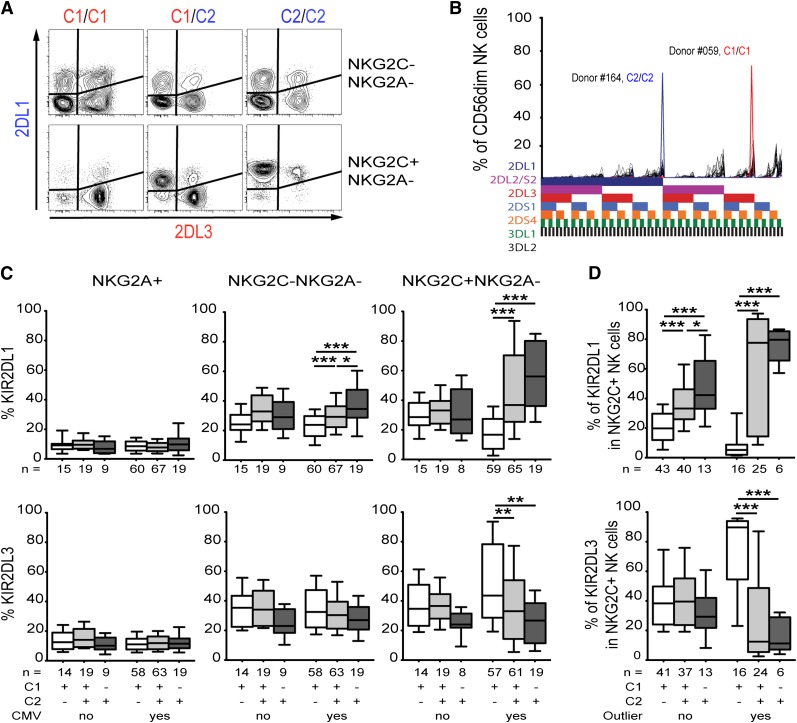
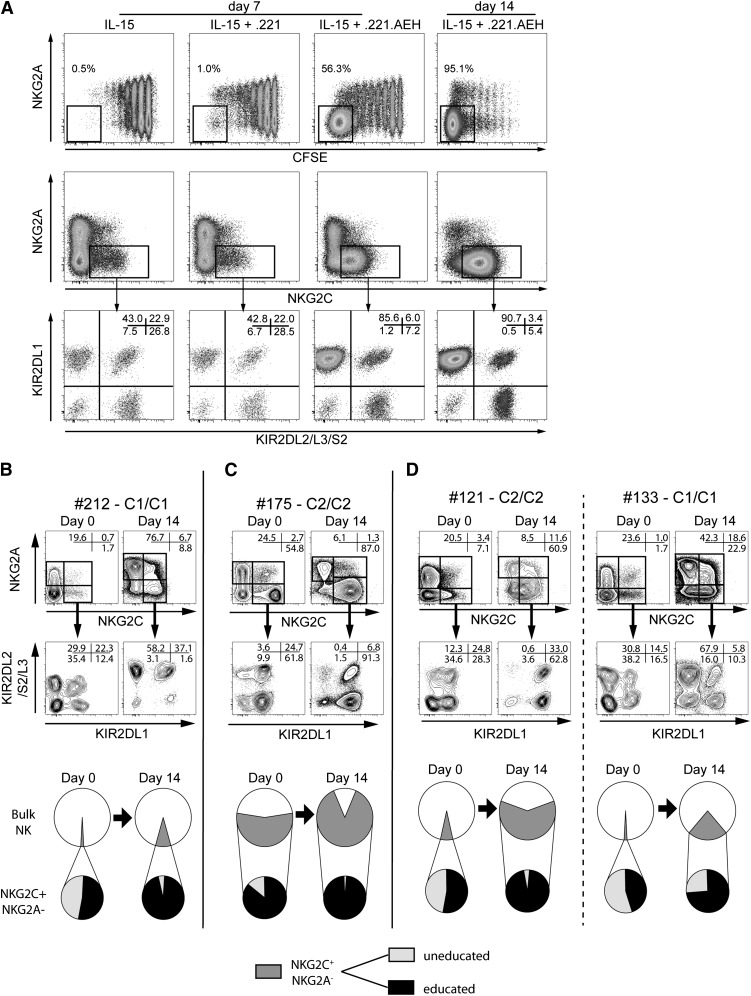
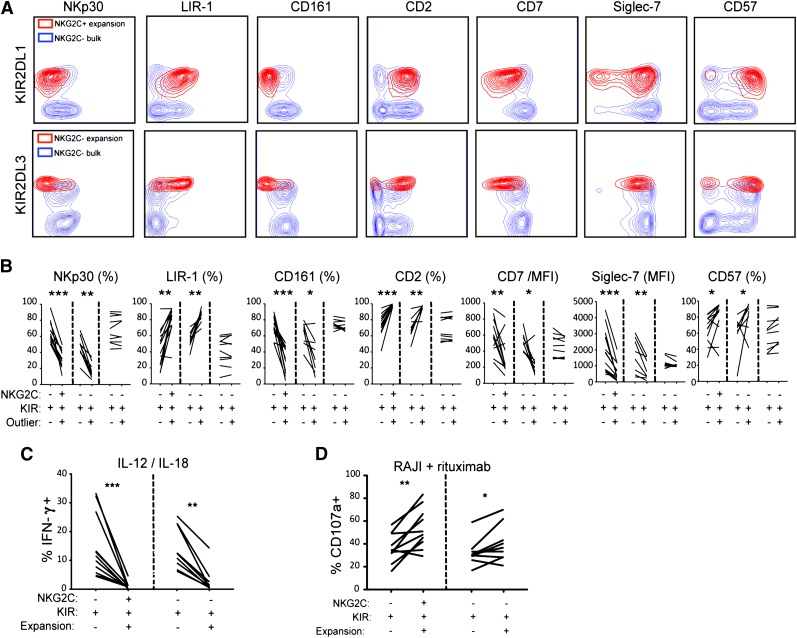
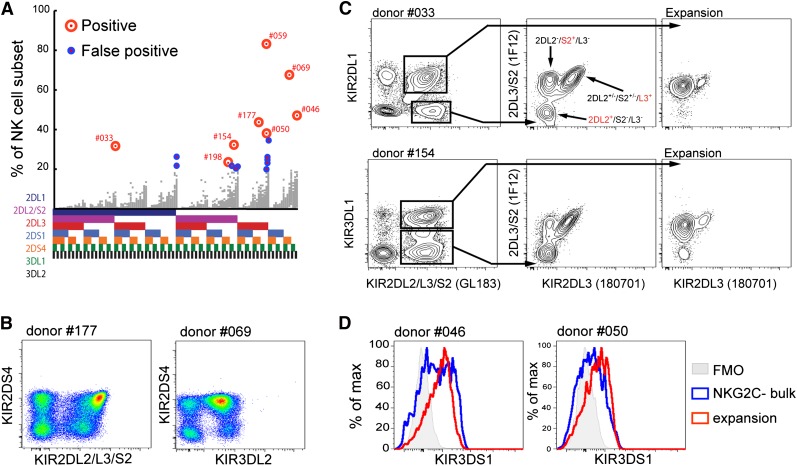
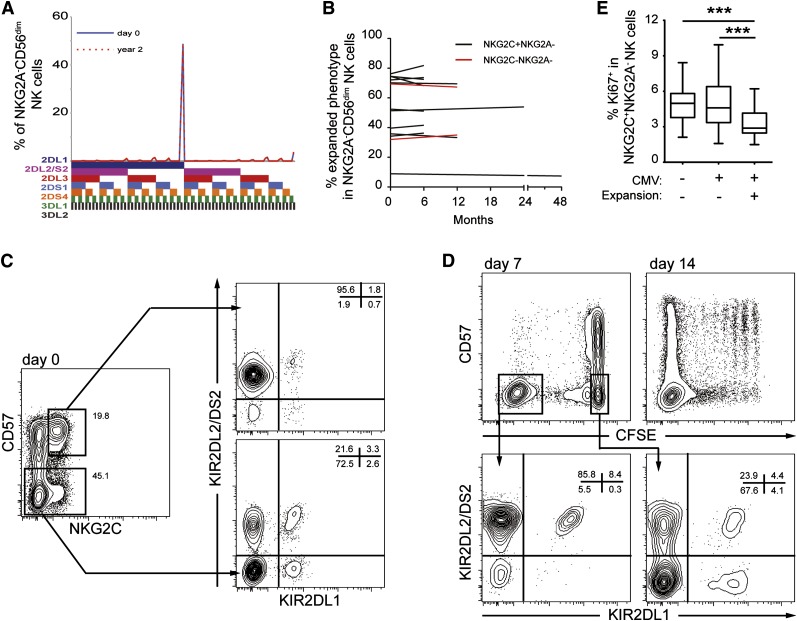
Human natural killer (NK) cells are functionally regulated by killer cell immunoglobulin-like receptors (KIRs) and their interactions with HLA class I molecules. As KIR expression in a given NK cell is genetically hard-wired, we hypothesized that KIR repertoire perturbations reflect expansions of unique NK-cell subsets and may be used to trace adaptation of the NK-cell compartment to virus infections. By determining the human "KIR-ome" at a single-cell level in more than 200 donors, we were able to analyze the magnitude of NK cell adaptation to virus infections in healthy individuals. Strikingly, infection with human cytomegalovirus (CMV), but not with other common herpesviruses, induced expansion and differentiation of KIR-expressing NK cells, visible as stable imprints in the repertoire. Education by inhibitory KIRs promoted the clonal-like expansion of NK cells, causing a bias for self-specific inhibitory KIRs. Furthermore, our data revealed a unique contribution of activating KIRs (KIR2DS4, KIR2DS2, or KIR3DS1), in addition to NKG2C, in the expansion of human NK cells. These results provide new insight into the diversity of KIR repertoire and its adaptation to virus infection, suggesting a role for both activating and inhibitory KIRs in immunity to CMV infection.


Figures

Figure 1
Figure 1
Characterization of human NK cell KIR repertoires. (A) 14-color flow cytometry panel for assessment of KIR2DL1, KIR2DL2/S2, KIR2DL3, KIR3DL1, KIR2DS1, KIR2DS4, and KIR3DL2 expression in CD56dim NK cell subsets expressing NKG2A, NKG2C, and/or CD57. Representative examples of stainings in KIR haplotype A homozygous and haplotype B/X donors are shown. (B) Frequency of CD56dim NK cells expressing the 7 analyzed KIRs and the 128 possible combinations thereof in 199 healthy donors. The presence of one KIR in a combination is represented by a color code below the graph: 2DL1 (dark blue), 2DL2/S2 (purple), 2DL3 (red), 2DS1 (light blue), 2DS4 (orange), 3DL1 (green), and 3DL2 (black). Red dots represent statistical outliers as defined by the Chauvenet criterion (see supplementary Information). (C) Observed frequencies of NK cells expressing 2 KIRs were compared with those expected from the product rule. The black line represents a perfect match between observed and expected values. The red line represents a 1.5-fold deviation from the product rule. Red dots represent statistical outliers as defined in (B).
Figure 2
Figure 2
Dissecting the origin of the expanded KIR subsets. (A) Stratification of the cohort into CMV-seronegative (top, n = 48) and CMV-seropositive (bottom, n = 151) individuals. Red dots represent subsets with high relative frequencies (statistical outliers as defined in Figure 1B). (B) Shown are the frequencies of donors with 1 or more outliers according to CMV serostatus. (C) Representation of statistical outliers in CMV-seropositive (red dots) and CMV-seronegative (blue dots) donors originating from NKG2A+, NKG2C-NKG2A-, and NKG2C+ CD56dim NK cell subsets.
Figure 3
Figure 3
CMV induces expansion of NK cells expressing a clonal pattern of self-specific KIRs. (A) Representative plot of KIR2DL1 and KIR2DL3 expression in NKG2C-NKG2A- (top) and NKG2C+ (bottom) CD56dim NK cell subsets. Three CMV-seropositive donors with different HLA genotypes are depicted. The color-coding pairs KIRs with their cognate HLA ligands. (B) Shown are 2 extreme examples of KIR repertoires in CMV-seropositive donors (C2/C2 blue and C1/C1 red) overlaid on the 48 KIR repertoires from CMV-seronegative individuals (n = 48). (C) The aggregated effect of the HLA-C genotype on KIR expression in all donors was examined by plotting frequencies of KIR2DL1 and KIR2DL3 in NKG2A+ (left), NKG2C-NKG2A- (middle), and NKG2C+ (right) NK cell subsets, respectively. Donors were stratified based on CMV serology and HLA background. (D) The effect of HLA-C genotype on self-specific KIR expression in CMV-seropositive individuals with and without evidence of NK cell expansion.
Figure 4
Figure 4
Education promotes amplification and skewing of the KIR repertoire. (A) NK cells were labeled with CFSE and were cultured for 7 or 14 days with IL-15 alone or together with irradiated 221.wt or 221.AEH cells. At day 7 or day 14, cells were assessed for KIR and NKG2A/C expression. (B-D) Size of the NKG2C+ subset and KIR expression at day 0 and day 14 in coculture experiments with 221.AEH cells. Shown are representative examples (top) and pie charts (bottom) of NKG2C+ NK cell amplification and KIR skewing in (B) a CMV-seropositive donors without preexisting expansion, (C) a CMV-seropositive donor with preexisting expansion, and (D) 2 CMV-seronegative donors (C2/C2 left and C1/C1 right).
Figure 5
Figure 5
Expanded NK cells display distinct phenotypic and functional properties. (A) Representative staining of the indicated surface molecules on NK cell expansions in the NKG2C+ and NKG2C-NKG2A- NK cell subsets from CMV-seropositive donors. (B) Aggregated phenotypes of 10 representative NKG2C+ expansions compared with the 18 identified NKG2C-NKG2A- outliers with (n = 8) and without (n = 10) a differentiated phenotype. (C) NK cells were stimulated overnight with IL-12 and IL-18 in the presence of brefeldin A and were stained intracellularly for IFN-γ production. The figure shows IFN-γ production in NK cell expansions originating from NKG2C+ (n = 10) and NKG2C-NKG2A- (n = 8) compartments. (D) NK cells were stimulated for 2 hours with rituximab-coated Raji cells in ADCC experiments and were stained for CD107a to monitor degranulation. The figure shows CD107a expression in NK cell expansions originating from NKG2C+ (n = 10) and NKG2C-NKG2A- (n = 8) compartments. In (B-D), all comparisons were made with the relevant KIR+ NK cell subset.
Figure 6
Figure 6
Expanding NKG2C-NKG2A- NK cells express activating KIRs. (A) Expansions in the NKG2C-NKG2A- compartment with a differentiated phenotype are marked with red circles. False-positive outliers with less differentiated phenotypes are marked with small blue circles. Gray dots represent the KIR repertoires in the 199 donors. (B) KIR expression patterns in representative CMV-seropositive donors with KIR2DS4+ expansion in the NKG2A-NKG2C- NK cell subset. (C) Identification of NK cell expansions in CMV-seropositive donors expressing KIR2DS2 using combinations of the indicated anti-KIR antibodies. Expansions (right) and their respective GL183+ internal controls (middle) were gated out, as depicted in the bivariate plots (left). (D) Representative CMV-seropositive donors with NKG2A-NKG2C- expansions expressing KIR3DS1. KIR3DS1-single positive cells are shown (Z27+DX9-) after exclusion of KIR3DL1+ (Z27+DX9+) cells.
Figure 7
Figure 7
Stability of NK cell expansions with time. (A) Example of KIR repertoire stability in an adult with a sampling interval of 2 years. Shown is the frequency of cells expressing the indicated combination of KIRs in the NKG2A- CD56dim NK cell compartment. (B) Summary showing the stability of NKG2C+ (black) and activating KIR+ (red) expansions in CMV-seropositive individuals at sampling intervals ranging from 6 months to 4 years. (C,D) NK cells were labeled with CFSE, stimulated in vitro with IL-15, and cocultured with 221.AEH cells. (C) Density plots show KIR expression patterns of the indicated NK cell subsets at day 0, before proliferation. (D) Density plots show the phenotype of proliferating (CFSE-negative) and nonproliferating cells (CFSE-positive) at days 7 and 14, and their KIR expression patterns at day 7 (bottom). Results are representative of 3 independent experiments. (E) Frequency of Ki67+ NKG2C+ NK cells in peripheral blood of healthy donors. Three groups of donors were analyzed: CMV-seronegative donors (n = 46), and CMV-seropositive donors with (n = 48) and without (n = 100) expansion in the NKG2C+ NK cell compartment. Bars in the box and a whisker plot represent the highest and the lowest interquartiles.

Similar articles

Cited by

References

    1. Bryceson YT, Long EO. Line of attack: NK cell specificity and integration of signals. Curr Opin Immunol. 2008;20(3):344–352. - PMC - PubMed
    1. Barrow AD, Trowsdale J. The extended human leukocyte receptor complex: diverse ways of modulating immune responses. Immunol Rev. 2008;224:98–123. - PubMed
    1. Braud VM, Allan DS, O’Callaghan CA, et al. HLA-E binds to natural killer cell receptors CD94/NKG2A, B and C. Nature. 1998;391(6669):795–799. - PubMed
    1. Moretta L, Moretta A. Killer immunoglobulin-like receptors. Curr Opin Immunol. 2004;16(5):626–633. - PubMed
    1. Parham P. MHC class I molecules and KIRs in human history, health and survival. Nat Rev Immunol. 2005;5(3):201–214. - PubMed

Publication types

MeSH terms