. 2013 Mar 1;41(5):2881-93.
doi: 10.1093/nar/gks1472. Epub 2013 Jan 15.

Histone methyltransferase SETD2 coordinates FACT recruitment with nucleosome dynamics during transcription

Affiliations

Histone methyltransferase SETD2 coordinates FACT recruitment with nucleosome dynamics during transcription

Sílvia Carvalho et al. Nucleic Acids Res. .

Abstract

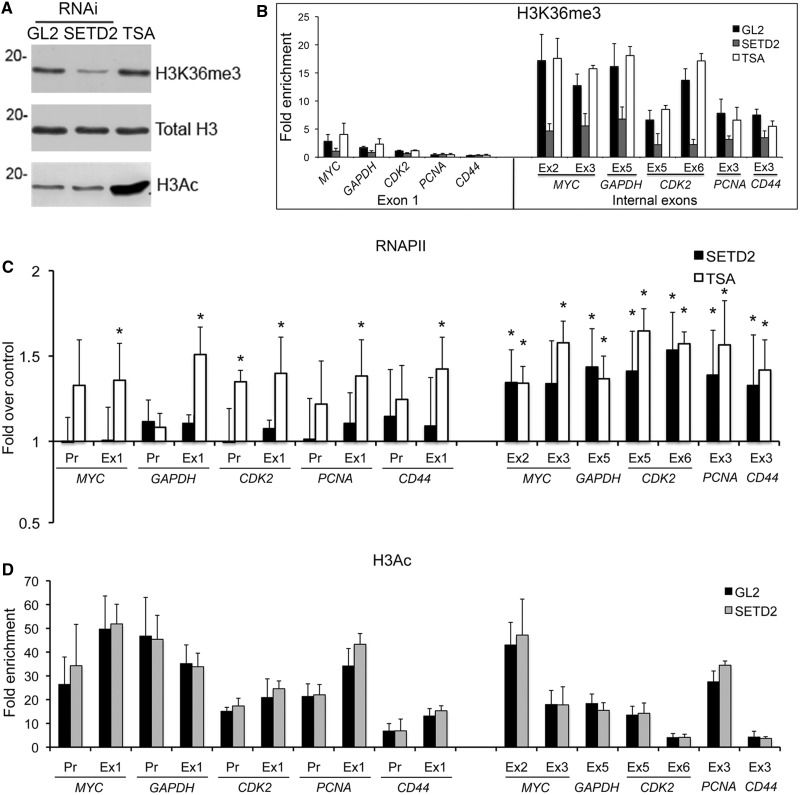
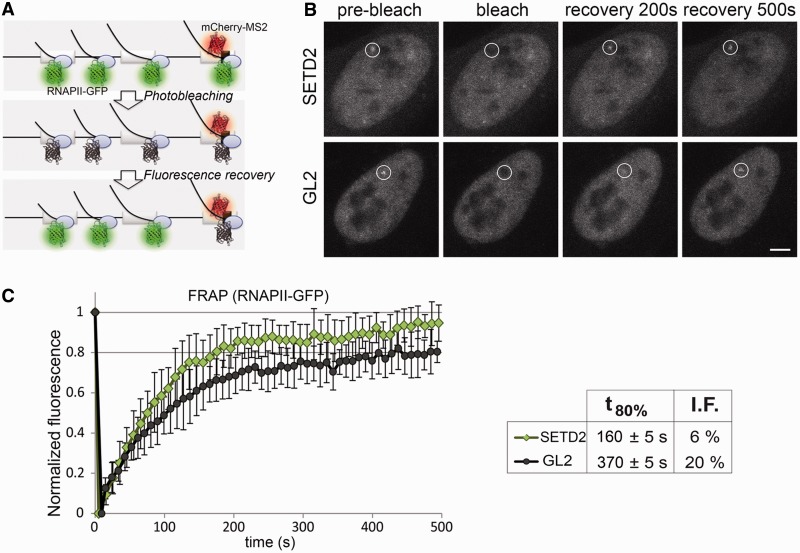
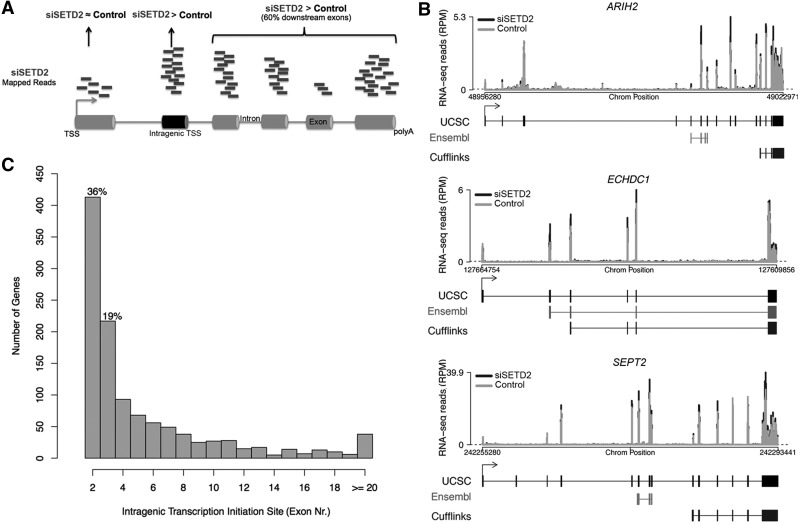
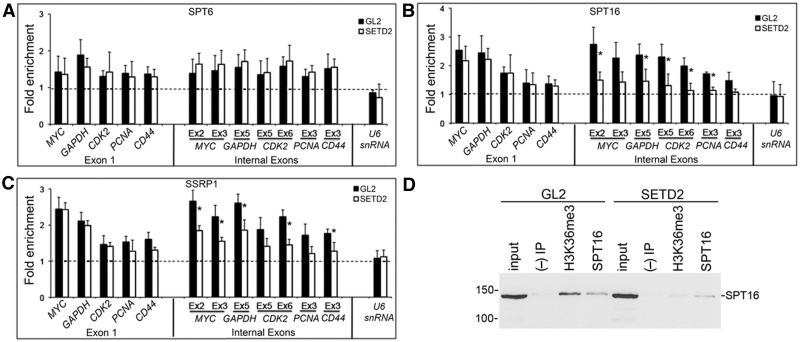
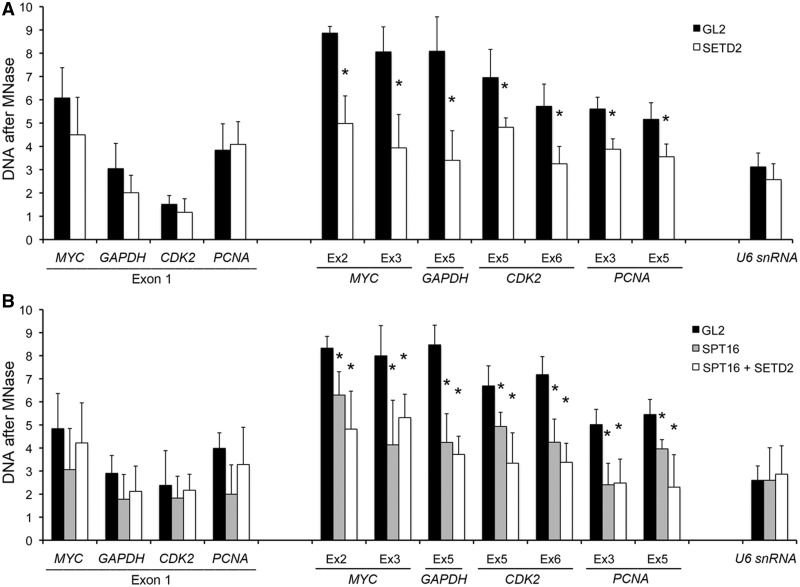
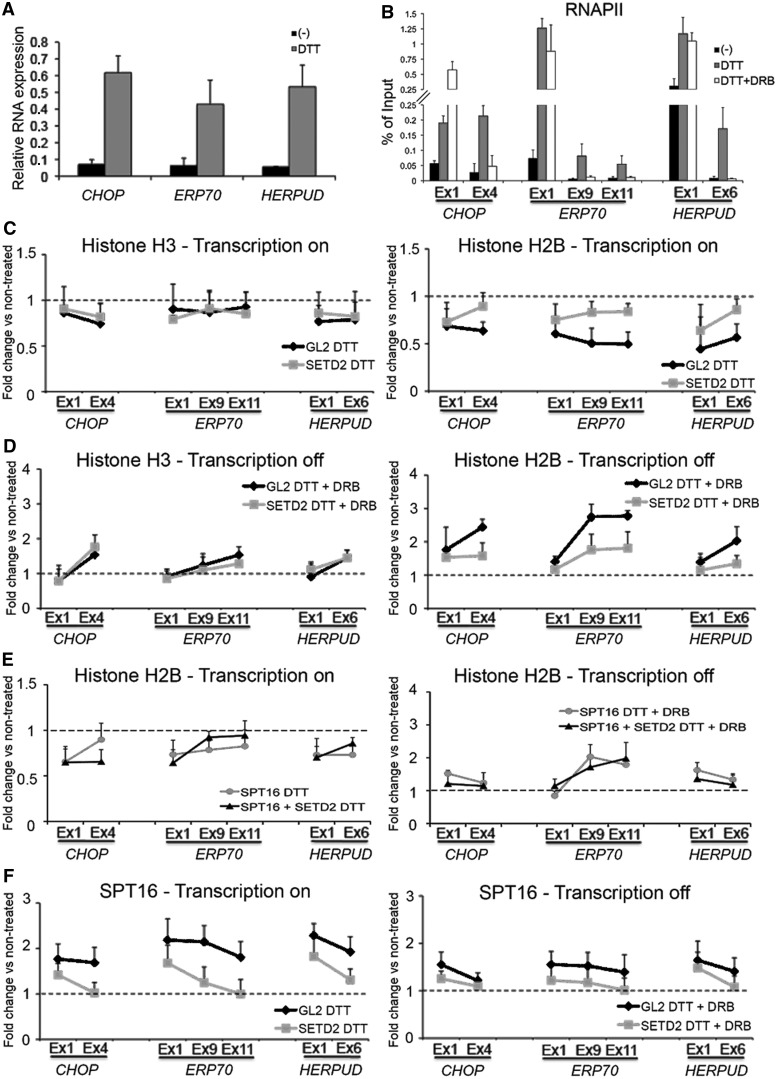
Histone H3 of nucleosomes positioned on active genes is trimethylated at Lys36 (H3K36me3) by the SETD2 (also termed KMT3A/SET2 or HYPB) methyltransferase. Previous studies in yeast indicated that H3K36me3 prevents spurious intragenic transcription initiation through recruitment of a histone deacetylase complex, a mechanism that is not conserved in mammals. Here, we report that downregulation of SETD2 in human cells leads to intragenic transcription initiation in at least 11% of active genes. Reduction of SETD2 prevents normal loading of the FACT (FAcilitates Chromatin Transcription) complex subunits SPT16 and SSRP1, and decreases nucleosome occupancy in active genes. Moreover, co-immunoprecipitation experiments suggest that SPT16 is recruited to active chromatin templates, which contain H3K36me3-modified nucleosomes. Our results further show that within minutes after transcriptional activation, there is a SETD2-dependent reduction in gene body occupancy of histone H2B, but not of histone H3, suggesting that SETD2 coordinates FACT-mediated exchange of histone H2B during transcription-coupled nucleosome displacement. After inhibition of transcription, we observe a SETD2-dependent recruitment of FACT and increased histone H2B occupancy. These data suggest that SETD2 activity modulates FACT recruitment and nucleosome dynamics, thereby repressing cryptic transcription initiation.


Figures

Figure 1.
Figure 1.
SETD2 depletion impacts on transcription by RNAPII. HeLa cells were either transfected with siRNAs targeting GL2 or SETD2 or treated with 0.5 μM TSA for 12 h. (A) Total protein extracts were analyzed by western blot with anti-histone antibodies, as indicated on the right. Molecular weight markers are shown on the left. (B, C and D) ChIP analysis with antibodies that recognize H3K36me3 (B), RNAPII (C) and H3Ac (D). Histone modifications ChIP data are normalized against total histone H3 ChIP. RNAPII ChIP signals are shown as fold change over the signal obtained on the control cells. Means and standard deviations from at least three independent experiments are shown. Two SETD2 siRNA duplexes were used randomly on each individual RNAi experiment. Statistically significant changes between SETD2-depleted cells and control cells (GL2 RNAi) and between TSA-treated cells and control cells are indicated (*P < 0.05).
Figure 2.
Figure 2.
SETD2 depletion alters the dynamics of RNAPII transcription. (A) Schematic representation of the MS2 system. Dimers of MS2 coat protein fused to mCherry bind to MS2 stem–loops inserted in the third exon of the β-globin gene, while transcription is carried out by α-amanitin–resistant RNAPII–GFP. (B) FRAP experiments were performed on U2OS cells transfected with siRNAs targeting GL2 and SETD2. A circular region corresponding to the site of transcription of the β-globin gene is bleached, and fluorescence recovery is subsequently monitored. Scale bar: 5 µm. (C) Normalized fluorescence recovery curves measured at the transcription site for SETD2-depleted (n = 19) and GL2-depleted (n = 18) cells from four individual experiments. t80% denotes the time required to recover 80% of the initial fluorescence. I.F. indicates the percentage of the immobile fraction of bleached RNAPII–GFP molecules at the site of transcription. Error bars represent standard deviations.
Figure 3.
Figure 3.
Genome-wide analysis of intragenic transcription initiation induced by SETD2 depletion. (A) Schematic representation describing the constraints for identification of genes with intragenic transcription initiation in SETD2-depleted cells. Genes showing significantly higher read counts for exons downstream of the first annotated exon in SETD2-depleted cells were selected. The intragenic transcription initiation site is defined as the first exon with significantly higher read counts for which at least 60% of the downstream exons also show significantly higher read counts. (B) RNA-seq profiles for the genes ARIH2, ECHDC1 and SEPT2 showing intragenic transcription initiation on different internal exons after SETD2 knockdown (black) relative to control (gray). Dashed line represents the minimum threshold 5 reads/100 bp (normalized reads per million). For each gene, the UCSC transcript annotations compared with annotated alternative promoter from Ensembl and Cufflinks transcript reconstruction are shown below the graph. Boxes represent exons, separated by introns shown as solid lines (C) Histogram of intragenic transcription initiation site location (exon number).
Figure 4.
Figure 4.
SETD2 is required for FACT recruitment. HeLa cells were transfected with siRNAs targeting GL2 or SETD2. (A–C) ChIP analysis was carried out using antibodies against SPT6 (A), SPT16 (B) and SSRP1 (C). For each antibody, the ChIP signals were normalized against the ChIP signal of a non-transcribed intergenic region. Graphs depict mean and standard deviation from at least four independent experiments. Two SETD2 siRNA duplexes were used randomly on each individual RNAi experiment. Statistically significant changes between GL2- and SETD2-depleted cells are indicated (*P < 0.05). (D) Co-IP of endogenous H3K36me3 and SPT16 on control (GL2) or SETD2-depleted HeLa cells. H3K36me3 and SPT16 were immunoprecipitated from HeLa cells with specific antibodies. ‘Input’ represents the total cell lysate, and the ‘(−) IP’ is a negative control obtained from a beads-only immunoprecipitation. The pulled-down complexes were subjected to western blot with an antibody against SPT16. Molecular weight markers are shown on the left. Three experiments with similar results were performed.
Figure 5.
Figure 5.
SETD2 regulates nucleosome organization. Nucleosome occupancy on GL2- and SETD2-depleted (A) or GL2-, SPT16- and SPT16+SETD2-depleted (B) cells was estimated by the amount of MNase-resistant DNA after 20-min digestion. The graphs show the amount of DNA recovered after 20-min digestion with MNase relative to the amount of DNA present in undigested samples. The data were normalized against the nucleosome occupancy of a non-transcribed intergenic region. Means and standard deviations from at least three independent experiments are shown. Statistically significant changes between GL2- and SETD2-, SPT16-depleted or SETD2+SPT16-depleted cells are indicated (*P < 0.05).
Figure 6.
Figure 6.
Transcription affects nucleosome organization in a SETD2-dependent manner. Transcription of CHOP, ERP70 and HERPUD genes was stimulated by treating HeLa cells with 2 mM DTT for 1 h; as a control, cells were left untreated (−). To inhibit transcription, cells were first treated with 2 mM DTT for 1 h and then incubated with 75 μM DRB for 30 min (DTT + DRB). Cells were transfected with siRNAs targeting GL2, SETD2, SPT16 or SETD2 + SPT16 as indicated. Means and standard deviations from at least four independent experiments are shown. (A) Cells were fractionated into cytoplasmic, nucleoplasmic and chromatin fractions; RNA associated with chromatin was isolated; and RT-qPCR was carried out with primers to detect nascent RNA from the indicated genes. The amount of PCR product estimated by RT-qPCR was normalized to the levels of U6 snRNA. (B) ChIP analysis with antibodies to RNAPII. Data are shown as percentage of the input chromatin. (C and D) ChIP analysis with antibodies to total histone H3 and H2B when transcription is either active or inhibited (+DRB). The decrease in H2B occupancy on DTT treatment (C) and its accumulation after DRB addition (D) was statistically significant (P < 0.05) in control (GL2) cells, on the internal exons of the three genes only. (E) ChIP analysis of histone H2B when transcription is either active or inhibited (+DRB) in cells depleted of SPT16 or SPT16 + SETD2. (F) ChIP analysis with antibodies to SPT16. Recruitment of SPT16 to the chromatin templates of the three genes after transcription activation with DTT was significant (P < 0.05) in control cells. In SETD2-depleted cells, the recruitment of SPT16 to the internal exons of the three genes on addition of DTT was significantly impaired. Data shown in (C), (D), (E) and (F) are represented as fold change over the corresponding ChIP signal of cells that were not treated with DTT.

References

    1. Li B, Carey M, Workman JL. The role of chromatin during transcription. Cell. 2007;128:707–719. - PubMed
    1. Kouzarides T. Chromatin modifications and their function. Cell. 2007;128:693–705. - PubMed
    1. Kolasinska-Zwierz P, Down T, Latorre I, Liu T, Liu XS, Ahringer J. Differential chromatin marking of introns and expressed exons by H3K36me3. Nat. Genet. 2009;41:376–381. - PMC - PubMed
    1. Spies N, Nielsen CB, Padgett RA, Burge CB. Biased chromatin signatures around polyadenylation sites and exons. Mol. Cell. 2009;36:245–254. - PMC - PubMed
    1. Luco RF, Pan Q, Tominaga K, Blencowe BJ, Pereira-Smith OM, Misteli T. Regulation of alternative splicing by histone modifications. Science. 2010;327:996–1000. - PMC - PubMed

Publication types

MeSH terms