

Comparative genomic study of gastric epithelial cells co-cultured with Helicobacter pylori
- PMID: 23326126
- PMCID: PMC3544023
- DOI: 10.3748/wjg.v18.i48.7212
Comparative genomic study of gastric epithelial cells co-cultured with Helicobacter pylori
Abstract
Aim: To identify genes potentially involved in Helicobacter pylori (H. pylori)-induced gastric carcinogenesis.
Methods: GES-1 cells were co-cultured with H. pylori strains isolated from patients with gastric carcinoma (GC, n = 10) or chronic gastritis (CG, n = 10) for in vitro proliferation and apoptosis assays to identify the most and least virulent strains. These two strains were cagA-genotyped and used for further in vivo carcinogenic virulence assays by infecting Mongolian gerbils for 52 wk, respectively; a broth free of H. pylori was lavaged as control. Genomic profiles of GES-1 cells co-cultured with the most and least virulent strains were determined by microarray analysis. The most differentially expressed genes were further verified using quantitative real-time polymerase chain reaction in GES-1 cells infected with the most and least virulent strains, and by immunohistochemistry in H. pylori positive CG, precancerous diseases, and GC biopsy specimens in an independent experiment.
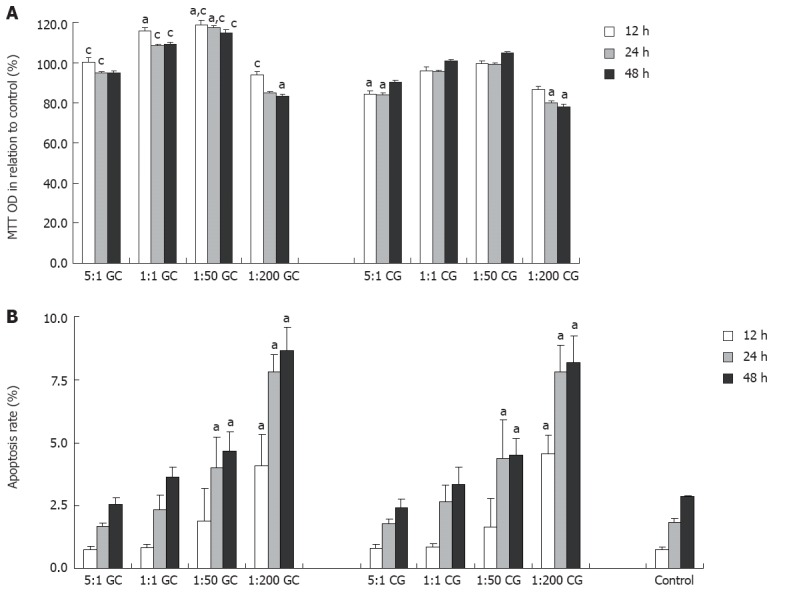
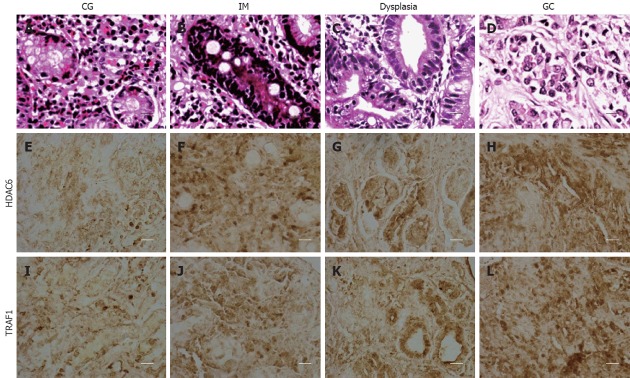
Results: GC-derived H. pylori strains induced a potent proliferative effect in GES-1 cells in co-culture, whereas CG-derived strains did not. The most (from a GC patient) and least (from a CG patient) virulent strains were cagA-positive and negative, respectively. At week 52, CG, atrophy, metaplasia, dysplasia, and GC were observed in 90.0%, 80.0%, 80.0%, 90%, and 60.0%, respectively, of the animals lavaged with the most virulent strain. However, only mild CG was observed in 90% of the animals lavaged with the least virulent strain. On microarray analysis, 800 differentially expressed genes (49 up- and 751 down-regulated), involving those associated with cell cycle regulation, cell apoptosis, cytoskeleton, immune response, and substance and energy metabolisms, were identified in cells co-cultured with the most virulent strain as compared with those co-cultured with the least virulent strain. The six most differentially expressed genes (with a betweenness centrality of 0.1-0.2) were identified among the significant differential gene profile network, including JUN, KRAS, BRCA1, SMAD2, TRAF1, and HDAC6. Quantitative real-time polymerase chain reaction analyses verified that HDAC6 and TRFA1 mRNA expressions were significantly more up-regulated in GES-1 cells co-cultured with the most virulent strain than in those co-cultured with the least virulent strain. Immunohistochemistry of gastric mucosal specimens from H. pylori-positive patients with CG, intestinal metaplasia (IM), dysplasia, and GC showed that moderately positive and strongly positive HDAC6 expression was detected in 21.7% of CG patients, 30.0% of IM patients, 54.5% of dysplasia patients, and 77.8% of GC patients (P < 0.001). The up-regulation of TRAF1 expressions was detected in 34.8%, 53.3%, 72.7%, and 88.9% specimens of CG, IM, dysplasia, and GC, respectively (P < 0.001).
Conclusion: The overexpression of HDAC6 and TRAF1 in GES-1 cells co-cultured with the GC-derived strain and in H. pylori-positive dysplasia and GC suggests that HDAC6 and TRAF1 may be involved in H. pylori-induced gastric carcinogenesis.
Keywords: Gastric carcinoma; Genomic profiles; Helicobacter pylori; Proliferation.
Figures


Similar articles
-
[Chronic Helicobacter pylori infection induces the proliferation and apoptosis in gastric epithelial cells and gastric precancerosis in Mongolian gerbils].Zhong Nan Da Xue Xue Bao Yi Xue Ban. 2011 Sep;36(9):865-71. doi: 10.3969/j.issn.1672-7347.2011.09.009. Zhong Nan Da Xue Xue Bao Yi Xue Ban. 2011. PMID: 21946211 Chinese.
-
PBX1 attributes as a determinant of connexin 32 downregulation in Helicobacter pylori-related gastric carcinogenesis.World J Gastroenterol. 2017 Aug 7;23(29):5345-5355. doi: 10.3748/wjg.v23.i29.5345. World J Gastroenterol. 2017. PMID: 28839434 Free PMC article.
-
GATA-3 augmentation down-regulates Connexin43 in Helicobacter pylori associated gastric carcinogenesis.Cancer Biol Ther. 2015;16(6):987-96. doi: 10.1080/15384047.2015.1030552. Epub 2015 Apr 22. Cancer Biol Ther. 2015. PMID: 25901741 Free PMC article.
-
Apoptosis in gastric epithelium induced by Helicobacter pylori infection: implications in gastric carcinogenesis.Am J Gastroenterol. 2001 Jan;96(1):16-26. doi: 10.1111/j.1572-0241.2001.03447.x. Am J Gastroenterol. 2001. PMID: 11197247 Review.
-
Helicobacter pylori infection and gastric carcinoma: Not all the strains and patients are alike.World J Gastrointest Oncol. 2016 Jan 15;8(1):40-54. doi: 10.4251/wjgo.v8.i1.40. World J Gastrointest Oncol. 2016. PMID: 26798436 Free PMC article. Review.
Cited by
-
Study of the relationships among known virulence genes, coccoid transformation and cytotoxicity of Helicobacter pylori in different clinical diseases.Virulence. 2024 Dec;15(1):2418407. doi: 10.1080/21505594.2024.2418407. Epub 2024 Oct 21. Virulence. 2024. PMID: 39420787 Free PMC article.
-
NaCl pretreatment attenuates H.pylori-induced DNA damage and exacerbates proliferation of gastric epithelial cells (GES-1).Infect Agent Cancer. 2015 Mar 1;10:8. doi: 10.1186/s13027-015-0003-3. eCollection 2015. Infect Agent Cancer. 2015. PMID: 25859277 Free PMC article.
-
HDAC6/HNF4α loop mediated by miR-1 promotes bile acids-induced gastric intestinal metaplasia.Gastric Cancer. 2021 Jan;24(1):103-116. doi: 10.1007/s10120-020-01108-x. Epub 2020 Jul 23. Gastric Cancer. 2021. PMID: 32705446 Free PMC article.
-
Microarray analysis of Long non-coding RNA expression profiles in human gastric cells and tissues with Helicobacter pylori Infection.BMC Med Genomics. 2015 Dec 21;8:84. doi: 10.1186/s12920-015-0159-0. BMC Med Genomics. 2015. PMID: 26690385 Free PMC article.
-
Translation of gastric disease progression at gene level expression.J Cancer. 2020 Jan 1;11(2):520-532. doi: 10.7150/jca.29038. eCollection 2020. J Cancer. 2020. PMID: 31897247 Free PMC article.
References
-
- Makola D, Peura DA, Crowe SE. Helicobacter pylori infection and related gastrointestinal diseases. J Clin Gastroenterol. 2007;41:548–558. - PubMed
-
- Hongo M, Nagasaki Y, Shoji T. Epidemiology of esophageal cancer: Orient to Occident. Effects of chronology, geography and ethnicity. J Gastroenterol Hepatol. 2009;24:729–735. - PubMed
-
- Cave DR. Chronic gastritis and Helicobacter pylori. Semin Gastrointest Dis. 2001;12:196–202. - PubMed
-
- Lai LH, Sung JJ. Helicobacter pylori and benign upper digestive disease. Best Pract Res Clin Gastroenterol. 2007;21:261–279. - PubMed
-
- Guindi M. Role of Helicobacter pylori in the pathogenesis of gastric carcinoma and progression of lymphoid nodules to lymphoma. Can J Gastroenterol. 1999;13:224–227. - PubMed
Publication types
MeSH terms
LinkOut - more resources
Full Text Sources
Miscellaneous
