

The effects of temperature on the stability of a neuronal oscillator
- PMID: 23326223
- PMCID: PMC3542102
- DOI: 10.1371/journal.pcbi.1002857
The effects of temperature on the stability of a neuronal oscillator
Abstract
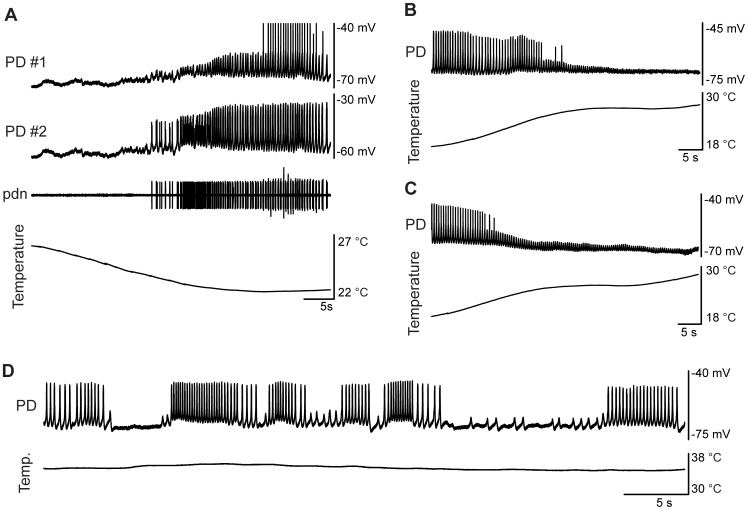
The crab Cancer borealis undergoes large daily fluctuations in environmental temperature (8-24°C) and must maintain appropriate neural function in the face of this perturbation. In the pyloric circuit of the crab stomatogastric ganglion, we pharmacologically isolated the pacemaker kernel (the AB and PD neurons) and characterized its behavior in response to temperature ramps from 7°C to 31°C. For moderate temperatures, the pacemaker displayed a frequency-temperature curve statistically indistinguishable from that of the intact circuit, and like the intact circuit maintained a constant duty cycle. At high temperatures (above 23°C), a variety of different behaviors were seen: in some preparations the pacemaker increased in frequency, in some it slowed, and in many preparations the pacemaker stopped oscillating ("crashed"). Furthermore, these crashes seemed to fall into two qualitatively different classes. Additionally, the animal-to-animal variability in frequency increased at high temperatures. We used a series of Morris-Lecar mathematical models to gain insight into these phenomena. The biophysical components of the final model have temperature sensitivities similar to those found in nature, and can crash via two qualitatively different mechanisms that resemble those observed experimentally. The crash type is determined by the precise parameters of the model at the reference temperature, 11°C, which could explain why some preparations seem to crash in one way and some in another. Furthermore, even models with very similar behavior at the reference temperature diverge greatly at high temperatures, resembling the experimental observations.
Conflict of interest statement
The authors have declared that no competing interests exist.
Figures


 and (B)
  ,
,  . Phase plots have the gating variable n on the y-axis and the voltage on the x-axis. Thin green line is the V nullcline (the line where
  ) and the thin blue line is the n nullcline (where
  ). All red lines correspond to the duty cycle threshold line, chosen as the inward half activation voltage (−50 mV). Thickest black line is the limit cycle. Black dot is a stable fixed point. Lower panel plots capture simultaneous frequency, amplitude, and duty cycle plotted from 0 to 35°C with reference temperature of 11°C. Each point is calculated from the steady state solution of the model equations.
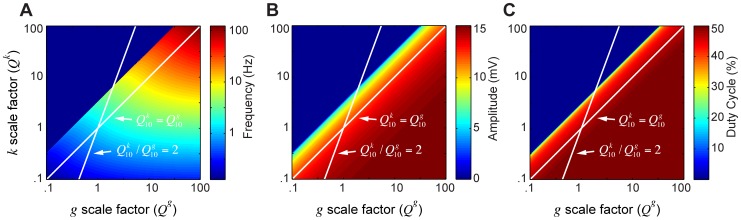
 = 1 and
  = 1. From the given reference model, along the x-axis, all conductances (
 ) are log-scaled together; on the y-axis, the gating variable (
 ) is log-scaled independently. Each point on the color plot corresponds to the measurements from the steady state model ran at their respective scaling factors. The maps of model outputs plot frequency (A), amplitude (B), and duty cycle (C). The dark blue region represents parameters where no oscillations exist. The diagonal (unity) line corresponds to a slice through parameter space where
  , as in Figure 4A; the white line with a slope of 2 corresponds to the parameter space from Figure 4B.
 =
=  = 1.5,
  = 1.6,
  = 3. Each grid point corresponds to a model output at steady state. Temperature is plotted from 0 to 45°C,
  is varied from 0.04 to 0.09 µS. The maps of model outputs plot frequency (A), amplitude (B), and duty cycle (C). The amplitude map points to domains where the transition to instability happens through a supercritical Hopf or a fold limit cycle bifurcation. The mark indicates where these two bifurcations coalesce. The two white lines (1, 2) are chosen as two representative curves with qualitatively different behaviors. Line 1 is at
  = 0.07 µS and line 2 is at
  = 0.051 µS. The waveform, phase plots and scaling behavior (frequency, amplitude, duty cycle) are plotted for each line to show specific examples. For the phase plots, the thin green line is the V nullcline (where
  ) and the thin blue line is the n nullcline (where
  ). Red line is the duty cycle threshold line chosen as the inward half activation voltage (−50 mV). Black line is the limit cycle.
 values. Temperature dependence fixed at:
  =
=  = 1.5,
  = 1.6,
  = 3. Frequency, amplitude and duty cycle maps were generated (as in Figure 5) for the three parameter points, varying temperature and inward conductance: (A)
  = 0.1 µS, (B)
  = 0.075 µS, and (C)
  = 0.06 µS. The white boxes constrain a region from 10 to 11°C where frequency is between .95 and 1.05 Hz. The horizontal lines represent the vertical boundaries of the box and are plotted explicitly below each map to demonstrate the high temperature variability. Line 1 –
  = 0.0696 µS; line 2 –
  = 0.0645 µS; line 3 –
  = 0.0639 µS; line 4 –
  = 0.0563 µS; line 5 –
  = 0.0587 µS; line 6 –
  = 0.0486 µS. White mark corresponds to bifurcation coalescence point that defines the parameter region for Figure 8.
 =
=  = 1.5,
  = 1.6,
  = 3. From a chosen reference parameter point,
  = 0.063 µS;
  = 0.06 µS;
  = 0.1 µS, at 11°C, each maximal conductance (leak, inward and outward) is given a ±7.5% tolerance and 15 randomly generated curves are plotted across temperature. Variability in parameter space is shown in the 3D plot above. The frequency, amplitude and duty cycle of the 15 models are plotted simultaneously across the three graphs as a function of temperature.
References
-
- Noble D, Noble PJ, Fink M (2010) Competing oscillators in cardiac pacemaking: historical background. Circ Res 106: 1791–1797. - PubMed
-
- McCormick DA (1992) Neurotransmitter actions in the thalamus and cerebral cortex and their role in neuromodulation of thalamocortical activity. Prog Neurobiol 39: 337–388. - PubMed
-
- McCormick DA, Bal T (1997) Sleep and arousal: thalamocortical mechanisms. Annu Rev Neurosci 20: 185–215. - PubMed
-
- Huguenard JR, McCormick DA (1992) Simulation of the currents involved in rhythmic oscillations in thalamic relay neurons. J Neurophysiol 68: 1373–1383. - PubMed
-
- Hille B (2001) Ion Channels of Excitable Membranes. Sunderland, MA: Sinauer. 814 p.
Publication types
MeSH terms
Grants and funding
LinkOut - more resources
Full Text Sources
Other Literature Sources
