. 2013;9(1):e1002862.
doi: 10.1371/journal.pcbi.1002862. Epub 2013 Jan 10.

Asymmetric PTEN distribution regulated by spatial heterogeneity in membrane-binding state transitions

Affiliations

Asymmetric PTEN distribution regulated by spatial heterogeneity in membrane-binding state transitions

Satomi Matsuoka et al. PLoS Comput Biol. 2013.

Abstract

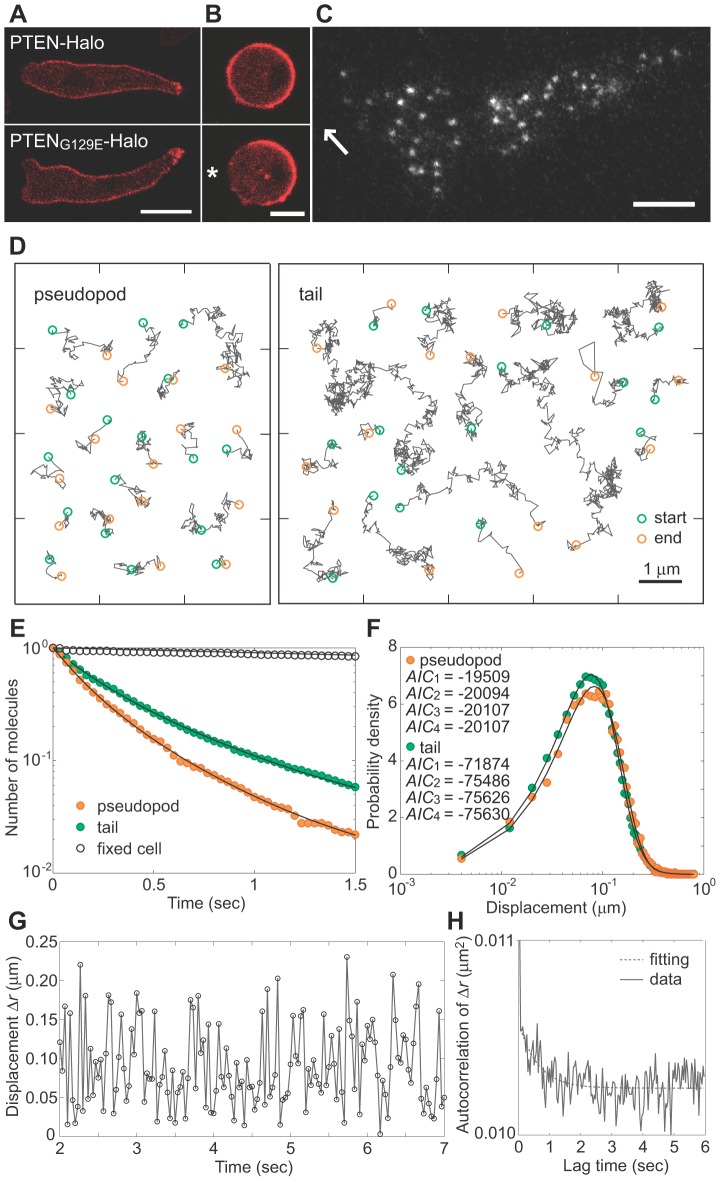
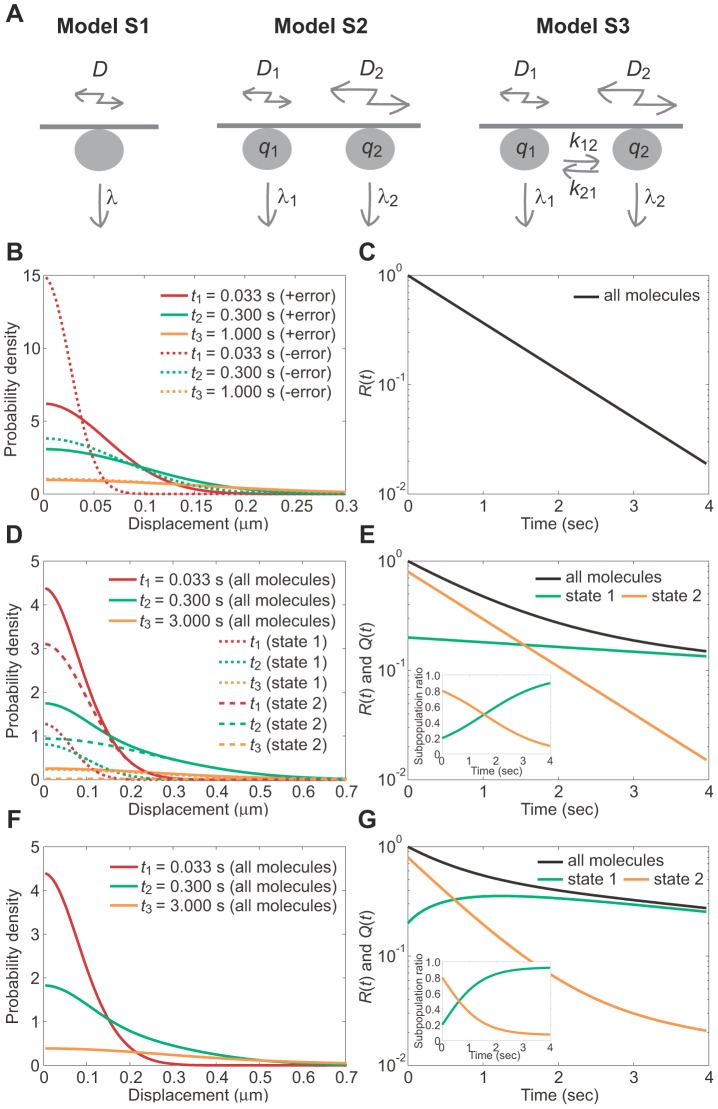
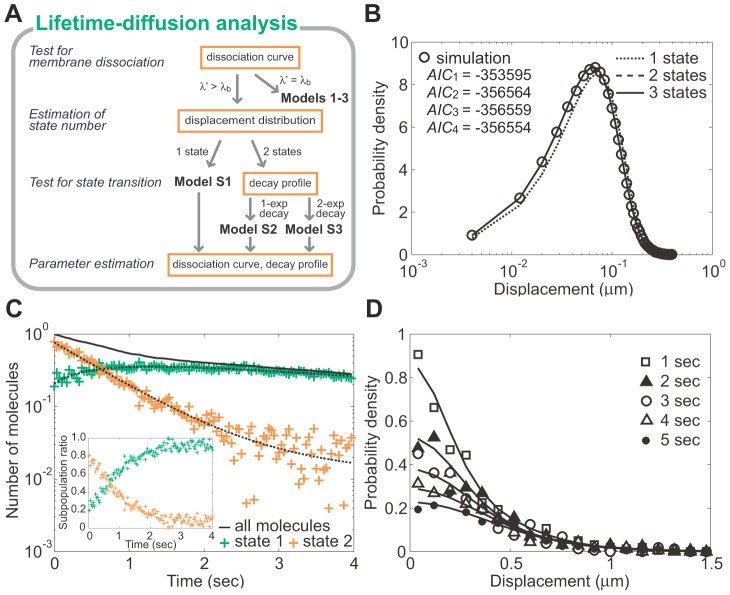
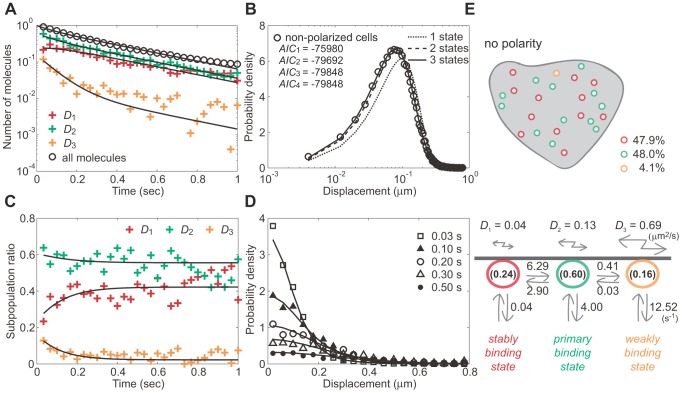
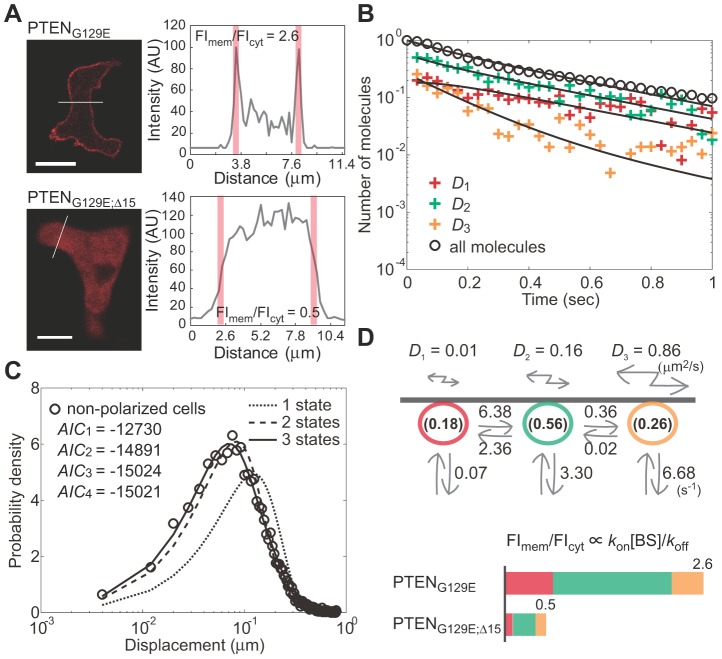
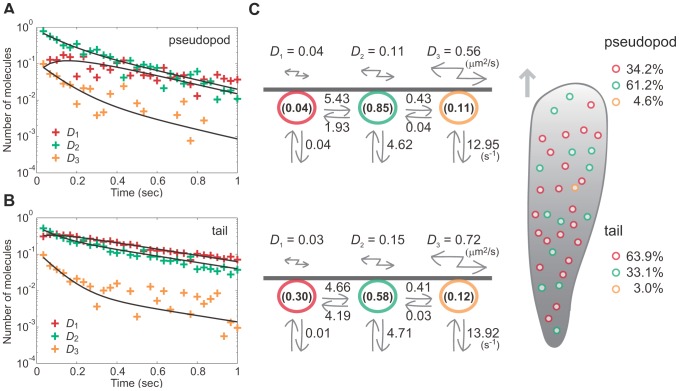
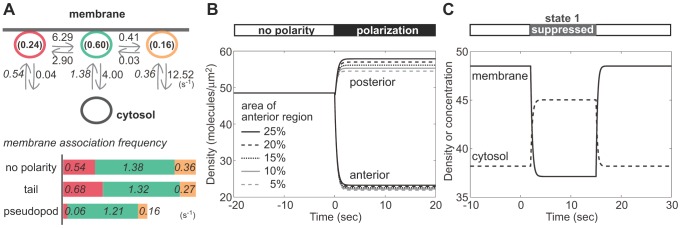
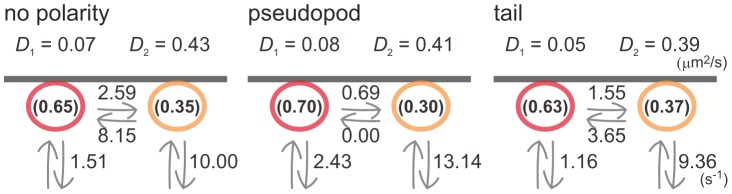
The molecular mechanisms that underlie asymmetric PTEN distribution at the posterior of polarized motile cells and regulate anterior pseudopod formation were addressed by novel single-molecule tracking analysis. Heterogeneity in the lateral mobility of PTEN on a membrane indicated the existence of three membrane-binding states with different diffusion coefficients and membrane-binding lifetimes. The stochastic state transition kinetics of PTEN among these three states were suggested to be regulated spatially along the cell polarity such that only the stable binding state is selectively suppressed at the anterior membrane to cause local PTEN depletion. By incorporating experimentally observed kinetic parameters into a simple mathematical model, the asymmetric PTEN distribution can be explained quantitatively to illustrate the regulatory mechanisms for cellular asymmetry based on an essential causal link between individual stochastic reactions and stable localizations of the ensemble.


Conflict of interest statement

The authors have declared that no competing interests exist.

Figures

Figure 1
Figure 1. Heterogeneities in PTEN molecules on the membrane of polarized cells.
(A) Fluorescent images of Dictyostelium discoideum cells expressing PTEN-Halo (top) and PTENG129E-Halo (bottom) labeled with TMR-conjugated HaloTag ligand. Cells moved leftward. Scale bar, 5 µm. (B) Asymmetric distribution of PTENG129E-Halo on the membrane upon stimulation with a cAMP gradient. The cell was treated with 5 µM Latrunculin A (top). The asterisk indicates the position of the pipette tip containing 1 µM cAMP (bottom). Scale bar, 5 µm. (C) Single molecules of PTENG129E bound to the membrane of a migrating cell. The arrow indicates the direction of movement. Scale bar, 5 µm. (D) Typical trajectories of single PTENG129E molecules observed at the pseudopod (left) and tail (right). (E) Dissociation curves of PTENG129E molecules observed at the pseudopod and tail. Fitting curves are from Eq. S11 using the parameter values described in Table 1. (F) Distributions of displacement during 33 ms of observation at the pseudopod and tail. Fitting curves are from Eq.11 assuming a three-state model. Diffusion coefficients and their proportions are described in Table 1 and Fig. 5C. (G) The time series of displacement of a PTENG129E molecule over a 33 ms window (excerpted from the whole trajectory observed at the tail). (H) Autocorrelation function calculated from the time series of displacements for 10 molecules observed at the tail. The fitting function is y = a*exp(−Kt)+b with K = 1.64 s−1. See also Movie S1.
Figure 2
Figure 2. Models of membrane-bound signaling molecules exhibiting diffusion, state transitions and membrane dissociation.
(A) Schematic view of the three principle models. (B,D,F) The probability density function (PDF) of molecular position at t = 0.033, 0.3 and 1 (B) or 0.033, 0.3 and 3 (D,F). (C,E,G) The membrane residence probability, R(t) (black), and the subpopulation probability, Q(t), for state 1 (green) and state 2 (orange). (insets in E and G) Time series of the subpopulation ratios. (B,C) Model S1. The PDFs before (dotted lines) and after (solid lines) incorporating the measurement error are shown. D = 0.01, λ = 1.00 and ε = 0.04. (D,E) Model S2. D 1 = 0.01, D 2 = 0.10, λ 1 = 0.10, λ 2 = 1.00, q 1 = 0.20 and ε = 0.04. (F,G) Model S3. D 1 = 0.01, D 2 = 0.10, λ 1 = 0.10, λ 2 = 1.00, k 12 = 0.10, k 21 = 0.50, q 1 = 0.20 and ε = 0.04. D, µm2s−1; λ, k, s−1; ε, µm. PDFs for Models S2 and S3 incorporate the measurement error. See also Figures S1.
Figure 3
Figure 3. Lifetime-diffusion analysis.
(A) An overview of lifetime-diffusion analysis. (B) Estimation of the state number. The trajectories generated by a numerical simulation using the same model as in Figure 2F are analyzed below. Displacement during a 33 ms window (open circle) was used for MLE (lines), which give AIC values (inset) that suggest the state number is two. The estimated diffusion coefficients are D 1 = 0.011 and D 2 = 0.100 µm2s−1. (C) Test for the state transitions and parameter estimation. The decay profiles of the subpopulations with diffusion coefficients D 1 (green) and D 2 (orange) show that the molecules exhibit state transitions. The estimated parameters are λ 1 = 0.110, λ 2 = 0.940, k 12 = 0.068, k 21 = 0.474 and q 1 = 0.197. (inset) Time series of the subpopulation ratios. (D) Consistency between the obtained model and the data. Histograms of molecular position are shown at five time points: t 1 = 1, t 2 = 2, t 3 = 3, t 4 = 4 and t 5 = 5 s. See also Figure S2.
Figure 4
Figure 4. Lifetime-diffusion analysis of PTENG129E in non-polarized cells.
(A) The dissociation curve of all molecules (open circles) and decay profiles of three subpopulations (crosses) fitted to Eqs. S11 and S12, respectively (solid lines). (B) The distribution of displacement during a 33 ms window obtained from the trajectories (open circles) and fitting function Eq. 11, assuming 1 (small dotted line), 2 (large dotted line) or 3 states (solid line). (inset) AIC values show at least three states are required to explain the data. (C) The time series of the subpopulation ratios. Fitting curves were obtained from Eqs. S11 and S12. (D) The distribution of molecular position at indicated times after the membrane association. Fitting curves were obtained from Eq. S10. (E) Kinetic model describing the state transitions and membrane dissociations in non-polarized cells. All kinetic parameter values estimated in (A)–(D) are summarized in the scheme. See also Movie S2.
Figure 5
Figure 5. Lifetime-diffusion analysis of PTENG129E;Δ15 in non-polarized cells.
(A) Fluorescent images of Dictyostelium discoideum cells expressing PTENG129E–Halo (upper panel) or PTENG129E;Δ15–Halo (lower panel) labeled with a TMR-conjugated HaloTag ligand (left). Fluorescence intensity along a white line was measured (right). Red bars indicate the area corresponding to the membranes. Scale bar, 10 µm. (B) The dissociation curve of all PTENG129E;Δ15 molecules (open circles) and decay profiles of three subpopulations (crosses) fitted to Eqs. S11 and S12, respectively (solid lines). (C) The distribution of displacement during a 33 ms window obtained from the trajectories (open circle) and fitting function Eq. 11, assuming 1 (small dotted line), 2 (large dotted line) or 3 states (solid line). (inset) AIC values show at least three states are required to explain the data. (D) Kinetic model describing the state transitions and membrane dissociation of PTENG129E;Δ15 in non-polarized cells. The difference in membrane-to-cytoplasm ratio of fluorescence intensity is related to the difference in membrane association rate (s−1) between PTENG129E and PTENG129E;Δ15 which dissociated from the membrane at the same rate on average.
Figure 6
Figure 6. Lifetime-diffusion analysis of PTENG129E in polarized cells.
(A) The decay profiles of three subpopulations obtained from molecules observed at the pseudopod (crosses) and fitted to Eq. S12 (solid lines). (B) The decay profiles of three subpopulations obtained from molecules observed at the tail (crosses) and fitted to Eq. S12 (solid lines). (C) Kinetic model describing the state transitions and membrane dissociation in polarized cells. All kinetic parameter values estimated in (A) and (B) are summarized in the scheme. See also Movie S1.
Figure 7
Figure 7. Simulations of the intracellular distribution.
(A) Estimation of membrane association frequencies that a single cytoplasmic molecule associates with the membrane during 1 sec via three states. (B) The density of membrane bound molecules in the absence or presence of cellular polarity. (C) A temporal change in the density on the membrane (molecules/µm2) and the concentration in the cytosol (molecules/µm3) as μ 1 approaches 0 during t = 2 to 15 sec.
Figure 8
Figure 8. Lifetime-diffusion analysis assuming a two-state model.
Kinetic model describing the state transitions and membrane dissociations in non-polarized cells and at the pseudopod and tail of polarized cells. All kinetic parameter values estimated are summarized in the scheme.

Similar articles

Cited by

References

    1. Denhardt DT (1996) Signal-transducing protein phosphorylation cascades mediated by Ras/Rho proteins in the mammalian cell: the potential for multiplex signaling. Biochem J 318(3): 729–47. - PMC - PubMed
    1. Vivanco I, Sawyers CL (2002) The phosphatidylinositol 3-Kinase AKT pathway in human cancer. Nat Rev Cancer 2(7): 489–501. - PubMed
    1. Rhee SG (2001) Regulation of phosphoinositide-specific phospholipase C. Annu Rev Biochem 70: 281–312. - PMC - PubMed
    1. Au-Yeung BB, Deindl S, Hsu LY, Palacios EH, Levin SE, et al. (2009) The structure, regulation, and function of ZAP-70. Immunol Rev 228(1): 41–57. - PubMed
    1. Shattil SJ, Kim C, Ginsberg MH (2010) The final steps of integrin activation: the end game. Nat Rev Mol Cell Biol 11(4): 288–300. - PMC - PubMed

Substances