Meta-Analysis
. 2013;9(1):e1002863.
doi: 10.1371/journal.pcbi.1002863. Epub 2013 Jan 10.

A guide to enterotypes across the human body: meta-analysis of microbial community structures in human microbiome datasets

Affiliations
Meta-Analysis

A guide to enterotypes across the human body: meta-analysis of microbial community structures in human microbiome datasets

Omry Koren et al. PLoS Comput Biol. 2013.

Abstract

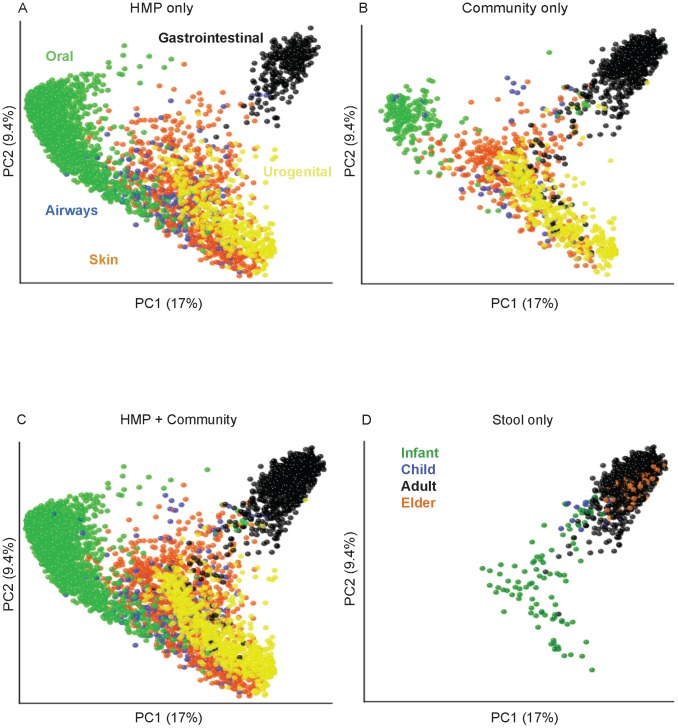
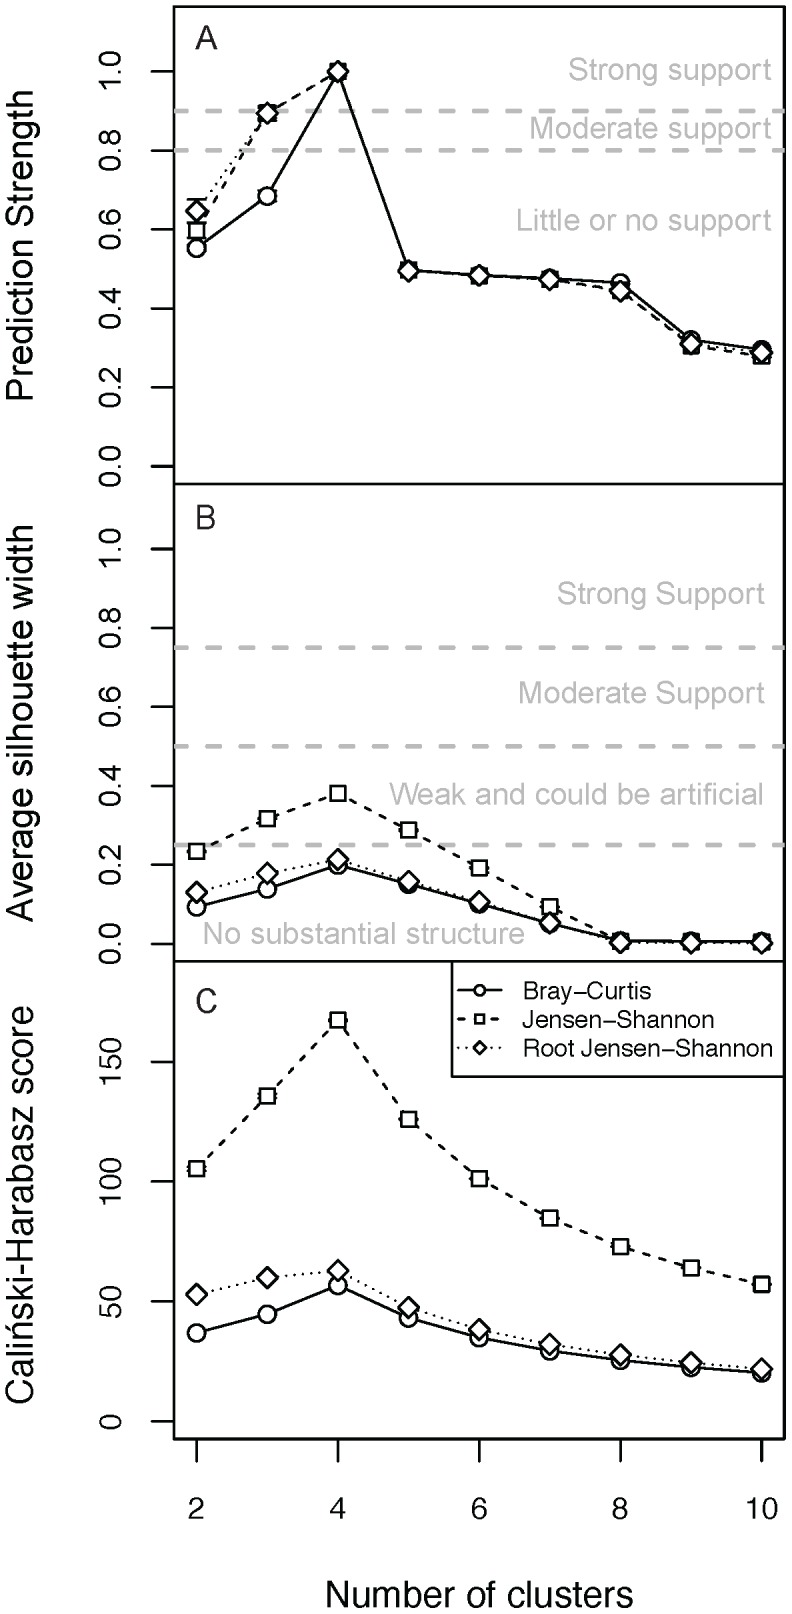
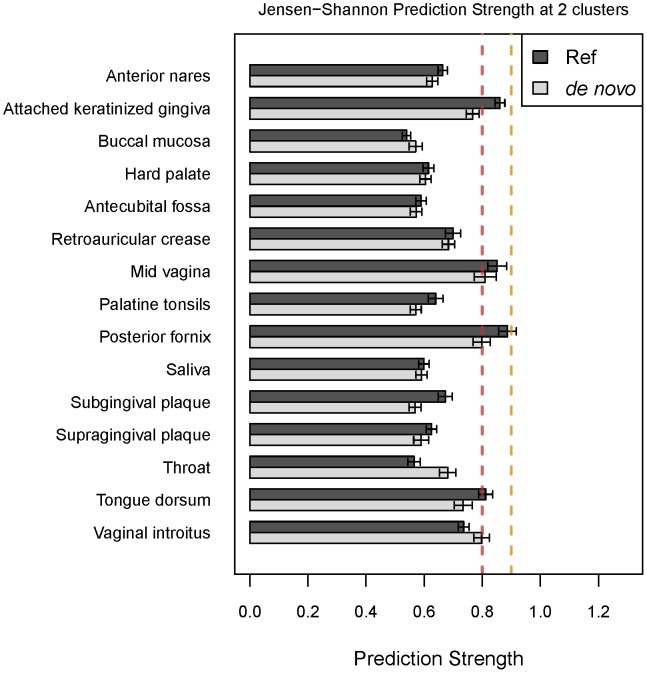
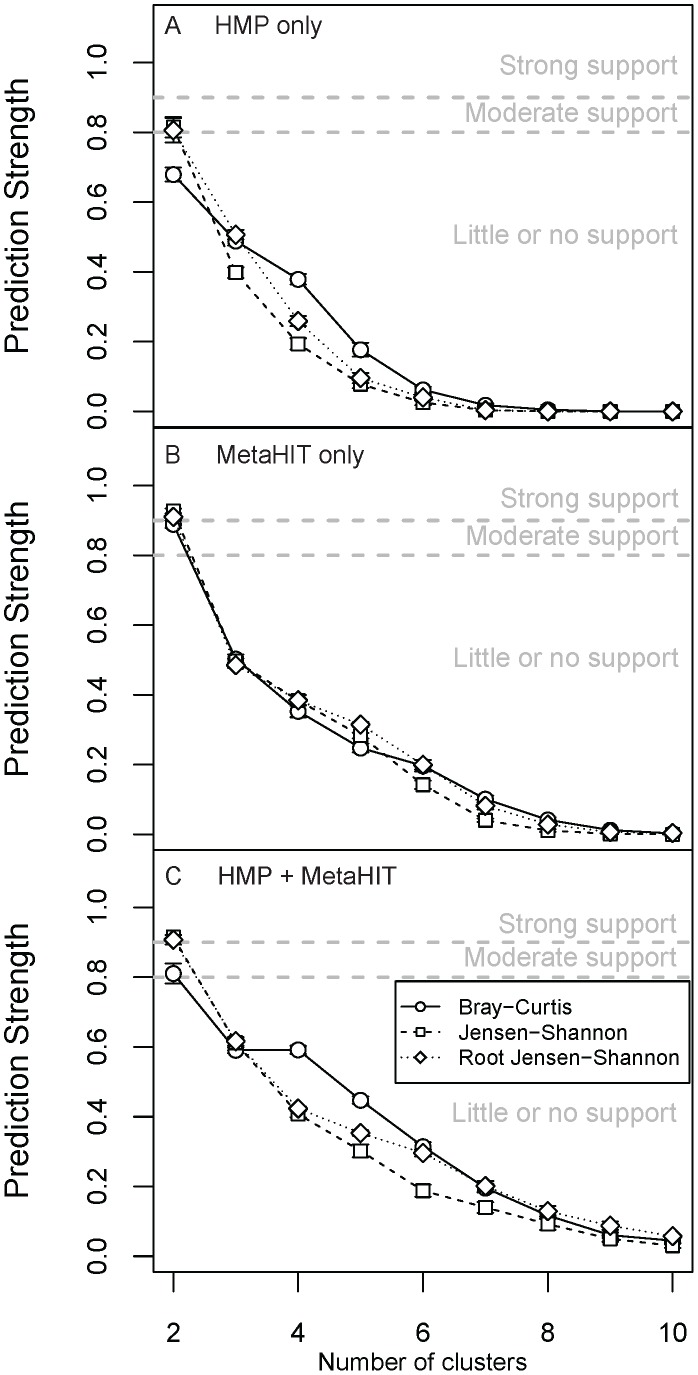
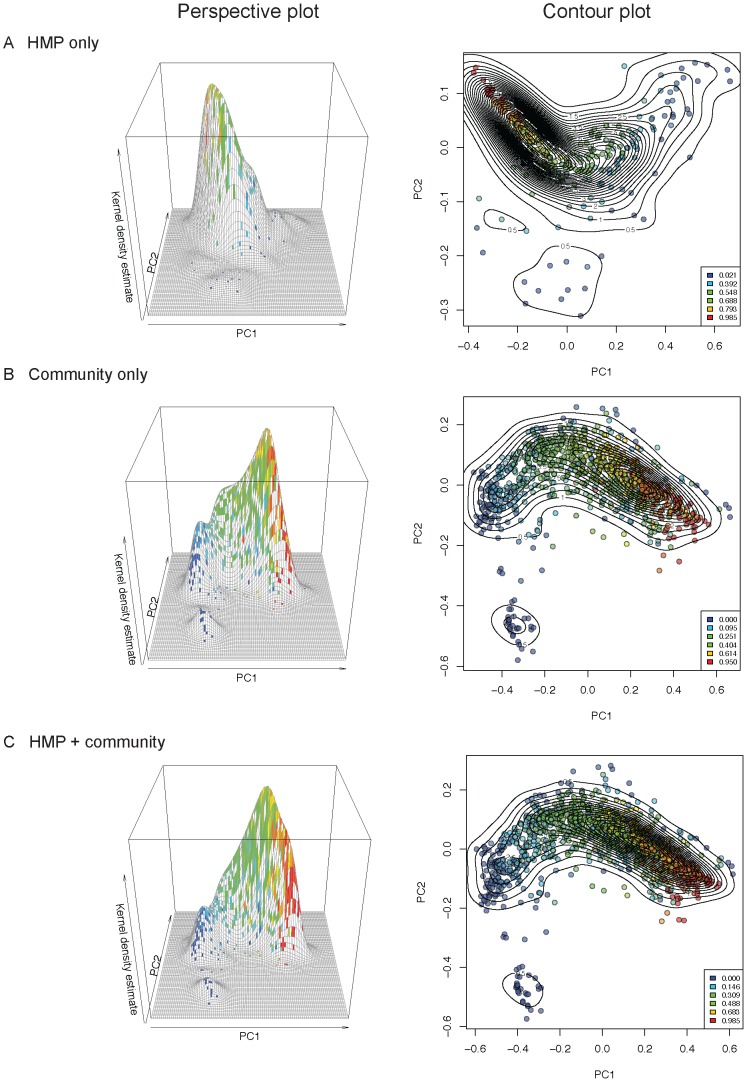
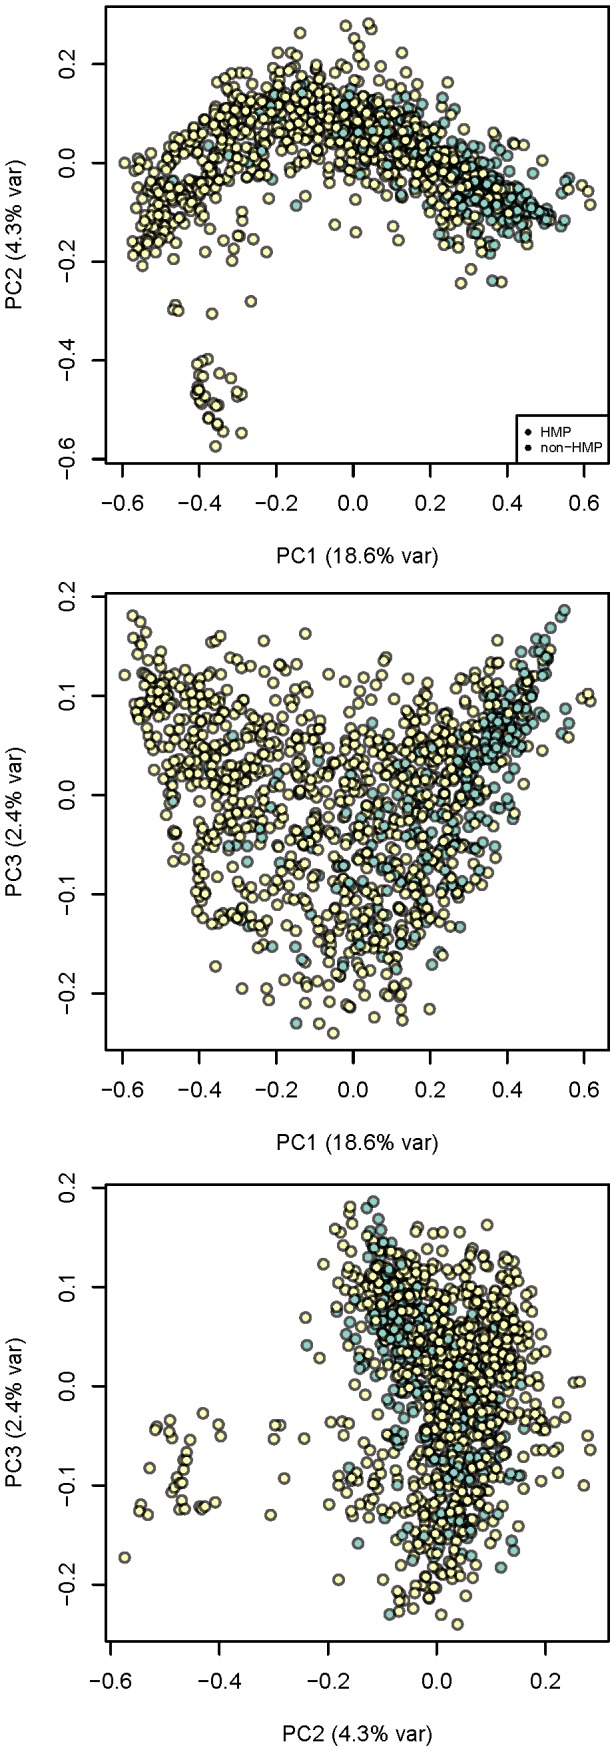
Recent analyses of human-associated bacterial diversity have categorized individuals into 'enterotypes' or clusters based on the abundances of key bacterial genera in the gut microbiota. There is a lack of consensus, however, on the analytical basis for enterotypes and on the interpretation of these results. We tested how the following factors influenced the detection of enterotypes: clustering methodology, distance metrics, OTU-picking approaches, sequencing depth, data type (whole genome shotgun (WGS) vs.16S rRNA gene sequence data), and 16S rRNA region. We included 16S rRNA gene sequences from the Human Microbiome Project (HMP) and from 16 additional studies and WGS sequences from the HMP and MetaHIT. In most body sites, we observed smooth abundance gradients of key genera without discrete clustering of samples. Some body habitats displayed bimodal (e.g., gut) or multimodal (e.g., vagina) distributions of sample abundances, but not all clustering methods and workflows accurately highlight such clusters. Because identifying enterotypes in datasets depends not only on the structure of the data but is also sensitive to the methods applied to identifying clustering strength, we recommend that multiple approaches be used and compared when testing for enterotypes.


Conflict of interest statement

The authors have declared that no competing interests exist.

Figures

Figure 1
Figure 1. Bacterial diversity clusters by body habitat.
A–C: All body sites. The two principal coordinates from the PCoA analysis of the unweighted UniFrac distances are plotted for (A) HMP data; (B) community data (see Table S1 for list of studies), (C) both datasets combined. Symbol colors correspond to body sites as indicated on panel A. Panel D shows gut samples (majority are fecal) divided into infants (green), children (blue), adults (black) and elderly (orange) samples. The variance explained by the PCs is indicated in parentheses on the axes.
Figure 2
Figure 2. A positive control of cluster structure recovered from lognormally distributed synthetic community data containing four clusters.
Presence of enterotypes was tested using: (A) prediction strength, (B) silhouette index and (C) Caliński-Harabasz combined with BC, JSD and rJSD distance metrics. Bars are standard errors.
Figure 3
Figure 3. Clustering scores for enterotypes in fecal samples using 16S rRNA data.
(A) Prediction strength scores, (B) Caliński-Harabasz and (C) average silhouette scores calculated using 5 distances metrics for HMP data only, adult community data, and combined HMP and adult community data. The thresholds for significance of clustering scores are indicated as dashed lines on the plots. Bars are standard errors.
Figure 4
Figure 4. Enterotypes in mid vaginal samples in both the HMP and the Ravel
Prediction strength scores calculated using 5 distances metrics for HMP mid vaginal samples at the genus level (A), Ravel et al. mid vaginal samples at the genus level (B). HMP mid vaginal samples at the species level (C) and Ravel et al. mid vaginal samples at the species level (D). The thresholds for significance of clustering scores are indicated as dashed lines on the plots. Bars are standard errors.
Figure 5
Figure 5. A comparison of prediction scores using different OTU picking methods.
Prediction strength scores were calculated with JSD at 2 clusters using either OTUs generated using a reference-based approach or de novo.
Figure 6
Figure 6. Prediction scores for enterotypes in fecal samples using WGS data.
Prediction strength scores calculated using 3 distances metrics for (A) HMP, (B) MetaHIT and (C) HMP + MetaHIT data. The thresholds for significance of clustering scores are indicated as dashed lines on the plots. Bars are standard errors.
Figure 7
Figure 7. Gradients of OTU abundances are evident in the combined dataset of fecal samples.
HMP and community fecal samples are shown in a PCoA of weighted UniFrac distances. Samples are colored according to (A) putative cluster membership and by their abundances (0–1, see legend inserts) of (B) Bacteroides, (C) Faecalibacterium and (D) Prevotella.
Figure 8
Figure 8. The fecal microbiota exhibit a smooth gradient of Bacteroides abundances across samples from the HMP and community studies.
Bacteroides abundances are mapped onto the first two principal coordinates of the weighted UniFrac PCoA analysis for HMP data (A), community data (B), and combined HMP and community data (C). Left panels: 3D plots showing kernel density estimates mapped onto PC1 and PC2; Right panels: contours indicate sample densities, sample colors indicate Bacteroides relative abundances ranging from 0–1, where 1 = 100% Bacteroides; color levels are determined by quantiles to allow visual comparison of any distribution of relative abundances (e.g., 0% of samples fall below the first threshold, 20% below the second threshold, 40% below the third, etc.)
Figure 9
Figure 9. HMP fecal samples are slightly enriched in Bacteroides abundances compared to community samples.
The projection from Fig. 8C, right panel, is colored to show if samples originate from the HMP (blue) or community (yellow), and all PC combinations are shown. See Fig. 8 for description of the axes.

Similar articles

Cited by

References

    1. Qin J, Li R, Raes J, Arumugam M, Burgdorf KS, et al. (2010) A human gut microbial gene catalogue established by metagenomic sequencing. Nature 464: 59–65. - PMC - PubMed
    1. The Human Microbiome Project Consortium (2012) Structure, function and diversity of the healthy human microbiome. Nature 486: 207–214. - PMC - PubMed
    1. Arumugam M, Raes J, Pelletier E, Le Paslier D, Yamada T, et al. (2011) Enterotypes of the human gut microbiome. Nature 473: 174–180. - PMC - PubMed
    1. The Human Microbiome Project Consortium (2012) A framework for human microbiome research. Nature 486: 215–221. - PMC - PubMed
    1. Caporaso JG, Kuczynski J, Stombaugh J, Bittinger K, Bushman FD, et al. (2010) QIIME allows analysis of high-throughput community sequencing data. Nat Methods 7: 335–336. - PMC - PubMed

Publication types

Substances